

 PDF
PDF ePub
ePub Citation
 Print
Print


INTRODUCTION
The time of college students is an important and unique developmental stage for the establishment of health-related behavioral patterns since it is the transition phase from adolescence to adulthood, and increasing independence and autonomy [1]. However, college students may experience poor dietary habits. It has been reported that unhealthy dietary habits, such as irregular eating and skipping breakfast, were more frequent than those observed in high school students due to the increased time away from home and lack of ability and time to cook [23]. Health-related problems related to economic independence and sociocultural changes of college students are known to occur; these include an increase consumption of instant/processed foods and alcohol, low consumption of vegetables, fruits, and dairy products, and increasingly sedentary lifestyles [45].
The concept of ‘Freshman 15’ has emerged in the United States, which refers to approximately 15 pounds (6.8 kg) of weight gained during the first year of college due to changes in diverse foods and lifestyles [6]. Those changes have been associated with increased prevalence of obesity, dyslipidemia, and cardiovascular diseases in college students [7]. In addition, dietary patterns of college students are changing with westernization which can cause important long-term health implications, and they have a greater impact in developing countries than in developed countries [8].
China (including Hong Kong and Macao), Japan, Korea, Mongolia, North Korea, and Taiwan are countries located in Northeast Asia. Of these, Korea and Mongolia are historically, geographically, and anthropologically close countries. Since the commencement of diplomatic relations between the two countries in 1990, diplomatic exchanges are in existence in terms of sociocultural aspects. Especially, due to the influence of the “Korean Wave”, a wide distribution and exchange of Korean food products have been implemented [9]. Despite similar cultural characteristics, there is a difference in economic and nutrition levels between Korea and Mongolia. Major international organizations such as the United Nations, Organization for Economic Cooperation and Development, and International Monetary Fund classified Korea as a developed country, but Mongolia is classified as a developing country [1011]. In order to promote the health of children and adolescents, the School Meal Act was enacted in Korea in 1981. However, in Mongolia snacks for lunch of school children is currently served, and school meals have been piloted by food and nutrition non-governmental organization ‘WITH’ of Korea with Mongolian Ministry of Education and Culture since 2006 [12]. Although it is therefore necessary to understand the dietary patterns of the two countries, so far no comparative studies have been conducted on the dietary lifestyles. Korea has continuously studied implications of nutrition on youth and college students, and previous comparative studies have been conducted with respect to the dietary life in China, Japan, and Taiwan, among the Northeast Asian countries [131415]. Apart from the absent comparative studies on dietary life between Korean and Mongolian college students, studies on the nutrition for Mongolian people are also insufficient.
Therefore, this study was conducted to compare body image perception, nutrition knowledge, dietary attitudes, dietary habits, and health-related lifestyles between Korean and Mongolian college students. Based on the results of this study, we aimed to assess the level of nutrition knowledge, and understand the dietary attitudes, dietary habits, and healthrelated lifestyles between Korean and Mongolian college students. We propose that our results will be the basic data for the improvement of nutrition education and nutrition management for a desirable dietary life and health of Northeast Asian college students.
Go to : 
SUBJECTS AND METHODS
Subjects
The subjects of this cross-sectional study were college students in Incheon, Korea, and Ulaanbaatar, Mongolia. A survey, using an anonymous self-administered questionnaire, was conducted from April to July 2017. Totally, 320 Korean college students (KCS) and 320 Mongolian college students (MCS) were given consent forms to confirm their participation in this study. For data analysis, 314 KCS and 280 MCS questionnaires were used. Questionnaires of incomplete data, pregnant students, vegetarians, and students doing a fasting cure were excluded from the final analysis. This study was approved by the institutional review board of Inha University, Korea (No. 170220-5A).
Study contents and procedure
The questionnaire for this study was based on previous studies [1617]; it was first written in Korean and then translated to Mongolian. The preliminary survey was conducted for 15 KCS and 15 MCS; consequently, MCS proposed using easy-to-understand language, and KCS requested removal of duplicate entries. The final questionnaire was comprised of five major sections regarding body image perception, nutrition knowledge, dietary attitudes, dietary habits, and health-related lifestyles (total 50 questions).
General characteristics of subjects included gender, age, residential type, and monthly pocket money. Anthropometric data were presented as self-reported height and body weight, and the body mass index (BMI) was calculated as body weight in kg divided by height in meters squared (BMI = kg/m2). According to the 2000 Asia-Pacific Region Criteria adopted by the Korean Society for the Study of Obesity [18], body weight status of subjects was classified based on the calculated BMI value, as follows: underweight (BMI < 18.5), normal weight (BMI 18.5–22.9), overweight (BMI 23.0–24.9), and obesity (BMI ≥ 25).
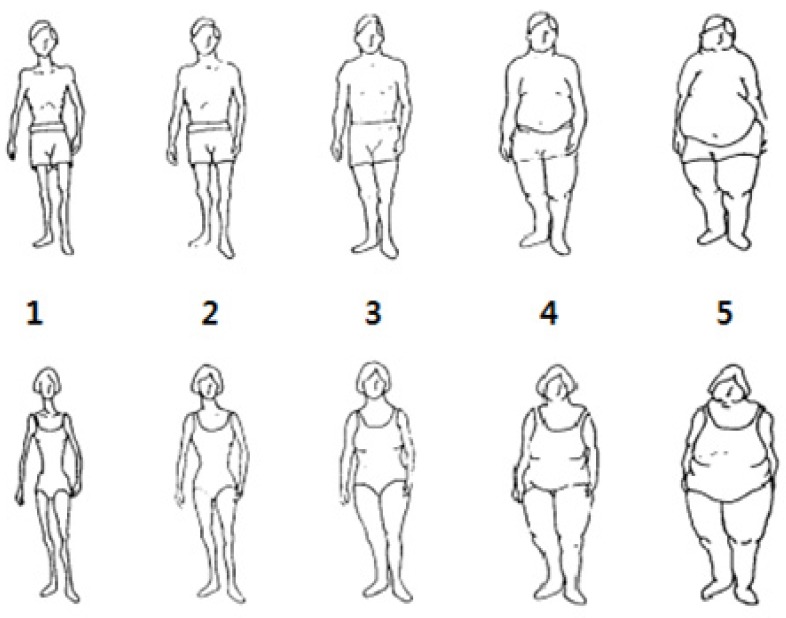
Items related to body image perception were presented as self-reported current body image (CBI), ideal body image (IBI), and desirable body image (DBI). In general, the assessment of body image perception was based on 9 figures (ranging from 1 (most thin) to 9 (most obese)) by the Stunkard's body image assessment scale [19] and by body image assessment scale of the Ambrosi-Randić N1's study [20] (where plus-minus two from 7 figures ranging was the most appropriate). The body image assessment scale of this study was classified into 5 categories: 1 thinnest, 2 thin, 3 normal, 4 fat, and 5 fattest (Fig. 1), wherein we selected 5 figures of the Stunkard's nine figures. As per a method used in previous studies [21], the difference between CBI and IBI was calculated as a discrepancy of body image satisfaction (CBI-IBI), and a difference between IBI and DBI was calculated as a discrepancy of body image value (IBI-DBI).
Experience of nutrition education and sources of nutrition information were evaluated by two factors items. Level of nutrition knowledge was assessed based on 20 items regarding general health-related nutrition knowledge. Each item was answered with “right”, “wrong”, and “do not know”; calculations were scored as 1 point for the correct answer and 0 points for the wrong answer and unknowingness. The total score was the summated score of correct responses out of 20 nutrition knowledge questions. The Cronbach's coefficient of nutrition knowledge was 0.741 at KCS and 0.612 at MCS.
Dietary attitudes were assessed for 10 items regarding the attitudes toward food intake for health. The items were measured using a Likert 5-point scale, and each item was scored as 1 point “strongly disagree”, 2 points “disagree”, 3 points “so-so”, 4 points “agree”, and 5 points “strongly agree”. After reverse coding of negatively worded 3 and 8 items, a total score of dietary attitudes was measured as the summated score of each item out of 50 points; a higher score indicated better dietary attitudes. The Cronbach's coefficient of dietary attitudes was 0.709 at KCS and 0.627 at MCS.
Dietary habits were assessed using 8 items, including frequency of meal per day and breakfast per week, regularity and size of a meal, frequency and type of eating out and meal purchasing, and self-recognized problems of dietary habits. All items consisted of a closed-ended question and were selected for the most appropriate response as per their dietary habit status from categories by subjects.
Health-related lifestyles were assessed for 7 items, including frequency of alcohol drinking, number of cigarettes smoked, frequency of exercise, watching TV, using computer, mobile phone usage, and sleeping time. Especially, the frequency of exercise was determined by the number of exercises performed periodically.
Statistical analysis
Data on 314 KCS and 280 MCS were analyzed using SPSS 23.0 (SPSS Inc., IBM corp., NY, USA). Frequency and percentage, or mean and standard deviation for each survey item were calculated using descriptive statistics. The chi-square test or Student t-test was performed for verifying the significance of all data differences between KCS and MCS. However, nutrition knowledge was compared between KCS and MCS using a non-parametric Mann-Whitney U test because data was non-normal distribution; KCS showed that P < 0.001 at Kolmogorov-Smirnov and Shapiro-Wilk, and −2.580 at skewness [22].
Correlations between total score of nutrition knowledge and dietary attitudes were determined using non-parametric Spearman's rank correlation coefficient for KCS since data was non-normal distribution, and Pearson's correlation coefficient for MCS. The level of all statistical significance was set at P <0.05.
Go to :
RESULTS
General characteristics of subjects by country
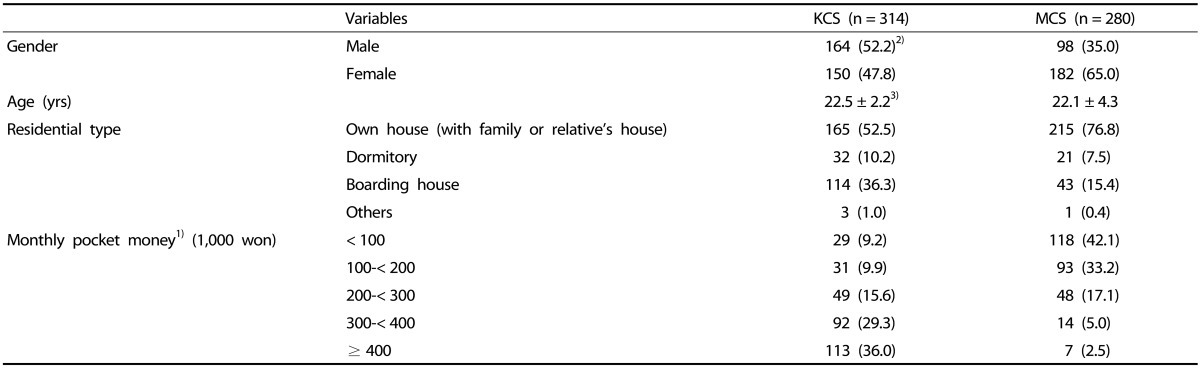
General characteristics of subjects are shown in Table 1. The proportions of male and female subjects were 52.2% and 47.8% in KCS, and 35.0% and 65.0% in MCS, respectively. The average age of KCS was 22.5 years and that of MCS was 22.1 years. With regards to residence, maximum subjects resided at their own house (with family or relative's house) in both countries (52.5% of KCS and 76.8% of MCS), and 46.5% of KCS and 22.9% of MCS lived in dormitory and boarding house. Monthly pocket money of 65.3% in KCS and 7.5% in MCS was over 300,000 won. The prices in Korea and Mongolia are similar, but it is known that salaries in Korea are about 10 times higher than those in Mongolia; 1,352,230 won in Korea and 108,000 won in Mongolia in the case of monthly minimum wage in 2017 [23], so we considered that the monthly pocket money for college students in the two countries was different.
Anthropometric data of subjects by gender and country
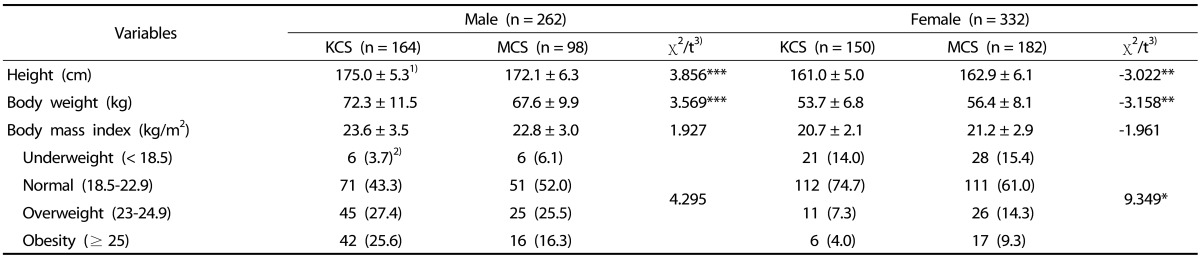
The differences in anthropometric data between KCS and MCS by gender are shown in Table 2. The average height and body weight of male subjects was 175.0 cm and 72.3 kg in KCS, and 172.1 cm and 67.6 kg in MCS (P < 0.001), respectively. In female subjects, the average height and body weight was 161.0 cm and 53.7 kg in KCS, and 162.9 cm and 56.4 kg in the MCS (P < 0.01), respectively. The average BMI of subjects by gender showed no significant difference between both countries. In female subjects, the body weight status based on BMI value showed a significant difference in 11.3% of KCS and 23.6% of MCS, for subjects who were overweight or more (P < 0.05).
Body image perception of subjects by gender and country
As shown in Table 3, the average score of CBI in KCS and MCS was 2.7 and 2.4 in male subjects (P < 0.01), and 2.6 and 2.2 in female subjects (P < 0.001), respectively. The average IBI score in KCS and MCS was 2.5 and 2.4 in male subjects, and 1.9 and 1.9 in female subjects, respectively, without a significant difference. The average DBI score in KCS and MCS was 2.6 and 2.3 in male subjects (P < 0.001), and 2.2 and 2.1 in female subjects (P < 0.01), respectively.
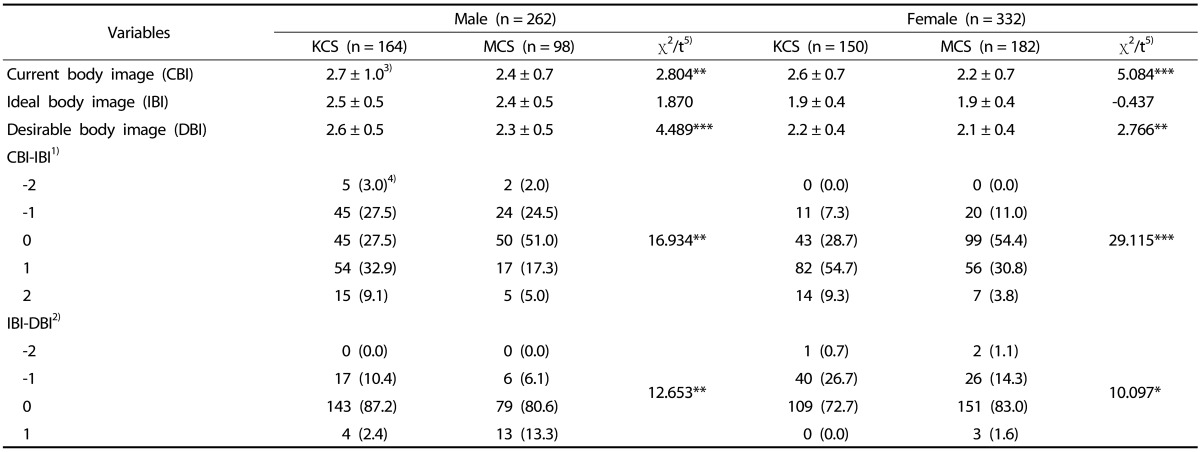
Table 3
Body image perception of subjects by gender and country
KCS, Korean college students; MCS, Mongolian college students.
1) Values of the current body image minus the ideal body image were discrepancy of body image satisfaction
2) Values of the ideal body image minus the desirable body image were discrepancy of body image value
3) Mean ± SD; possible score was 1 (thinnest) to 5 (fattest)
4) n (%)
5) P-values were analyzed by Student t-test or chi-square test; * P < 0.05, ** P < 0.01, *** P < 0.001
![]()
As for a discrepancy of body image satisfaction (CBI-IBI), 27.5% of KCS and 51.0% of MCS in male subjects were satisfied with their CBI, and 42.0% of KCS and 22.3% of MCS wanted to have a thinner body image (P < 0.01). In female subjects, 28.7% of KCS and 54.4% of MCS were satisfied with their CBI, and 64.0% of KCS and 34.6% of MCS wanted to have a thinner body image (P < 0.001). As for a discrepancy of body image value (IBI-DBI), 10.4% of KCS and 6.1% of MCS in male subjects (P < 0.01) and 27.4% of KCS and 15.4% of MCS in female subjects (P < 0.05) were perceived that DBI was fatter than IBI, respectively. Male and female subjects with same IBI and DBI were 87.2% of KCS and 72.7% MCS and 80.6% of KCS and 83.0% of MCS, respectively, and with most subjects being in agreement with IBI and CBI.
Nutrition knowledge of subjects by country
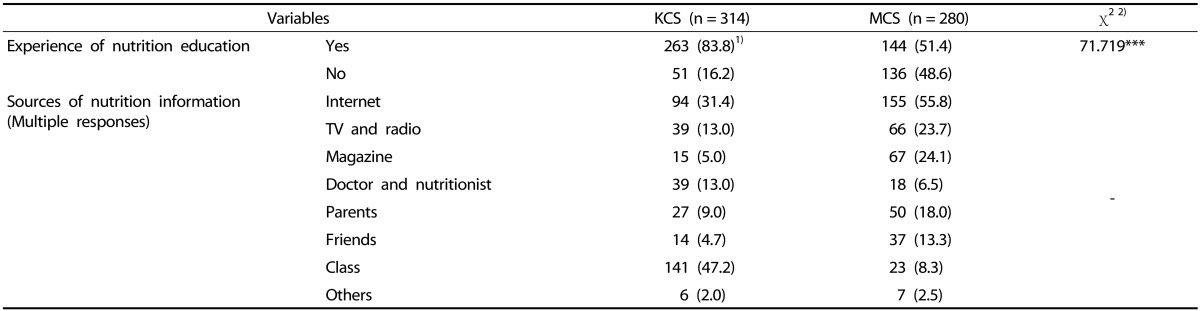
As presented in Table 4, 83.8% of KCS and 51.4% of MCS had experience of nutrition education (P < 0.001). Analyzing multiple responses regarding sources of nutrition information revealed 47.2% from a school class, 31.4% from internet, and 13.0% from TV/radio in order in KCS and 55.8% from internet, 24.1% from magazine, and 23.7% from TV/radio in order in MCS.
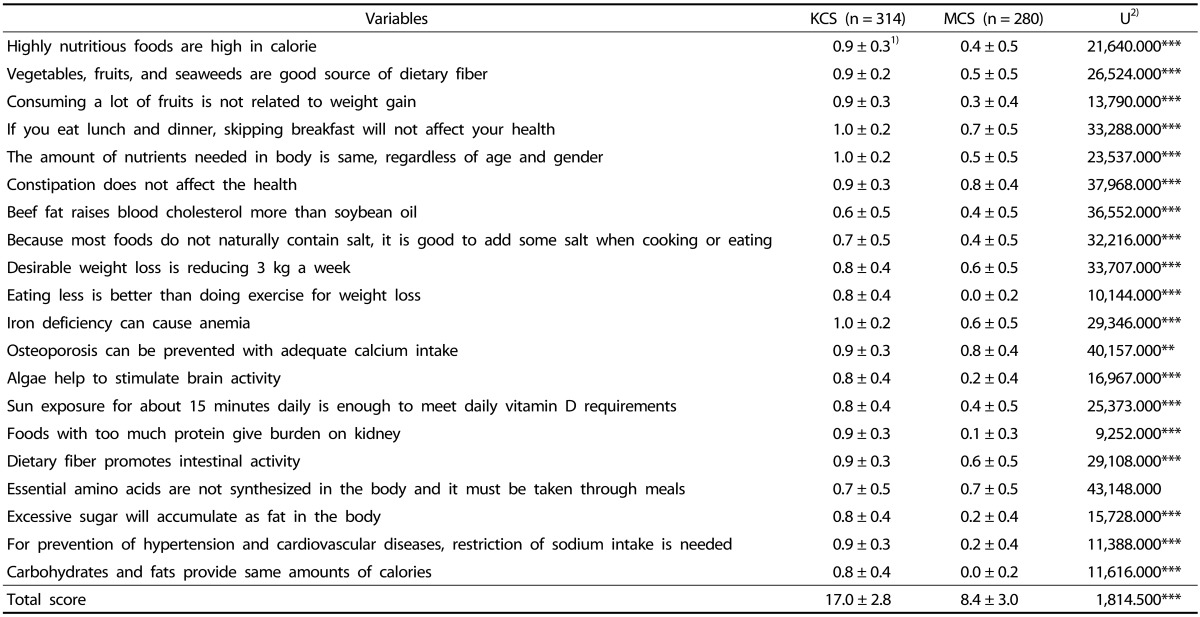
As shown in Table 5, the average total score of nutrition knowledge (out of 20.0 points) in KCS (17.0 points) was significantly different and was twice as high compared to MCS (8.4 points, P < 0.001). For all questions, except for the question “Essential amino acids are not synthesized in the body and it must be taken through meals”, the rate of correct answers was significantly higher for KCS compared to MCS.
Dietary attitudes of subjects by country
The average total score of dietary attitudes (out of 50 points) in KCS (27.0 points) was significantly lower compared to MCS (31.2 points, P < 0.001) (Table 6).
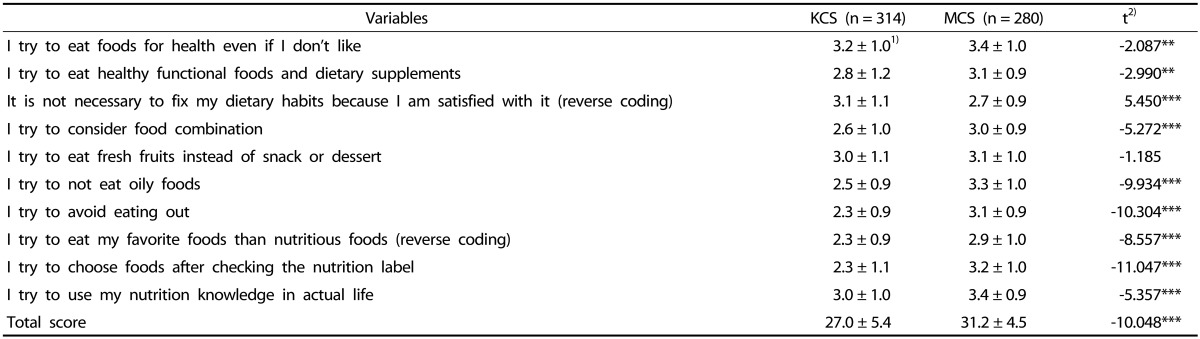
Within KCS, the highest dietary attitudes score was achieved for “I try to eat foods for health even if I don't like” (3.2 points), and factors with the lowest score included “I try to avoid eating out”, “I try to eat rather my favorite foods than nutritious foods”, and “I try to choose foods after checking the nutrition label” (all 2.3 points). For MCS, the highest dietary attitude score was for “I try to eat foods for health even if I don't like” and “I try to use my nutrition knowledge in actual life” (3.4 points), whereas the lowest score was for “It is not necessary to fix my dietary habits because I am satisfied with it” (2.7 points).
Correlation between nutrition knowledge and dietary attitudes
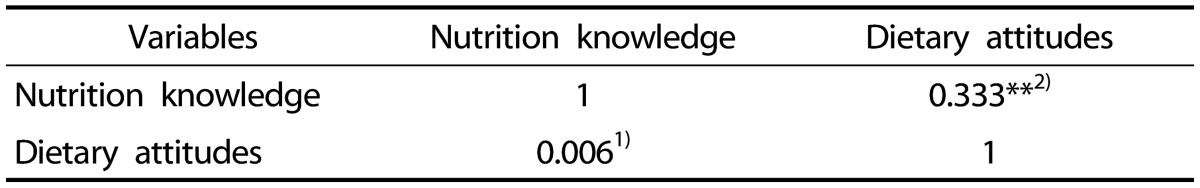
As shown in Table 7, KCS showed a positive correlation but not significant. Whereas MCS showed a significantly positive correlation between nutrition knowledge and dietary attitudes, and the higher the level of nutrition knowledge, higher was the dietary attitudes (P < 0.01).
Dietary habits of subjects by country
Table 8 presents dietary habits of subjects by gender and country. Daily meals were consumed 2 times by 55.5% and 3 times by 43.3% in male KCS, and 3 times by 50.0% and 2 times by 30.6% in MCS (P < 0.001). Those of female subjects were 2 times for 62.7% and 3 times for 34.7% in KCS, and 3 times for 50.0% and 2 times for 29.7% in MCS (P < 0.001). Rate of skipping breakfast for KCS was significantly higher compared to MCS in both genders; male subjects: 17.1% of KCS and 7.1% of MCS (P < 0.05), female subjects: 24.7% of KCS and 7.7% of MCS (P < 0.001). Regularity of meals was significantly more desirable in 41.4% of male KCS compared to 17.3% of male MCS (P < 0.001); however, there was no significant difference between female subjects.
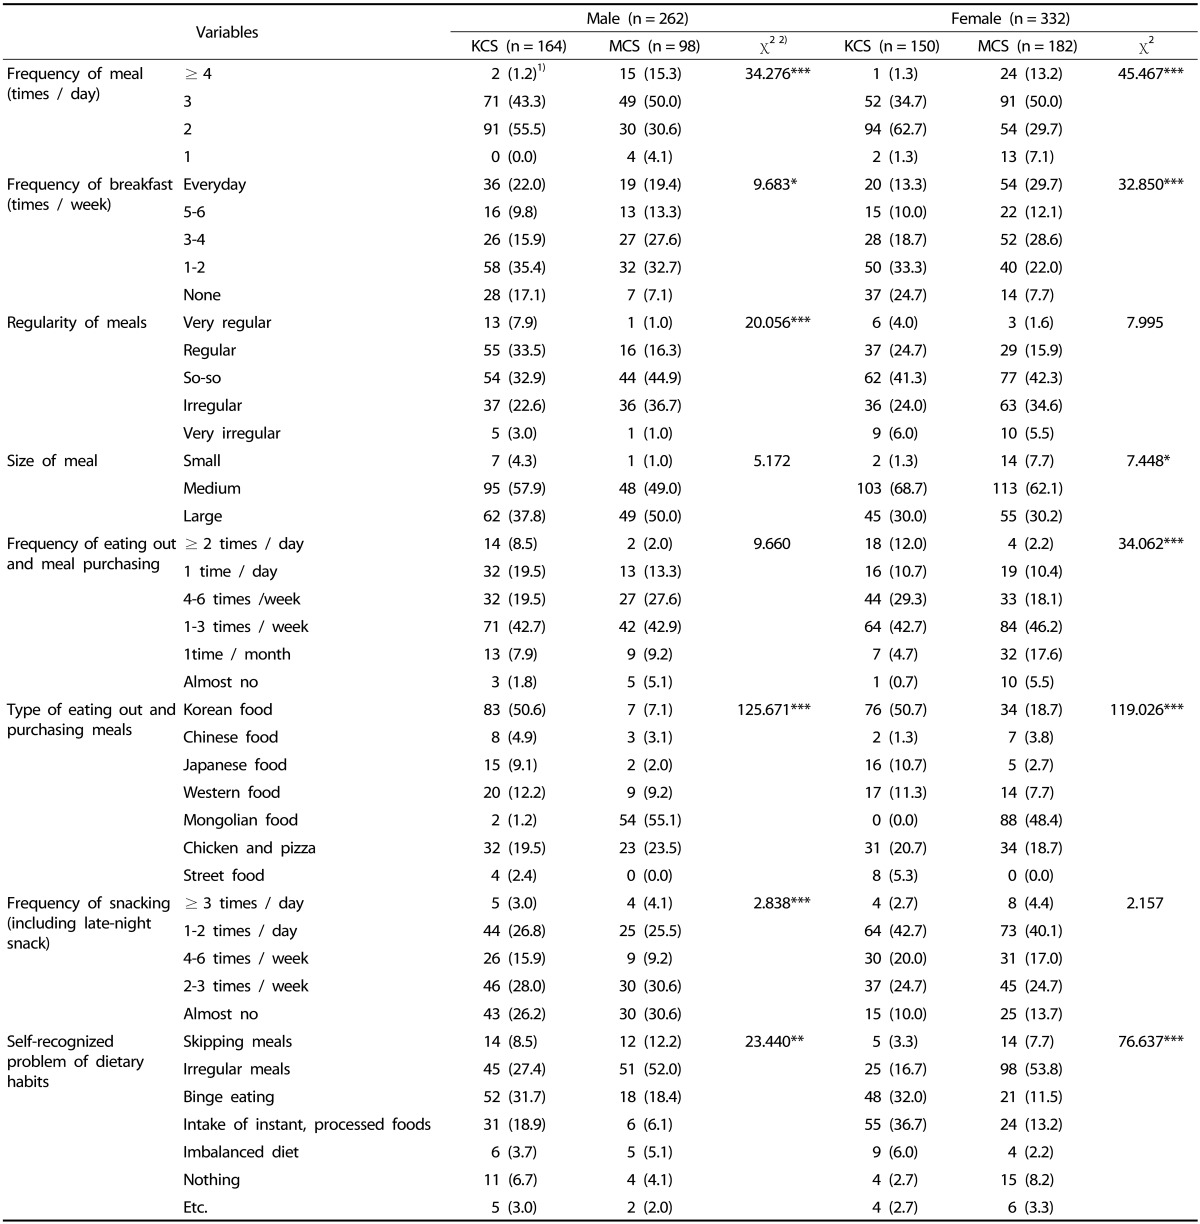
Frequency of eating out and purchasing meals was not significantly different for male subjects; however, for female subjects, 52.0% of KCS consumed outside meals more than 4 times a week and was significantly higher compared to 30.7% of MCS (P < 0.001). Considering the cuisine preferred when eating out and purchasing meals, more than 50% of subjects in both countries showed a preference for food of their own countries, and the second highest preference was for chicken and pizza. However, 18.7% of female MCS preferred Korean food for the second time as the same ranking as chicken and pizza.
The self-recognized problems of dietary habits differed significantly by gender and country. Data for male subjects reported 31.7% binge eating and 27.4% irregularity of meals in KCS, and 52.0% irregularity of meals and 18.4% binge eating in MCS (P < 0.01). Female subjects reported 36.7% intake of instant/processed food and 32.0% binge eating in KCS, and 53.8% for irregular meals and 13.2% intake of instant/processed food in MCS (P < 0.001).
Health-related lifestyles of subjects by country
Table 9 presents health-related lifestyles of subjects by gender and country. Frequency of drinking alcohol “more than once a week” was significantly different, being 47.6% and 2.0% in male KCS and MCS, and 44.7% and 2.0% in female KCS and MCS, respectively (P < 0.001). Smokers among male subjects were 23.7% of KCS and 25.6% of MCS. Of these, 12.2% of KCS smoked 6–10 cigarettes a day, and 13.3% of MCS smoked 1–5 cigarettes a day, which showed a significant difference in the amount of smoking (P < 0.01). Among female subjects, KCS (0.7%) showed a significantly lower smoking rate than MCS (6.5%) (P < 0.05). Frequency of exercising more than 3 times a week in KCS (57.3% of males and 36.0% of females) was significantly higher compared to MCS (24.5% of males and 24.7% of females) (P < 0.001 in male subjects and P < 0.01 in female subjects).
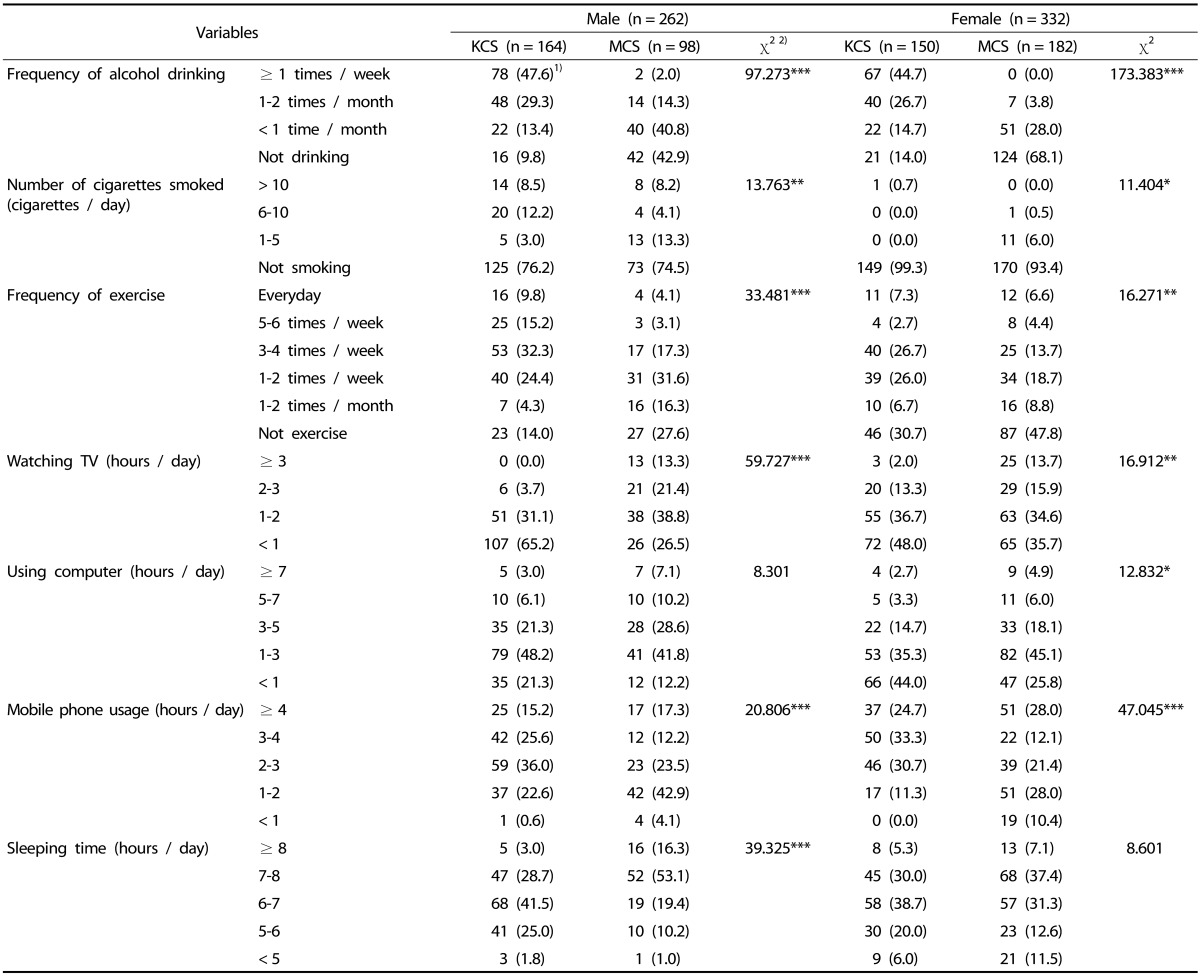
Subjects who watched TV for more than 2 hours a day were 3.7% of KCS and 34.7% of MCS in males, and 15.3% of KCS and 29.6% of MCS in females (P < 0.001). Subjects with mobile phone usage exceeding 3 hours a day were 40.8% of KCS and 29.5% of MCS in males, and 58.0% of KCS and 40.1% of MCS in females (P < 0.001).
Go to :
DISCUSSION
The transitioning from adolescence to adulthood of college students can result in the development of unhealthy and poor diet and lifestyles due to various extra-curricular activities. Thus, it is imperative to recognize the importance of desirable dietary habits and lifestyles during this period. This study investigated the body image perceptions, nutrition knowledge, dietary attitudes, dietary habits, and health-related lifestyles of college students of Korea and Mongolia, both countries located in Northeast Asia, and all results were compared by gender and country.
Regarding body image perception for male subjects in Korea and female subjects in both countries, CBI was fatter than IBI and suggesting that they wanted to be thinner than their CBI. The differences between IBI and CBI in KCS by gender were significantly greater than in MCS. In male subjects, distribution of differences in CBI and IBI were considered due to the fact that overweight or more according to BMI was higher in KCS than in MCS. Although the distribution of overweight or more of female KCS was significantly lower compared to MCS, only 28.7% of KCS and 54.4% of MCS recognized their CBI as IBI, whereas 64.0% of KCS and 34.6% of MCS desired to be thinner. KCS perceived their CBI to be fatter than IBI, compared to MCS perception, and it is called the discrepancy of body image satisfaction. This study showed similar results as previous studies [2425] in which reported that Koreans preferred a skinny body image compared to other countries in Northeast Asia such as China and Japan. As for weight gain of Korean and Chinese college students during three years of college time, it was reported that Korean college students' weight gain (3.9 kg) were significantly lower compared to Chinese college students (7.0 kg) because of the importance of appearance and confidence in Korean college students [26]. The influence of mass media was an important factor in shaping attitudes toward appearance [27], and females were reported to be more affected than males [28]. The “Korean pop Idol” culture is predominant among Northeast Asian countries, but the appearance and slim figure of the “Girl Group” has been the coveted thin body for young people in Korea [29]. For these reasons, it is considered that discrepancy degree of body image satisfaction in female subjects was higher compared to male subjects and those of KCS in female subjects was higher compared to MCS.
The average total score of nutrition knowledge (17.0 and 8.4 points, respectively; P < 0.001) as well as experience of nutrition education (83.8% and 51.4%, respectively; P < 0.001) were significantly higher in KCS compared to MCS. This could be attributed to the fact that since 47.2% of KCS and 8.3% of MCS participated in nutrition classes at school by trained specialists such as nutrition teacher, their experience of nutrition education from professionals had inculcated a higher level of nutrition knowledge than MCS. Mongolian adolescents who had experience of health education (2008) were reported to be only 34.1% [30], and the Nutrition Education Center was opened and operated in Mongolian health center in 2011 by Koreans for chronic disease prevention and health-nutrition education of Mongolian [31]. Similar to this study, Shuchen et al. [32] reported that 58.1% of KCS had an accurate answer rate of nutrition knowledge than 44.5% of Chinese college students. In Korea, the Korea National Health and Nutrition Examination Survey are conducted every year, and national nutrition status is monitored and reported to the public. The School Meal Act was enacted in 1981, nutrition teachers have been assigned schools to focus on the healthcare of the teenagers since 2007 [33]. However, the STEPS Survey has not been conducted in Mongolia since 2013 [34], and the opportunity to impart nutrition knowledge about healthy dietary habits was lesser than Korea since school meals were not being provided. Since MCS received most of the nutrition information through mass media, dysfunction could occur if the information was not accurate and objective, since information obtained through mass media tends to be uncritically accepted or is believed to be accurate [35].
Overall, the average total score of dietary attitudes in KCS (27.0 points) was significantly lower compared to MCS (31.2 points, P <0.001). A previous study [32] also reported that Korean college students had significantly higher nutrition knowledge, but lower dietary attitudes compared to Chinese college students. In the case of surveyed and assessed the dietary attitudes using the Likert 5-scale, but this had a disadvantage of the frame of reference of responses of individuals [36]. The higher the level of nutrition knowledge, the higher is the motivation and desire to improve dietary habits [37]; therefore, evaluation criteria for dietary attitudes can be higher. In other words, MCS may evaluate dietary attitudes ineptly compared to KCS, who had high nutrition knowledge due to the nutrition education level and cultural differences.
Considering daily meal consumption, male and female subjects consumed 2 and 3 times meal, respectively, in KCS, and 3 and 2 times meal, respectively, in MCS, with a significant difference between the two countries by gender (P < 0.001). Also, skipping breakfast was more common among KCS than MCS. Son et al. [38] reported that Korean girls (17.5 points) had more nutrition knowledge than Chinese girls (16.3 points), but the rate of applying the nutrition knowledge to dietary habits in Korean girls (3.12 points) was lower than Chinese girls (3.74 points), shown similar results to results of this study. A previous study on the dietary habits of Korean and Japanese female college students [39] had reported that KCS had significantly lower frequency of breakfast and daily meals than Japanese college students. According to the previous report that residential type among college students may affect frequency of meals [40], so it may be considered that KCS who lived in dormitory and boarding house had a lower frequency of meals compared to MCS.
Assessing factors of eating out and meal purchasing revealed that subjects mostly preferred food of their own countries. The second most-preferred food for female subjects in MCS was Korean food, which was influenced by the knowledge of Korean food gained from Korean dramas broadcast in Mongolia [29]. Although meat is commonly eaten in Mongolia on daily basis, subjects reported that they enjoyed experimenting with unique tastes and eating various dishes and recipes of Korean food [41].
Frequency of alcohol drinking in KCS was significantly higher compared to MCS for both genders. A previous study [42] compared alcohol drinking behaviors among college students in Korea, China, the Philippines, and Vietnam; 36.5% of male Korean students and 15.4% of female Korean students had the highest alcohol drinking rate (more than 10 cups). College students had a significantly higher rate of drinking when they resided in dormitories (odds ratio: male 2.09, female 1.99) or boarding houses (odds ratio: male 2.25, female 2.37) than when they lived with parents. In Korea, since there are numerous 24 hours convenience stores and bars are operated until late, it is very easy to purchases alcohol than in Mongolia [43]. Also, since KCS had a higher rate of living in dormitories and boarding houses, this sociocultural difference was one of the reasons for higher alcohol consumption in Koreans than in Mongolians. Contrarily, smoking in KCS was significantly lower compared to MCS. Regarding results of two studies, it was found that in 2015, 39.3% of male and 5.5% of female adults smoked in Korea, and in 2013, 49.1% of male and 5.3% of female adults were smokers in Mongolia [4445]. The mortality rate of cardiovascular disease due to smoking was 104 deaths per 100,000 population in Korea, and 500 deaths per 100,000 population in Mongolia [46]. Therefore, it is essential that college students are periodically provided education on healthy lifestyles such as no alcohol drinking and no smoking.
The rate of female subjects who exercise more than 3 times a week in KCS (36.7%) was significantly higher compared to MCS (24.7%). Kim and Sawano (2010) reported that the rate of exercising more than three times a week in Korean female college students (35.7%) was higher compared to Japanese female college students (8.2%), and more than 50% of Korean female college students said they did exercise for weight control [47]. It was considered that female KCS had a better habit of exercising than other countries in Northeast Asia for IBI.
Considering computer and mobile phone usage, the frequency of all these devices in KCS was significantly higher compared to MCS. Recently, 85% of the Korean population and 78% of the Mongolian population were reported to be using smartphones [4849]. It is therefore considered necessary to develop an application program that can impart knowledge on improved nutrition information and healthcare for college students in each country, since it is more likely for people to conduct a searching or social network using a smartphone.
In summary, KCS had greater discrepancy in degree of body image satisfaction than MCS. Total score of nutrition knowledge in KCS was significantly higher compared to MCS, but a total score of dietary attitudes in KCS was significantly lower compared to MCS. In MCS, nutrition knowledge had a significant positive correlation with dietary attitudes. KCS showed unhealthier dietary habits and lifestyles than MCS, such as higher frequency of skipping breakfast and alcohol drinking. The limitations of this study include disparity in understanding and answering the questionnaire due to socio, food and cultural differences based on their nationality, and difficulty in generalizing the results since this study was conducted targeting college students in restricted areas of Incheon, Korea, and Ulaanbaatar, Mongolia. Finally, limitations in general characteristics such as gender, residential type and monthly pocket money may be related to family composition and socioeconomic status, and differences in urbanization between Korean and Mongolia. Despite these limitations, this study was the first study to compare body image perception, nutrition knowledge, dietary attitudes, dietary habits, and health-related lifestyles between KCS and MCS, and we could identify the diversities between the two countries for the above considered factors.
Therefore, KCS need nutrition education interventions that motivate them to apply their acquired nutrition knowledge to their lives, to improve their healthy dietary habits with desirable dietary attitudes. MCS need systematic education by developing professional nutrition education programs to improve the level of nutrition knowledge. It is also necessary to develop diverse and effective education methods that will help college students to manage their nutrition and health, by exploiting the highly used forum of social media.
Go to :
 XML Download