

 PDF
PDF ePub
ePub Citation
 Print
Print


INTRODUCTION
Breast cancer is one of the world's most prevalent female cancers and is also a leading cause of cancer deaths in women [1]. Currently, breast cancer is mainly treated by surgery and radiation therapy, and adjuvant chemotherapy or hormone therapy is used in parallel. Although advances in recent therapies have increased survival rates for women with breast cancer, the incidence and mortality rates for breast cancer have also increased rapidly in both developed and developing countries [23]. Therefore, greater understanding of the basic mechanisms of breast cancer progression and new and effective therapies for breast cancer prevention and treatment are needed.
Recently, certain natural compounds have been extensively used for the purpose of chemoprevention through induction of cancer cell specific apoptosis and removal of the malignant tumor [456]. Reconsideration of natural medicines, particularly those that have been used for many years in traditional medicines, has attracted a great deal of attention in research for new anti-cancer drugs [78]. Peels of Citrus unshiu Markovich, which belongs to the Rutaceae family, have long been used as traditional medicines for various therapeutic purposes. Recent studies have reported that their extracts and components have anti-inflammatory, antioxidant, anti-allergic, anti-diabetic and antiviral effects [9101112]. In a study of anti-cancer activity using a tumor-bearing mouse model, C. unshiu peel extract was shown to inhibit tumor growth associated with increased production of cytokines, such as interferon-γ and tumor necrosis factor-α [13]. In another recent study, C. unshiu peel has been reported to reduce systemic inflammation in tumor-bearing rats and prevent pro-inflammatory and pro-cachectic factors production in tumors, which was connected with the prevention of skeletal muscle atrophy and weight loss [14]. It was also reported that flavonoids or polysaccharides found in C. unshiu peel suppressed the metastasis of cancer cells [1516]; however, the mechanism and relevant mechanism of the anticancer effects associated with apoptosis of C. unshiu are still unknown. In this study, as part of our research to search for anti-cancer active ingredients from traditional medicinal resources, the effect of a water-soluble extract of C. unshiu peel (WECU) on MDA-MB-231 human breast cancer cells was investigated.
MATERIALS AND METHODS
Preparation of WECU
Dried peels of C. unshiu were obtained from Dongeui Korean Medical Center (Busan, Republic of Korea) and pulverized into a fine powder. The powders were boiled with distilled water for 3 h. The extract was filtered with a 0.45 mM filter to remove insoluble materials, and the filtrate was lyophilized with a vacuum rotary evaporator (BUCHI, Switzerland); the residue was freeze-dried in a freezing-dryer, and then stored at −80℃. The extracts (WECU) were dissolved in dimethyl sulfoxide (DMSO, Sigma-Aldrich Chemical Co., St. Louis, MO, USA) to a final concentration of 500 mg/mL (extract stock solution), which was stored at 4℃. The stock solution was diluted with the medium to the desired concentrations, prior to use.
Cell culture
MDA-MB-231 human breast carcinoma cells were obtained from the American Type Culture Collection (Manassas, VA, USA). The cells were maintained in an RPMI 1640 medium (WelGENE Inc., Daegu, Republic of Korea) supplemented with 10% fetal bovine serum (FBS), 2 mM L-glutamine, 100 U/mL penicillin, and 100 mg/mL streptomycin at 37℃ in a humidified atmosphere with 5% CO2.
Cell viability assay
To assess the effect of WECU on cell growth, the cells were seeded in 6-well plates at a density of 2 × 10⁴ cells per well. After incubation for 24 h, the cells were treated with various concentrations of WECU for 72 h. At the end of this time, a 3-(4,5-dimethylthiazol-2-yl)-2,5-diphenyltetrazolium bromide (MTT, Sigma-Aldrich Chemical Co.) solution was added to each well, at a concentration of 0.5 mg/mL, and the cells were additionally incubated at 37℃ for 3 h. The MTT solution was carefully removed, and, after solubilization of formazan crystal by DMSO, the optical density (OD) of the converted dye was measured at 540 nm using an enzyme-linked immunosorbent assay (ELISA) microplate reader (Dynatech Laboratories, Chantilly, VA, USA). The OD of the formazan formed in the control (untreated) cells was used to represent 100% viability. The experiment was performed in triplicate, and the results are indicative of three independent studies. To evaluate morphological changes after WECU treatment, photographs of the cells were taken using an inverted light microscope (Carl Zeiss, Oberkochen, Germany).
Detection of apoptosis via DAPI staining
After treatment with WECU, the cells were harvested, washed with a phosphate-buffered saline (PBS), twice, and fixed with 3.7% paraformaldehyde (Sigma-Aldrich Chemical Co.) in PBS for 10 min at 25℃. The cells were washed with PBS, stained with 1.0 mg/mL of 4′,6-diamidino-2-phenylindole (DAPI, Sigma-Aldrich Chemical Co.) solution for 10 min and then washed twice with PBS. The morphology changes in the nucleus were examined using a fluorescence microscope (Carl Zeiss).
Assessment of apoptosis by flow cytometry
To determine the magnitude of the apoptosis by WECU, an Annexin V-fluorescein isothiocyanate (FITC) apoptosis detection kit (BD Pharmingen, San Diego, CA, USA) was used. In brief, the cells were harvested, washed with PBS and binding buffer, and then stained with FITC-conjugated annexin V and propidium Iodide (PI) for 20 min in the dark. The mixture was then analyzed using a flow cytometer (Becton Dickinson, San Jose, CA, USA) according to the manufacturer's protocol. At least 10,000 stained cells were analyzed from each sample. The annexin−/PI− cell population was considered as normal, while the annexin V-FITC+/PI− and annexin+/PI+ cell populations were considered as indicators of early and late apoptotic cells, respectively [17].
Western blot analysis
Following the WECU treatment, the cells were collected and lysed, and the protein concentrations were quantified using a Bio-Rad protein assay (Bio-Rad Lab., Hercules, CA, USA), as described in a previous study [18]. In a parallel experiment, the mitochondrial and cytosolic fractions were isolated using a mitochondria isolation kit (Active Motif, Carlsbad, CA, USA) according to the manufacturer's instructions. For Western blotting, equal amounts of cell lysates were electrophoresed on sodium-dodecyl sulfate (SDS)-polyacrylamide gels and electrophoretically transferred onto polyvinylidene fluoride (PVDF) membranes (Schleicher & Schuell, Keene, NH, USA). After blocking with 5% bovine serum albumin (BSA) in the mixture of Tris-Buffered Saline and Tween-20 (TBST) for 1 h, the membranes were probed with specific primary antibodies at 4℃ overnight, followed by incubation with the appropriate horseradish peroxidase (HRP)-conjugated secondary antibodies for 1 h at room temperature. The protein bands were visualized using an enhanced chemiluminescence (ECL) assay kit (Amersham Biosciences, Westborough, MA, USA) as per the manufacturer's instructions. Primary antibodies were purchased from Santa Cruz Biotechnology, Inc. (Santa Cruz, CA, USA) and Cell Signaling Technology, Inc. (Danvers, MA, USA). HRP-conjugated secondary antibodies and the enhanced chemiluminescence (ECL) kit were obtained from Amersham Biosciences (Westborough, MA, USA).
Assay for caspases activity
The activities of the caspases (caspase-3, -8 and -9) were determined using colorimetric assay kits (R&D Systems, Minneapolis, MN, USA), following the manufacturer's protocol. Briefly, the cells were lysed in the supplied lysis buffer, and equal amounts of proteins were incubated with the supplied reaction buffer, containing dithiothreitol and tetrapeptides as substrates for each caspase, at 37℃ for 2 h in the dark. The reactions were measured by changes in absorbance at 405 nm using an ELISA reader.
Measurement of mitochondrial membrane potential (MMP, Δψm)
The MMP changes were determined by measuring the retention of a dual-emission potential-sensitive probe, 5,5′,6,6′-tetrachloro-1,1′,3,3′-tetraethyl-imidacarbocyanine iodide (JC-1, Sigma-Aldrich Chemical Co.). In brief, the WECU-treated cells were washed with PBS and incubated with 10 µM JC-1 for 20 min at 37℃ in the dark. The cells were then collected by centrifugation and washed twice with PBS to remove unbound dye. The MMP values were measured at 488 nm and 575 nm using a flow cytometer by following the manufacturer's protocol.
Detection of reactive oxygen species (ROS) accumulation
In order to detect the production of intracellular ROS, 2′,7′-dichlorofluorescin diacetate (DCF-DA, Molecular Probes, Leiden, Netherlands) was used as described elsewhere [19]. Cells were treated with WECU for a certain period of time and then the cells were harvested, washed and re-suspended in 10 µM DCF-DA solution. The cells were then incubated at 37℃ for 20 min in a dark room before being analyzed by a flow cytometer. The values were expressed as a percentage of fluorescence intensity relative to the blank control cells. The stained cells were also mounted on the chamber slide with a mounting medium. The images were obtained on a fluorescence microscope. To confirm whether intracellular ROS levels play any role in the WECU-induced cytotoxicity, cells were pretreated with N-acetyl-L-cysteine (NAC, Sigma-Aldrich Chemical Co.), a well-established antioxidant, for 1 h prior to treatment with WECU.
RESULTS
WECU inhibits cell viability and induces apoptosis in MDA-MB-231 cells
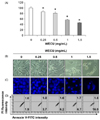
The effect of WECU on the cell viability of MDA-MB-231 cells was determined by the MTT assay. As shown in Fig. 1A, the cell viability was reduced by WECU in a concentration-dependent manner, with the various morphological changes including membrane blebbing, diminished cell density, and an increased number of floating cells (Fig. 1B). To investigate whether the reduction of cell viability by WECU could be linked to apoptosis, nuclear morphological changes and flow cytometry analysis were performed. As expected, WECU-treated cells showed remarkable changes, such as nuclear fragmentation and chromatin condensation (Fig. 1C). In addition, when cells were treated with WECU, the apoptotic rate was significantly increased in comparison to that of the untreated control cells (Fig. 1D), indicating that WECU suppressed cell viability by inducing apoptosis in MDA-MB-231 cells.
WECU enhances activation of caspases and degradation of PARP in MDA-MB-231 cells
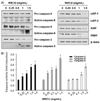
To explore whether WECU induces apoptosis by activation of caspases, the effects of WECU on the expression and activity of caspases were investigated. The immunoblotting results showed that expression of pro-caspase-8 and -9, representative initiator caspases of the extrinsic and intrinsic apoptosis pathways, respectively, was apparently decreased with increasing WECU concentrations, while their active forms were increased (Fig. 2A). WECU treatment also caused the activation of caspase-3 in a concentration-dependent manner, and the typical 89 kDa cleaved fragment of poly(ADP-ribose) polymerase (PARP), occurred in WECU-exposed MDA-MB-231 cells. In this process, the expression of inhibitors of apoptosis (IAP) family proteins, such as cIAP-1, cIAP-2 and XIAP, was suppressed by WECU treatment. Consistent with the Western blot analysis results, the in vitro activity of these caspases was significantly enhanced by WECU treatment (Fig. 2B), indicating that both apoptosis pathways might be activated during induction of apoptosis by WECU.
WECU modulates the expression of BCL-2 family proteins in MDA-MB-231 cells
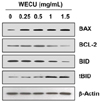
As shown in Fig. 3, the expression of pro-apoptotic BAX was increased by WECU treatment, whereas the expression of anti-apoptotic BCL-2 was decreased in WECU-stimulated MDA-MB-231 cells. In addition, the expression of truncated BID (tBID) was increased with the decrease of the expression of total BID, a pro-apoptotic BCL-2 family protein, by WECU treatment.
WECU-induced apoptosis is associated with mitochondrial dysfunction in MDA-MB-231 cells
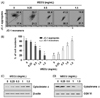
The change of MMP values according to WECU treatment was next investigated and the resulting data indicate that WECU significantly destroys the integrity of mitochondria measured by concentration-dependent loss of MMP (Fig. 4A and B). Moreover, the release of cytochrome c from the mitochondria to the cytoplasm increased clearly when treated with increasing concentrations of WECU (Fig. 4C). These results indicated that the loss of mitochondrial function plays an important role in the induction of apoptosis by WECU in MDA-MB-231 cells.
Induction of apoptosis by WECU is ROS-dependent in MDA-MB-231 cells
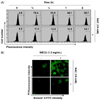
We further investigated whether induction of apoptosis by WECU is a ROS-dependent signal transduction pathway. As can be seen from the flow cytometry results, shown in Fig. 5A, in WECU treated cells, the production of ROS peaked within 30 min of WECU treatment, then gradually decreased over the treatment time. However, the WECU-induced increase of ROS content was greatly reduced by the addition of NAC, a ROS scavenger, and this phenomenon was confirmed additionally by fluorescence microscopic observation (Fig. 5B). Furthermore, when ROS production was artificially blocked, apoptosis induction and survival rate reduction by WECU were significantly attenuated (Fig. 6), indicating that induction of apoptosis by WECU was ROS dependent in MDA-MB-231 cells.
DISCUSSION
In this study, the mechanism of apoptosis induction by WECU, a water-soluble extract of C. unshiu peel, in MDA-MB-231 human breast cancer cells was investigated. The present results indicated that activation of the extrinsic and intrinsic apoptotic pathways may be involved in the induction of MDA-MB-231 cell apoptosis by WECU, which was ROS generation dependent.
Apoptosis, a programmed cell death, is a major death mechanism of the cytotoxic action of anti-cancer agents that removes target cells, such as malignant and/or cancer cells, without damaging normal cells or surrounding tissues. Apoptosis is generally divided into death receptor (DR)-initiated extrinsic and mitochondria-mediated intrinsic pathways [2021]. The extrinsic pathway begins with the binding of the cell surface DRs of the death ligands for the activation of caspase-8 after mobilization of the adapter molecule leading to the activity of the downstream effector caspases such as caspase-7 and -3 [2223]. Activation of effector caspases degrades various substrate proteins, including PARP, required for cell survival at the final stage of cell death, thus completing cell death [22]. Therefore, the increase in caspase-8 activity in MDA-MB-231 cells treated with WECU, as in the results of this study, implied that the extrinsic pathway was involved in the induction of apoptosis. The intrinsic pathway is initiated by the loss of internal mitochondrial membrane integrity and the activation of caspase-9 through the release of pro-apoptotic factors, such as cytochrome c, from the mitochondria into the cytoplasm. In addition, mitochondrial dysfunction is closely related to altered expression of BCL-2 family members and is mediated by a common pathway in which the activity of effector caspases is increased by activated caspase-9 [2023]. In the present study, caspase-9 was activated in WECU-treated cells, and the loss of MMP and the migration of cytochrome c into the cytoplasm were increased, which correlated with decreased expression of BCL-2 and increased expression of BAX. The results also showed that the expression of tBID in WECU-treated cells was increased. Previous studies have shown that activation of caspase-8 by anti-cancer agents can convert BID to tBID [2123]. tBID, together with BAX, oligomerizes in the outer membrane of mitochondria to destroy their integrity, causing the promotion of MMP loss and release of apoptogenic factors [2023]. These results demonstrated that the induction of WECU-mediated apoptosis in MDA-MB-231 cells was simultaneously mediated by the intrinsic pathway and the exogenous pathway, and that the extrinsic pathway eventually amplified the intrinsic pathway through caspase-8-mediated truncation of BID.
ROS, cellular metabolites that regulate the various signaling transduction pathways of the cell, are an important regulator of cell fate [2425]. Mitochondria are regarded as an important target of ROS damage, and an increase in ROS levels can lead to apoptosis by oxidizing mitochondrial pores [2627]. Therefore, the production of ROS in MDA-MB-231 cells by WECU treatment using DCF-DA was measured, and the results confirmed that the production of ROS was greatly increased by WECU treatment. However, when the production of ROS was blocked by NAC, the apoptosis by WECU was markedly inhibited, and the inhibited cell survival rate was also significantly recovered. Although further studies on the mechanism of ROS production inhibition and mitochondrial transport system disturbance are needed, these results suggest that mitochondrial damage by ROS-dependent WECU in MDA-MB-231 cells was a major cause of apoptosis.
In summary, the present results demonstrated that WECU induced apoptosis in MDA-MB-231 cells through activation of both intrinsic and extrinsic pathways by enhancing MMP loss and the cytosolic release of cytochrome c with increasing BAX/BCL-2 ratio. WECU also promoted ROS generation; however, when ROS production was blocked, WECU-induced apoptosis and reduction of cell viability were diminished, indicating ROS was a potential upstream molecule of the cytotoxic effect induced by WECU in MDA-MB-231 cells. Although the results of this study can provide a new perspective on the molecular mechanisms of the effects of C. unshiu peel extract on the growth of MDA-MB-231 breast cancer cells, the efficacy on other cancer cell lines and detection of bioactive active compounds of WECU should be additionally researched.

 XML Download