

 PDF
PDF ePub
ePub Citation
 Print
Print


INTRODUCTION
South Koreans' dietary habits and nutrition level have improved along with the country's economic and industrial development. Recently, women's expanding economic activities and increasing number of double-income households have changed food consumption patterns, such as increasing opportunities of dining out [12]. Such changes partly influence on the food consumption patterns of children and adolescents. In addition, along with children's increasing allowance and private educational activities, they are more likely to be exposed to food advertisements through mass media, resulting in an increase in their independent food selection and consumption activities out of their guardians' control [3]. Their snack consumption has been increasing in recent years. If taken properly, snacks can play a positive role by supplementing nutrients that are not met by daily meals [4], but they can also lead to negative consequences, depending on their types and amount [5].
According to the Special Act on Safety Control of Children's Dietary Life (Ministry of Government Legislation, Republic of Korea), the term of ‘children’ means individuals aged 18 or younger, including students of elementary, middle, and high schools, and the term of ‘children's favorite foods’ (or ‘children's preferred foods’) is defined as foods that children prefer or eat frequently among foods under the Food Sanitation Act or the Livestock Products Sanitary Control Act. In addition, specific items of children's favorite foods, including bakery, confectionery, ice cream, soft drink, hamburger, pizza, and fried foods, have been declared.
Data from the 2011 Korea National Health and Nutrition Examination Survey (KNHANES) indicated that children between 12-18 years of age more frequently eat children's favorite foods compared to other age groups [6]. The majority of children's favorite foods contains high fat, sugar, and calories, which can lead to various health problems, such as obesity, childhood diabetes, and tooth decay. Furthermore, other problems may be raised over food safety, as these children are tempted to buy their snacks at small food establishments such as stationery stores, small supermarkets, and unauthorized businesses on their way from school [7].
Previous studies have reported factors related to taking some children's favorite foods, in particular instant foods, soft drinks, and fast foods [89]. For instance, the factors related to soft drink consumption were shown to be associated not only with snack costs but also with the time spent on TV or computer screens [9]. However, because these studies have focused on limited food items, more comprehensive studies including the full list of children's favorite food items as stated in the Special Act on Safety Control of Children's Dietary Life are warranted. Furthermore, there are few studies to analyze eating patterns of children's favorite foods. One study analyzed the correlation between the dietary pattern of eating a large quantity of favorite foods and increases in body mass index (BMI) and body fat content among Colombian children [10], and subsequently obtained significant findings. However, this study focused on the dietary pattern of eating a large quantity of favorite foods instead of identifying the eating patterns of children's favorite foods.
The present study conducted a nationwide cross-sectional survey for Korean students in elementary, middle, and high schools to examine demographic, economic, and environmental factors as exposures and identify eating patterns of children's favorite foods, including those stated in the Special Act on Safety Control of Children's Dietary Life, as outcomes. Finally, this study attempted to evaluate the association between the exposures and the outcomes to find out significant factors related to unhealthy or healthy eating patterns of children's favorite foods.
SUBJECTS AND METHODS
Study population
For this study, a nationwide cross-sectional survey was conducted in elementary, middle, and high schools located in Seoul, Daejeon, Daegu, Gyeonggi, Chungnam, Jeonbuk, and Gyeongnam. To select regions and schools, the second-stage stratified probability cluster sampling method was used. Thus, 171 schools consisting of 57 schools in each school level were selected. The target populations were fourth-grade elementary students, first-grade middle school students, and first-grade high school students. When requesting participation in the survey from February 16th to November 30th, 2016, approximately 74.9% of eligible students in 128 schools responded. Among 6,229 participants, 5,458 students (87.6%) completed the student survey questionnaire. In addition, 1,539 guardians of the participating elementary students completed the guardian survey questionnaire. All participants signed an informed consent form approved by the Human Subjects Review Committee of Sungshin Women's University (No. SSWUIRB 2016-031).
Survey questionnaires
Children's favorite food items stated in the Special Act on Safety Control of Children's Dietary Life and others highly consumed in children were catalogued. Potential factors related to their intake were selected through literature review and analysis on national statistical data, including the KNHANES data. The draft of the questionnaires was reviewed by an expert council consisting of nutritionists, clinicians, nutrition instructors, general health instructors, advertising publicists, food policy experts, etc. The expert council's opinions on each area of the questionnaires were collected, and the final copy of the questionnaires was prepared through accommodating their revisionary comments on the structure and content of the questionnaires.
Finally, the student survey questionnaire included 11 questions about general matters (including age, sex, allowance, and school name) and physical development (self-reported height and body weight), 34 questions on the respondents' eating status and preference of children's favorite foods, and 6 questions on how they acquire information about children's favorite foods, 6 questions on nutrition education programs, and 26 questions about their awareness of national policies related to children's favorite foods and the usefulness and necessity of these policies. The questions about the consumption status of children's favorite foods included a list of 31 food items or food groups: sweet snacks (e.g. cookies and biscuits), salty snacks (e.g. potato chips), cereals, chocolate, candies and jellies, bread, white milk, processed milk (banana, chocolate, or strawberry-flavored milk, etc.), fermented milk, ice creams, soybean milk, soft drinks, high caffeinated beverages, vegetable juice, fruit juice, fruit-flavored beverages, other beverages (ionic drinks and vitamin drinks, etc.), fruits, fish cakes and sausages, rice cakes, nuts, friend chicken, other fried foods, ramen, skewers, dumplings, tteokbokki, kimbap, sandwiches, hamburgers, pizza. The questionnaire was organized in a way for respondents to answer their frequency of each list of favorite foods in a scale of six (almost none, 1 to 3 times per month, 1 to 3 times per week, 4 to 6 times per week, 1 time per day, 2 times per day).
The guardian survey questionnaire included 4 questions about general matters, 10 questions about their awareness of the policies on children's favorite foods, 20 questions about the usefulness of the policies, 7 questions about the necessity of the policies, 6 questions about buying favorite foods, and 14 questions about food safety in school and its vicinity.
Statistical analysis
The differences in the general matters and children's favorite food-related factors among the elementary, middle, high school groups were analyzed using the Chi-square test and analysis of variance test. The monthly average intake frequency was calculated for each list of favorite foods, and this value was used for the factor analysis to identify their patterns of favorite food consumption. Eigenvalue computation and scree test were used to determine the number of their eating patterns, and the varimax rotation method was used to smoothly interpret the results of the factor loading matrix. The factor scores were calculated for each eating pattern, and the study participants were divided into quintiles according to these values. The binary variables were made with a cutoff point of either the lower 40% or upper 40% of the quintile based on the comparison analysis of characteristics and then their positive value (vs. zero) was defined as the ‘tendency of a specific eating pattern’ to be used in the logistic regression analysis. The final regression model was prepared, containing only the statistically significant variables, through the selective regression analysis method. In this model, the odds ratio (OR) and 95% confidence interval (CI) were calculated. The SAS program (SAS 9.1.3, 2008, SAS Institute, Cary, NC, USA) was used for statistical analysis, and the statistical significance level was at 0.05 of the two-tail test.
RESULTS
Comparison of characteristics in the study participants
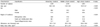
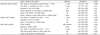
The total 5,458 study participants consisted of 1,539 elementary students, 2,104 middle school students, and 1,815 high school students. Table 1 shows the results of the comparative analysis on the general matters and BMI among the elementary, middle school, and high school students. When compared by sex, the proportion of female students was higher among elementary students, while the proportion of males was higher among middle and high school students, showing a significant difference in sex proportion among elementary, middle, and high school students. The distribution of students in small- and medium-sized cities was higher than those in metropolitan cities, towns, villages, and remote areas. The amount of monthly allowance and BMI increased with age.
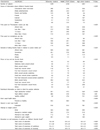
Table 2 demonstrates the results of the comparative analysis on the factors related to children's favorite food intake among the elementary, middle school, and high school students. The majority of the elementary students indicated that they acquired information about favorite foods from convenient stores, marts, media advertisement (TV, radio, newspaper, magazines), parents and families. On the other hand, the middle and high school students obtained more information via smartphone than from parents and families. The majority of the elementary or high school students watched TV and used a computer less than one hour or 1-2 hours, while the middle school students mainly spent 1-2 hours or more than two hours in these activities. Most middle and high school students spent 1-2 hours or more than two hours in smartphone a day, while the majority of elementary students spent below one hour or no time at all on the same. On the question about eating favorite foods related to the use of screen media including TV or computer screens and a smartphone, most of the respondents answered “almost none” or “sometimes”, regardless of their school level. However, more high school students answered “yes” than the respondents in other school levels. Most respondents bought snacks from marts around their house. On the question on whether they select foods after checking the nutrition label, the high school students were found to be more likely to check for high calories/low nutrient, high caffeine content, and quality certifications than the elementary and middle school students. Most students considered themselves healthy, but the level of health awareness and interests were appeared to be the lowest among high school students. It was found that one in two attempted to control weight. The middle school students showed the highest total score in education and awareness on the question about education on and level of awareness of policies related to favorite foods. The elementary and middle school students showed higher scores on awareness of the utility and necessity of these policies.
Eating patterns of children's favorite foods
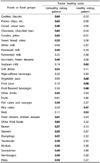
Table 3 shows the results of the factor analysis identifying the eating patterns of children's favorite foods consumed during the past month by all participants. Among the eating patterns derived from the analysis, the pattern of frequently taking high calorie foods with low nutritional value, such as snacks, chocolate, candies, bread, processed milk, soft drinks, as well as substitutes for meals such as fried foods, ramen, flour-based foods, hamburgers, pizza, was labelled as the ‘unhealthy eating pattern’. On the other hand, the pattern of mainly taking soybean milk, vegetables, fruit juice, fruit-flavored drink, rice cakes, and nuts was named as the ‘healthy eating pattern’. These two patterns emerged similarly from the elementary, middle school, and high school students (data available upon request).
Factors related to the eating patterns
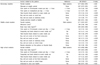
Table 4 shows the result of extracting statistically significant variables through the selective regression analysis method after defining the ‘unhealthy eating risk’ as the upper two quintiles of factor scores for the ‘unhealthy eating pattern’. The related factors with the equally significant relevance among the elementary, middle and high school students were sex and favorite food intake by screen media use. The OR of the ‘unhealthy eating risk’ of the elementary students increased as they did not keep themselves from controlling their weight, used screen media more than one hour, bought snacks from stationery stores and snack bars around their homes, schools, private academies, etc. and considered their own health status as not good. The OR of the ‘unhealthy eating risk’ of the middle school students increased as they received more allowance, had lower BMI, watched TV or used a computer more than one hour, frequently ate foods related to screen media use, and bought snacks from marts, stationery stores, fast food restaurants, and school shops, etc. Moreover, the students who had been educated on the policies on favorite foods showed a higher OR than those who did not receive such education, which implied an adverse effect of education. The OR of the ‘unhealthy eating risk’ of the high school students increased as they had lower BMI, watched TV or used a computer more than one hour, frequently ate foods related to screen media use, bought snacks from school shops and fast food restaurants around their schools, private academies, and houses, and had less interest in their own health.
Table 5 shows the results of extracting statistically significant variables through the selective regression analysis method, after defining the ‘healthy eating hindrance risk’ as the bottom two quintiles of factor scores of the ‘healthy eating pattern’. The factors with equally significant relevance among the elementary, middle, and high school students were daily smartphone use more than one hour and ignorance (inability to recognize) on the policies on favorite foods. The OR of the ‘healthy eating hindrance risk’ of the elementary students increased as they watched TV or used a computer more than one hour a day, had less interest in their own health, and received less education on the policies on favorite foods. Particularly, the OR of the ‘healthy eating hindrance risk’ increased as the parents of the elementary students had less opinions on selecting products labelled as ‘high calorie, low nutrient’, ‘high caffeine content’ and ‘quality certified’. For the middle school students, the OR of the ‘healthy eating hindrance risk’ also increased as they had less interest in their health. For high school students, the OR increased as they were females, less committed in weight control, and did not take favorite foods related to screen media use.
DISCUSSION
This study extracted the eating patterns of children's favorite foods in elementary, middle, and high school students and analyzed the factors related to the patterns. As a result, two eating patterns emerged: the ‘unhealthy eating pattern’, which indicates high consumption of favorite foods containing higher fat and sugar contents, and the ‘healthy eating pattern’, which indicates high consumption of favorite foods containing higher protein, vitamin and mineral contents, such as soybean milk, vegetables, fruit juice, and nuts. The factors related to these eating patterns were found to be sex, allowances, BMI, weight control efforts, long-time screen media use, interest in health, education on and awareness of favorite food-related policies, and the place of favorite food purchase.
Growth and development continue throughout the school ages and adolescence, which requires balanced nutrition to build good personal eating habits that continue throughout adulthood. Balanced nutrition during this period is not only crucial for physical and mental developments but also serves as a basis for healthy lifestyle throughout the whole lifetime. In contrast, indiscreet snack consumption can interfere with later meals and cause nutritional imbalance. Therefore, the selection and timely consumption of healthy and well-balanced snacks are important for growing children and youths.
The Special Act on Safety Control of children's Dietary Life was legislated in 2008 with the purpose of contributing to promoting children's health by prescribing matters necessary for supplying safe and nutritionally balanced foods in order to help children acquire proper dietary habits. Previous studies examined the consumption of some snack items and analyzed its related factors in children and youths in Korea [1112131415]. No study did evaluate eating patterns of children's favorite food items stated in the Special Act on Safety Control of children's Dietary Life. The method to evaluate dietary patterns, rather than individual food items, has been used to provide more valuable information of dietary habits.
The present study aimed to derive eating patterns of children's favorite foods and evaluated their related factors, which may be potential causes. Thus, the study results showed an inverse association between BMI and the tendency of the ‘unhealthy eating pattern’, which is consistent with the findings of Doo et al. [11], who reported the higher frequency of eating snacks, such as biscuits and chocolate, among less-weight middle school students than those of normal-weight and overweight students. Children who prefer consuming snacks or other unhealthy food items are less likely to consume adequate meals and thus consume insufficient amount of nutrients that are required for growth and development. Furthermore, the findings of this study showed a strong association between the time spent on TV or computer screens and the tendency of the ‘unhealthy eating pattern,’ regardless of the school level, which is consistent with the findings of previous studies which reported that the more time is spent on watching TV, the more the number of snack (confectionery, ice creams, ramen, candies, etc.) times increased [1213]. With regards to the findings of previous studies that reported that 60% children bought snacks after watching food advertisements on TV [16], mass media including the Internet as the main sources of information about high-calorie foods with low nutritional values [14]. This study also showed that one in two middle and high school students were obtaining information about favorite foods from advertisements on media, the Internet, and a smartphone. Since these media were considered as the explanatory results on the relation between favorite food advertisements and purchase behavior [13], such findings suggest the importance of regulations in TV food advertisements, as one of related policies on children's favorite foods.
As mentioned earlier, previous studies analyzed the factors related to single items among major snacks or some of high-calorie or low-nutritious foods [1112131415]. The present study distinguished itself from those studies by identifying the eating patterns of these items through factor analysis. Such analytic methods not only identified how children chose their snacks but also showed the factors related to the overall snack eating pattern, not to each single snack item. A study that identified the patterns of eating behavior of Korean youths has been published before [15]. Kim et al. [15] identified three patterns of eating behavior, such as the healthy pattern, the mixed pattern, and the unhealthy pattern, using a questionnaire containing 18 questions. They reported that the factors related to these patterns were snack consumption, dietary environment, and lifestyle. Particularly, with regards to the snack eating status, the healthy pattern was shown to be associated with drinking white milk, while the unhealthy pattern was related to the frequency of eating candies and soft drinks. Our study investigated the intake frequencies of 31 food items, and identified the pattern of mainly eating high-calorie and low-nutritious foods, and another pattern of eating foods with high nutrient density, such as soybean milk, vegetables, fruit juice, nuts, etc. among the young study subjects.
The present study also examined education on and awareness of policies on children's favorite foods. To the best of our knowledge, such a factor had not been investigated in previous studies. The average score of the survey on experiences in nutrition education or awareness of related policies was low below the median score. However, the average score of the usefulness and necessity of related policies was as high as over 70 percentile of the total score. In addition, the intake frequency of healthy foods was significantly high and that of favorite foods was significantly low in the group with high scores of awareness, usefulness, and necessity of policies on children's favorite foods. Cho et al. [4] suggested that the snack eating attitude and nutrition knowledge are positively associated, by showing significantly higher scores in snack-related nutrition knowledge among children who habitually considered nutritional components and expiry dates when choosing their snacks. This study also investigated elementary students' parental awareness of the policies on favorite foods, and discovered that the children of parents with high awareness were positively associated with the pattern of consuming healthy favorite foods, indicating that the important role of parents, as reported by an earlier study [17]. These results imply the necessity of expanding health and nutrition education to parents as well as among students. Based on the results on the relevance between time spent on media screens and the pattern of eating favorite foods, it will be beneficial to conduct nutrition education and promotion of favorite food-related policies on screens.
The strengths of this study include the selection of study participants from the nationwide sample, a large sample size, the selection of elementary, middle and high schools, the survey about the policies on children's favorite foods, and the identification of eating patterns of favorite foods. The limitation of this study is its inability to analyze the influence of stores selling healthy children's favorite foods near schools, partly due to the small number of such stores.
In a cross-sectional study including elementary, middle and high school students, we derived two contrasting eating patterns, the ‘unhealthy eating pattern’ and the ‘healthy eating pattern’, from the data of children's favorite food intake, and analyzed the personal, behavioral and environmental factors related to these patterns. As a result, we found some significant factors including allowance, time spent on TV or computer screens and a smartphone, the presence of the place of favorite food sales near school, private academies, and homes, and awareness of and interests in the policies on favorite foods and health. On the basis of findings, we suppose that multifaceted factors affect children's intake of favorite foods. In particular, based on the higher relevance of the awareness of favorite food-related policies than that of education, we suggest the need for the systematization, diversification, and intensification of the methods of in-school nutrition education for students to enhance their awareness.
 XML Download