

 PDF
PDF ePub
ePub Citation
 Print
Print


INTRODUCTION
The second sustainable development goal aims at ending hunger and improving food security among all populations of the world [1]. Food insecurity challenges food choice and selection by constraining the ability and capacity for one to access or avail oneself with nutritious foods in adequate amounts [2]. Food insecurity, more commonly thought of as a problem of developing nations, still persists in some economically advanced parts of the world. In Canada, from 2007 to 2012 about 4.9% of children and 8.2% of adults were reported to live in food insecure households [3]. In the US, 12.7% of the population was food insecure in 2015 [4].
Food insecurity in Korea was previously measured using a single item questionnaire or an abridged questionnaire. Using these tools, food insecurity in Korea was reported to be below 10% for more recent years [567]. However, this approach has been criticized noting that it only detects food insecurity resulting from poverty and thus deemed invalid. Therefore, Korea National Health and Nutrition Examination Survey (KNHANES) recently adopted a new 18-item questionnaire and incorporated it into its annual survey. Using this 18-item questionnaire, Kim and Oh [8] estimated the prevalence of food insecurity in Korea at 11.3% for the year 2012.
Households with children have a higher prevalence of food insecurity than those without children. Canada reported 10.3% of households with children as having experienced food insecurity in the period of 2007-2012 versus 7.5% of households without children [3]. About 16.6% of the US households with children were reported to be food insecure in 2015 while 10.9% of households without children were food insecure [4]. In Korea, 13.2% of households with children were food insecure compared to 10.3% of households without children in 2012 [8]. Although parents often shield their children as indicated by the lower rates of food insecurity among children, this shielding effect is less evident as the child's age increases and in cases of multiple children in the household. In fact, most negative effects of insecurity among children have been observed in children within the adolescent age bracket [9].
Adolescence is the stage linking childhood to adulthood. The physical and biological growth and development associated with this stage requires proper nourishment to accomplish while cognitive development complicates behavioral control and influences dietary habits [10]. Food insecurity further complicates the nutritional problems that are associated with this stage. Kim and Oh [8] showed insufficient nutrient intakes of protein, fat, calcium, phosphorous, and potassium among food insecure children aged 5-18 years in comparison to their food secure colleagues in 2012. The contribution of food insecurity towards inadequate nutrient intake is supported by studies from Canada [9] and those from Korea targeting older adults [1112].
Besides nutrient intake, food insecurity has been associated with food intake. Studies in other age groups have indicated concerns for a wide range of foods including fruits, vegetables, dairy, nuts, eggs, and meats [1112]. Among adolescents, fruits and vegetables have been shown to be of particular concern. Kirkpatrick and Tarasuk [9] reported lower fruit and vegetable intake among food insecure male adolescents aged 14-18 years in Canada. In contrast, an American study showed that food insecure adolescents were more likely to meet the stipulated guidelines for vegetable intake than their food secure age mates [13]. This study suggested that this observation may have been a result of strategies in place that support food insecure individuals.
Nutritional inadequacies associated with food insecurity thwart normal growth and development, and the poor dietary habits adopted during this stage are often carried over into adulthood [10]. Furthermore, the resultant compromised nutritional status increases risks to disorders such as obesity [141516]. In fact, certain studies outside Korea have successfully associated obesity and overweight with being food insecure.
In spite of the overwhelming evidence showing the nutritional vulnerability of food insecure adolescents, Korean studies have yet to provide comprehensive information detailing the nutritional characteristics associated with this population. Existing studies have preferentially targeted adults and elderly populations [81112]. However, it is only with such information that proper advocacy and intervention programs can be developed for alleviating their problems. Therefore, the current study established its goal to identify food insecure adolescents in Korea and assess their nutrient and food intakes, in comparison to food secure adolescents.
SUBJECTS AND METHODS
Data source and study subjects
The study obtained data from the 6th (2013-2015) Korea National Health and Nutrition Examination Survey (KNHANES). KNHANES was initiated in 1998 and aims to examine the health and nutritional status of the general Korean population excluding institutionalized individuals. This survey was reviewed by the Institutional Review Board of the Korea Centers for Disease Control and Prevention (2013-07CON-03-4C, 2013-12 EXP-03-5C) for the years 2013 and 2014. KNHANES has been exempted from review following the Bioethics and Safety Act since 2015.
The survey employs stratified and multi-stage clustered probability sampling. There were a total of 1,855 adolescents that participated in the survey for the target time period. Among these adolescents, 183 were excluded because of missing values for household food insecurity status, and then 188 were excluded because of non-positive weights for the variables of interest. Finally, 31 adolescents having reported energy intakes less than 500 kcal or greater than 5,000 kcal were excluded, leaving a final sample of 1,453 adolescents. In the final sample, there were 695 middle school-aged (12-14 years old) and 758 high school-aged (15-18 years old) adolescents.
Assessment of household food insecurity
The 6th KNHANES data set obtained information about household food insecurity using the 18-item questionnaire adopted from the US Household Food Security Survey Module [8]. Each question awards a score of one for affirmative responses including ‘yes’, ‘often’, ‘sometimes’, ‘almost every month’, and ‘sometimes but not every month’, but 0 for any other responses. Based on this module, a household with a final score of 2 or less was considered food secure while one with a score higher than 2 was considered food insecure. The study subjects were grouped into food secure and insecure adolescent groups according to the food security status of the households they belonged to.
General characteristics
In KNHANES, the health interview and examination part contains information about household characteristics and health-related individual characteristics. Data concerning age, sex, area of residence, reception of basic livelihood security, household income level, family size, householder's sex, householder's age, householder's education level, and householder's job status were extracted and analyzed.
Dietary and health-related characteristics
Diet-related habits including breakfast skipping, night eating, and frequency of eating out were also analyzed. Breakfast skipping was defined as not reporting any intake for breakfast meal in the 24-hour recall data. A night-eater was any adolescent who consumed more than 25% of his/her daily caloric intake at night from 21:00 to 06:00. In terms of eating out, individuals who ate out at least once daily were compared with others who ate out less frequently. These definitions have been used in previous studies which compared adolescents based on breakfast skipping [17], night eating [18], and eating out [19].
Adolescents were regarded as smokers if they reported having smoked before regardless of current smoking status. Similarly, for alcohol intake, grouping was based on whether or not one had drunk alcohol before. Weight status was evaluated based on the Korea National Growth Charts [20]. These charts group individuals in body mass index (BMI) percentiles according to age and sex. Following their criteria, individuals of BMI equal to the 5th percentile and above but below the 85th percentile were grouped as ‘normal’. On the other hand, individuals of BMI below the 5th percentile were grouped as ‘underweight’. Adolescents whose BMI was within the 85th percentile and over but below the 95th percentile were grouped as ‘overweight’. Lastly, adolescents with BMI equal to or above the 95th percentile were grouped as ‘obese’.
Nutrient intake assessment
Nutrient intake was evaluated in terms of nutrient density, insufficient intake, and excessive intake of selected nutrients. In addition, meeting the appropriate range for total energy intake and energy intakes from carbohydrate, sugar, protein, fat, and saturated fatty acids was evaluated.
Nutrient density, nutrient amount per 1,000 kcal, was calculated for vitamin A, thiamin, riboflavin, niacin, vitamin C, potassium, calcium, phosphorous, iron, and sodium. Prevalence of insufficient intake was calculated for protein, vitamin A, thiamin, riboflavin, niacin, vitamin C, calcium, phosphorous, and iron. Insufficient intake was deduced if the intake level of specific nutrient was less than the corresponding Estimated Adequate Requirement (EAR). Prevalence of excessive intake was calculated only for sodium by comparing the intake with the intake goal of 2,000 mg. In terms of energy intake, appropriate range was considered as 75-125% of Estimated Energy Requirement (EER). The acceptable macronutrient distribution ranges (AMDRs) were used to assess energy intake from carbohydrate (55-65%), sugar (10-20%), protein (7-20%), fat (15-30%), and saturated fatty acids (< 8%).
All reference values for nutrient intake, except vitamin A, were obtained from the 2015 Dietary Reference Intakes for Koreans (KDRIs) guideline [21]. The guideline changed the units for vitamin A intake from µg retinol equivalents (µg RE) to µg retinol activity equivalents (µg RAE) in its 2015 edition, yet KNHANES continues to use µg RE. For this reason, the 2010 KDRIs [22] was opted for use with vitamin A related analyses.
Sugar intake had to be separately calculated since KNHANES did not include sugar intake. The database for sugar intake used in the study was obtained and used with permission from the Korea Health Industry Development Institute. Details about how this database was made have been provided elsewhere [23].
Food intake assessment
Food intake was evaluated in terms of food group servings and dietary diversity score (DDS). For assessing food group servings, foods were classified into six groups: grains; meat, fish, eggs and legumes; vegetables; fruits; milk and dairy products; and oils and sweets. The number of servings was calculated as the ratio of consumed food amounts to a serving amount of each food group. A serving was determined according to the amount of calories provided from each food group as follows: grains (300 kcal); meat, fish, eggs and legumes (100 kcal); vegetables (15 kcal); fruits (50 kcal); milk and dairy products (125 kcal); and oils and sweets (45 kcal) [21].
DDS was assessed following the methodology developed by Kant [24] and its modification by Um [25] for the Korean population. Foods were separated into five groups of grain, meat, vegetable, fruit, and dairy. The grain group included all cereals and cereal products other than cakes, pies, pastries, cookies, and snacks. The meat group comprised all protein rich foods such as fish, poultry, meat, eggs, and legumes. The vegetable group consisted of all cooked, raw, frozen and canned vegetables. Fruit juices and frozen, canned and dried fruits were included in the fruit group but not fruit drinks. Dairy group included all milk and dairy products except butter and cream. The foods were further divided into solids and beverages. Beverages included items such as soy milk, liquid milk, yogurts, cereal based drinks (e.g., sikhye), and vegetable and fruit juices. The minimum amount for a score was 15 g or 30 g for solids and beverages, respectively, in the grain or dairy group. In case of all other groups, the minimum amounts were set at 30 g or 60 g for solids and beverages, respectively. Intake of any food group meeting the minimum amount was awarded a score of 1 and intake short of the minimum amount was awarded a score of 0.
Statistical analysis
Statistical analyses were performed in SAS 9.4 (SAS Institute Inc., Cary, NC, USA) using proc survey procedures for analysis of complex survey data. Appropriate individual weights were assigned to give parameters representative of Korean adolescents.
All the analyses were separately conducted for two age groups: middle school-aged adolescents and high school-aged adolescents. Comparisons were made between food secure and insecure groups within each age group. ANCOVA was used to analyze continuous variables with food insecurity as the dichotomous independent variable, adjusted by age and sex. Nutrient intake data was log transformed before ANCOVA to obtain distributions that proximate to normal distribution [8]. Chi-square analysis was employed with categorical variables.
RESULTS
General characteristics
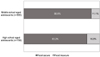
The prevalence of food insecurity among Korean adolescents is shown in Fig. 1. About 11.1% of middle school-aged adolescents were found to be living in food insecure households while high school-aged adolescents living in food insecure households were up to 16.8%.
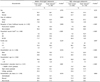
The general characteristics of the subjects are shown in Table 1. There were significant differences between food secure and insecure groups among middle school-aged and high school-aged adolescents regarding the distribution of reception of basic livelihood security, household income level, householder's sex, education level, and job status. Among both age groups, more of food insecure adolescents came from households that were of low income, and past or current recipients of basic livelihood security than food secure adolescents. There were also more female householders, householders with less than middle school education, and unemployed householders associated with households of food insecure adolescents than food secure adolescents.
Dietary and health-related characteristics
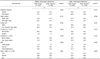
Table 2 shows the dietary and health-related characteristics of adolescents by food security status. No significant differences were found in terms of night eating, eating out, smoking, drinking, BMI, and body image perception by food security status among middle school-aged and high school-aged adolescents. However, more of food insecure middle school-aged adolescents (43%) skipped breakfast than their food secure adolescents (25%) (P = 0.028).
Nutrient intake
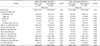
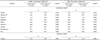
The nutrient intake of adolescents in terms of nutrient density is presented in Table 3. The nutrient intake varied with food security status mostly among middle school-aged adolescents. Food insecure middle school-aged adolescents reported significantly higher carbohydrate intake (P = 0.006), but lower fat (P = 0.010) and saturated fatty acids intake (P = 0.005) than food secure middle school-aged adolescents although the intake of both groups was in the recommended ranges.
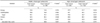
Table 4 presents the prevalence of inadequate nutrient intake among adolescents. There were no significant differences in the prevalence of insufficient and excessive nutrient intake among food insecure groups in comparison to food secure groups, regardless of age group. The nutrients for which the highest prevalence of deficiency was reported were vitamin A, vitamin C, and calcium. Excessive intake of sodium was also very high, regardless of age group and food security status.
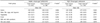
Table 5 summarizes the prevalence of consuming energy within its appropriate range and meeting AMDRs. No significant differences were found in the prevalence of meeting appropriate range of total energy intake and energy intake from macronutrients among middle school-aged and high school-aged adolescents, regardless of food security status. About 90% of middle school-aged and high school-aged adolescents consumed protein within the recommended ranges while less than 40% of middle school-aged and about 40% of high school-aged adolescents consumed carbohydrate within the recommended ranges.
Food intake
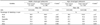
The results on food group servings are shown in Table 6. The average numbers of food group servings consumed by adolescents did not significantly differ by food security status in both age groups. Among middle school-aged adolescents, the average numbers of servings of vegetables were 4.2 and 4.4 in food secure and insecure groups, respectively. Middle school-aged adolescents consumed about 4 servings of grains as well as meat, fish, eggs and legumes. The numbers of servings of fruits were 1.5 and 2.2, and those of milk and dairy products were 1.3 and 1.1 in food secure and insecure groups, respectively.
Among high school-aged adolescents, the average numbers of servings of vegetables were 4.6 and 4.9 in food secure and insecure groups, respectively. High school-aged adolescents consumed about 3.8 servings of grains. On average, the numbers of servings of meat, fish, eggs and legumes were 4.3 and 4.5 in food secure and insecure groups, respectively. The mean numbers of servings of fruits were 1.3 and 1.0 in food secure and insecure groups, respectively. High school-aged adolescents consumed about 1.0 serving of milk and dairy products.
The results on DDS are shown in Table 7. The DDS was above 3 for all cases, and no significant differences were found between food secure and insecure groups among middle school-aged and high school-aged adolescents. Almost 90% and 80% of both groups obtained a score in meat and vegetable, respectively. The percentages of middle school-aged adolescents who obtained a score in fruit and dairy were about 50% and 30% in food secure and insecure groups, respectively. The percentages of high school-aged adolescents that obtained a score in fruit were 43% and 35% in food secure and insecure groups, respectively. Dairy was the food group that the least percentage of adolescents obtained a score from among both age groups, regardless of food security status.
DISCUSSION
In this study, there were more high school-aged adolescents living in food insecure households than middle school-aged adolescents. There have been previous studies demonstrating the vulnerability of older children due to diminished shielding effect from parents [89]. This study also shows the vulnerability of older adolescents in terms of exposure to food insecurity.
The present study found that food insecure adolescents were associated with reception of basic livelihood security and low household income level. There were also more female householders, householders with less than middle school education, and unemployed householders associated with food insecure adolescents than food secure adolescents. These results concur with those reported by Kim and Oh [8] and Kim et al. [26]. However, while Kim [26] found a significantly higher proportion of elder headed households, this study and Kim and Oh [8] did not find this difference significant. Food insecurity in economically advanced countries is highly associated with economic status [4].
Except for breakfast skipping among middle school-aged adolescents, the current study did not find significant differences between food secure and insecure groups regarding dietary and health-related characteristics. Breakfast skipping was shown to be associated with food security status among Korean children in a previous study [8].
The results of this study show a significant variation in intake of carbohydrate, fat, and saturated fatty acids with food security status among middle school-aged adolescents. Kim and Oh [8] reported lower intake of fat among food insecure children aged 5-18 years compared to their food secure age mates for the year 2012. A similar trend was observed in a previous study that compared nutrient intakes of children from low income households to those from high income households [27]. The reason for sharing the trend similar to that observed in the study about low income household may be because food insecure individuals were also associated with low household income in this study.
However, the current study did not find variation in intake of other nutrients with food insecurity. In contrast, Kim and Oh [8] additionally found variation in protein, calcium, and phosphorous with food security status among children aged 5-18 years old. These contradictions may have been due to the age range of children included in the study. The results also contradict results from a Canadian study that observed lower intake of vitamin A and vitamin C among Canadian adolescents aged 14-18 [9]. In this case, contradiction may have been due to socio-cultural differences between the subjects used in the studies.
The results presented here show that more than 70% of adolescents consumed sodium in excess of the national intake goal regardless of age and food security status. Excessive intake of sodium continues to be a serious challenge in the Korean diet [28]. Therefore, existing intervention programs for reducing sodium intake should be strengthened and evaluated to improve their effectiveness especially among adolescents. Special considerations should be made for individuals from food insecure households to access these programs so that they could benefit.
The percentages of adolescents meeting AMDRs for sugar intake were below 50% among middle school-aged and high school-aged adolescents, regardless of food security status in the current study. While stricter recommendations on free sugar and added sugar that were set for the global population [29] have been adopted by other countries [2], Korea appears to continue using the total sugar recommendation primarily [21]. However, about 68% of total sugar consumed by Korean adolescents is from processed foods such as carbonated beverages, fruit and vegetable drinks, sugar, confectionary, and candies [23], which are low-nutrient dense and are more likely to have free sugar and added sugar. Therefore, a stricter recommendation for this age group that highlights free sugar and added sugar may be more suitable. In this regard, it is also necessary to develop databases that may be used to analyze and monitor intake of these particular types of sugars.
This study found that the average food group servings of adolescents' intake was lower than the recommended intake for vegetables, fruits, and milk and dairy products. This pattern of food group servings provides an explanation for the low intakes of vitamin A, vitamin C, and calcium among Korean adolescents observed in this study. The DDS was fairly favorable and above 3 for middle school-aged and high school-aged adolescents, regardless of food security status. However, few adolescents obtained a point from the fruit and dairy groups which reaffirms low intake of fruit and dairy as reason for low and insufficient intakes of vitamin A, vitamin C, and calcium.
Food intake did not vary with food security status among adolescents in this study. This result contradicts the studies that previously indicated variation in food intake with food security status [811]. Kirkpatrick and Tarasuk [9] found that intake of fruits and vegetables among Canadian males aged 14-18 years was lower among food insecure individuals than food secure individuals. However, this study was a foreign study, and therefore the variation in results was possibly a result of differences in food environments between the two countries. For example, vegetables are widely available, relatively inexpensive and an essential component of the traditional diet in Korea [30].
Except for a few nutrients among middle school-aged adolescents, this study did not find variation of dietary intakes with food security status among Korean adolescents. The existing multiple intervention programs available for food insecure adolescents may have contributed to this observation. Korea provides school going children with free school lunch. As of 2016, 70.5% of students in elementary, middle, and high school were supported by the program [31]. Community level foodservice programs targeting poor households also exist [32]. Besides these interventions, parents, especially mothers, often compromise their own diet to protect their children from the consequences of food insecurity [33]. Furthermore, certain studies have demonstrated that food secure adolescents are also likely to make poor food choices [34]. It is possible therefore that these factors of available intervention programs, parental shield, and poor choices among food secure adolescents in combination offset the effect of food insecurity on dietary intakes among Korean adolescents.
This study shows that problems of inadequate dietary intake are common to both food secure and food insecure adolescents in Korea. It is therefore necessary to formulate interventions to improve the dietary intake of Korean adolescents in general. However, food insecure adolescents have socio-economic backgrounds that are different from their food secure adolescents which may become socio-economic barriers to the effectiveness of nutritional interventions targeting adolescents [35]. Therefore, it is still important to consider the food security status of the target population when planning nutritional interventions for adolescents. For example, in the case of nutrients for which deficiency rates were high across food security and insecurity groups, rather than emphasizing expensive sources, common and inexpensive dietary sources would be more effective for food insecure adolescents.
The study suffers from a few limitations. Firstly, the 18-item questionnaire for analyzing food security status has faced criticism for asking sensitive questions especially when it comes to the part concerning children. People, especially those affected by the problem, tend to refrain from answering. Secondly, the single 24-hour recall is criticized for failure to correct for variation in day-to-day individual intake. Nonetheless, the study provides an in-depth insight into the dietary intakes of Korean food insecure adolescents segmented by age group.
In conclusion, the percentage of adolescents living in food insecure households was higher for high school-aged adolescents than middle school-aged adolescents. The nutrient and food intakes of the adolescents were largely similar regardless of food security status. Both food secure and food insecure Korean adolescents demonstrated risk of deficiency of micronutrients, especially vitamin A, vitamin C, and calcium and low intake of dairy and fruit. It is possible that some food insecure adolescents from particular socio-demographics such as sex, area of residence, and income level may be more vulnerable to the consequences of food insecurity. Therefore, further studies and efforts to monitor dietary intakes of food insecure adolescents are still necessary.
 XML Download