

 PDF
PDF ePub
ePub Citation
 Print
Print


INTRODUCTION
Diet is a major factor in protecting against the development of diseases or death in increasing the lifespan of an individual [1]. Studies investigating the impact of dietary factors on health generally assess dietary exposure in terms of the nutrient intake [2], although sometimes this is measured with regard to food intake or dietary patterns [34]. Nutrient intake can be assessed by the direct analysis of foods reportedly consumed by individuals [5], but this method is not suitable for most epidemiological research. In numerous studies, the dietary intake of specific nutrients has been estimated by multiplying the amount of food consumed by the nutrient content of that food [67]. Thus, the development of a comprehensive and complete database of foods and their nutrient content is essential for making accurate estimates of dietary intakes. However, new foods are continuously emerging with the growth of the food industry, the opening of food markets under world trade, and the changes in the weather, as well as food fads and concerns about foods eaten. In addition, issues dealing with health-related food component have been steadily expanding from nutrients to various chemical substances, including phytochemicals and environmental contaminants [89]. For these reasons, food composition tables continue to require constant revisions even after their development. However, analyzing nutrient profiles is costly. In the US, the cost of chemical analyses was up to $2,000 per sample [10], In Sweden, it was estimated to cost more than €3,000 per sample [11], and analyzing nutrient profiles currently costs more than ₩2,500,000 in Korea [12]. Constructing databases on food composition still requires huge amounts of money. Therefore, it is necessary to select key foods and to set priorities for analyzing the nutrient content.
The key food approach for identifying key food items was first adopted in the mid-1980s by the US Nutrient Data Laboratory (NDL), an organization responsible for developing the US Department of Agriculture's standard reference database for food components [13]. This approach has been used for regularly updating the existing database to reflect the foods currently available [14151617]. Several countries have utilized this method for planning food composition analysis [181920]. Efforts have been made to improve the quality and size of the Korean food composition database, but to the best of our knowledge, there has been no previous study on setting priorities for key foods for future analysis. The aim of this study, therefore, was to establish an appropriate procedure for generating a list of potential key foods and to identify key foods in Korean diet.
SUBJECTS AND METHODS
Materials
The food consumption data of the Korea National Health and Nutrition Examination Surveys (KNHANES) 2013-2014 was used to generate a list of key foods in the Korean diet. KNHANES 2013–2014 was the most recent nationwide survey. A total of 14,043 individuals aged ≥1 year participated in the food consumption survey.
The food consumption data was collected using the 24-h recall method. Well-trained dietitians asked survey participants when, where, what, and how much they had eaten during the preceding 24 h, according to the predefined protocol [21]. Everything that individuals ate was reported with the name of food actually consumed in a real-life setting, such as “seaweed soup with beef” (multi-ingredient food) and “milk” (single-item food). If survey respondents ate a mixed dish (multi-ingredient food), the interviewer asked them who prepared the multi-ingredient food (e.g. their family member or themselves) and where they ate (e.g. school food services, workplace cafeteria, or restaurants). If the food was prepared at home, the interviewer additionally surveyed the list of specific ingredients and amounts of each ingredient for the food, and used the recipe to estimate dietary intakes of each ingredient food from the mixed dish. If the dish was not prepared at home or details on the recipe were not collected, intakes of each ingredient food were estimated using the pre-developed “recipe files for the food consumption survey of the KNHANES”. If a single-item food was consumed, details (e.g. product name, species, or type of process) about the food were surveyed.
Thus, the data file contained various survey responses, including the generic name of the food consumed by individuals (in a variable name “N_DNAME”), and the information which was converted from the survey responses as follows: the code value matched with the generic name (“N_DNAME”, described as “dish code” in Korean), the code value (“N_FCODE”, described as “food code” in Korean) matched with each ingredient in multi-ingredients food or particular information of single-ingredient food. Dietary intakes of nutrients were calculated by multiplying each food consumption amount with the nutrient content of each ingredient food.
The data file included a wide range of information from the survey responses to the estimation of dietary intake of nutrients, and contained the data of the food type actually consumed in a real-life setting as well as its individual ingredient. This study was reviewed and approved by Institutional Review Boards of Kookmin University, KMU-201607-HR118.
Methods
To identify the key foods in a real-life setting, we used the list of foods reported as consumed by survey respondents (“N_DNAME”), not that of each ingredient (“N_FCODE”) which is decomposed from the food consumed directly by respondents.
Among available nutrients in the data file, we used the following 17 nutrients as key nutrients for selecting foods: energy, carbohydrates, protein, fat, fiber, minerals (calcium, sodium, phosphorus, potassium, and iron), and vitamins (vitamin A, retinol, carotene, thiamin, riboflavin, niacin, and vitamin C).
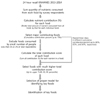
We modified the nutrient consumption approach suggested by Haytowitz et al. [16] to generate a list of potential key foods (Fig. 1). First, we calculated the percentage contribution of each food to each nutrient and then chose items contributing up to a cumulative total of 75%, 80%, 85%, and 90% for each nutrient. At each cumulative percent (75%, 80%, 85%, and 90%) level, we combined items which were chosen for each nutrient and removed any duplicates to produce a list. The list comprised the foods contributing up to each cumulative percent level (75%, 80%, 85%, and 90%) for at least one nutrient. Second, we checked the impact of excluding the foods not widely consumed. Total contributions (%) of all foods in the list of each nutrient were calculated at each level of cumulative contribution. Total contributions (%) of the remaining items, after excluding the foods consumed by on a small number of respondents (< 1% and < 2% of all participants), were also calculated. Then, we compared the total contribution (%) to each nutrient before and after excluding foods. Third, we tried to priorities among the foods in the list to generate minimized list. To address this issue, we calculated total nutrient score for each food by summing all percent contribution times 100 for key nutrients, and sorted the score in descending order. Then we compared total percent contributions of foods, within the 100, 90, 85, 80, and 75 percentiles of the list, to the key nutrients. Finally, we selected the minimized list of foods that contributed to at least 90% of the key nutrient intake as key items for analysis. Besides, we presented the numbers of selected key foods by food group and their percentage contribution to each nutrient. Foods were divided into 29 groups (Table 1) according to the classification system predefined by the Korea Centers for Diseases Control and prevention that conducts the KNHANES [21].
RESULTS
A total of 1,575 foods were reported as consumed by the respondents of KNHANES 2013-2014.
Major contributors to the key nutrients
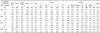
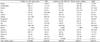
Table 2 shows the number of food items included within the various cut-off levels of the cumulative contribution for each nutrient (from 75% to 90% at 5% intervals). For example, of the 1,575 foods, 240 items contributed to 85% of energy intake. The number of foods contributing up to 85% of at least one nutrient intake was a total of 570. Similarly, 338 foods contributed to 90% of the energy intake and totally 709 items contributed to 90% of at least one nutrient intake.
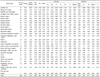
Contributing to 85% of any key nutrient intake, 570 foods covered 91.9% (sodium) to 95.1% (retinol) of intake and an average of 93.4% of all key nutrient consumption (Table 3). At a higher level of cumulative contribution, more foods were considered to be major contributors, but the proportion of the nutrients contributed by the additional foods was smaller.
Identification of key foods through selecting more major contributors
Table 3 also shows the change in contribution when the food consumed by only a small number of survey respondents was excluded. When we excluded the foods consumed by less than 1% of the respondents from the 85% cumulative contribution row of the table, the mean contribution to all the key nutrients decreased from 93.4% to 76.3%. After excluding the foods consumed by less than 2% of the respondents, the mean contribution further decreased to 61.0%. Exclusion of these uncommonly consumed foods resulted in a considerable loss of cumulative contribution to the nutrient intake. For this reason, we did not exclude the foods consumed by small number of respondents.
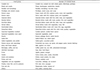
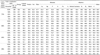
The number of chosen foods and their contribution to key nutrients ranked by the total nutrient scores of each food are shown in Table 4. Among the 570 foods that contributed to 85% of at least one nutrient, the numbers of items above the 90, 85, 80, and 75 percentiles of the total nutrient score were 513, 485, 456, and 428, respectively. Over 90% of the average nutrient intake was supplied by the 456 foods with contribution scores above the 80 percentile. Therefore, we identified these 456 foods as the key foods in the Korean diet. The list of 456 key food items and each total nutrient score is shown in the Supplementary table. Table 5 shows contribution of top 5 key items to each nutrient and their total nutrient scores. “Cooked rice with whole grains”, chosen as the top key food, was not a major contributor to some vitamins, however, it contributed considerably to most nutrients and its total nutrient score was 8,752.688.
Additionally, we presented the numbers of the selected key foods by group and their contribution to each key nutrient in Table 6. A substantial part of most key nutrient intake came in the form of multi-ingredient foods. For example, the cooked rice group, with 41 various items (including white rice, multigrain rice, bibimbap, and gimbap), was the top contributor to 8 key nutrients: energy, carbohydrate, protein, phosphorus, potassium, iron, vitamin B1, and niacin. Furthermore, the contributions of the cooked rice group to the remaining 10 nutrients were also in the top 10 among the dish groups. The grilled dish group, including grilled pork belly (samgyeopsal-gui), contributed to fat, vitamin A, and vitamin B2 intakes. Although consumption of the single-ingredient food groups contributed relatively little to the key nutrient intake, the fruit group was the top contributor to the dietary fiber and vitamin C intakes. The dairy foods and frozen desserts group substantially contributed to the dietary calcium and retinol intakes.
DISCUSSION
Using the 24-h recall data from KNHANES 2013–2014, we identified 456 food items as key foods in the Korean diet. These items were selected out of the major food contributors according to their relative importance with regard to their total nutrient score. Among the 1,575 foods reported to be consumed by the survey respondents, the 456 selected key foods contributed to an average of 90.9% of the key nutrient intake.
No food composition database can meet the need of all of its users. Most databases have their limitations. In many cases, researchers replace missing nutrient values with those of a similar food when assessing specific nutrient dietary intakes [16]. More accurate estimation requires improvement of the quality and quantity of data in food composition tables. However, analyzing nutrient profiles presents difficulties, including the enormous expense and the diversity of foods consumed [1018]. This requires priorities to be established regarding which foods should undergo nutrient profile analysis. These priorities can be set according to the foods that are most important for estimating dietary nutrient intake. Some studies, such as the total diet surveys that assess dietary exposure to contaminants in foods, have selected commonly and frequently consumed food items as representative foods [11]; the contaminant content of the representative foods were then analyzed, and the levels of heavy metals or pesticide residue for each food were used to estimate the dietary concomitant intake. Important foods have also been determined based on their contribution to specific nutrient intakes. This method, known as the key food approach, was first developed by NDL of the United States Department of Agriculture in the mid-1980s [13]. NDL's list contained a wide range of food component data, which needed regular updates to take into consideration the changes in public health-related issues as well as the emergence of new foods. In 1996, NDL used data from the 1989–1991 Continuing Survey of Food Intakes by Individuals (CSFII) to produce a list of foods that made a major contribution to 14 nutrient intakes, identifying 527 foods as key foods [10]. These foods contributed to approximately 90% of key nutrient intake in the American diet. Even though the list of key foods was much shorter than the total number of foods consumed by the whole population, there was still a need for a procedure to determine further priorities so that limited resources could be efficiently used. Thus, NDL modified their original approach of identifying key foods according to their contribution to the nutrient intake. In 2002, NDL published a list of 666 key foods based on food consumption data from the 1994–1996 CSFII and the 1988–1994 National Health and Nutrition Examination Survey (NHANES) [16]. These 666 items contributed to up to 75% of at least one nutrient intake and in total contributed to up to 90% of 22 nutrients' intake for public health significance. To establish further priorities, NDL summed the percentage contribution of each nutrient in each food and then divided the 666 key foods into 4 quartiles of nutrient consumption score; this resulted in 14 foods in the first quartile, 42 in the second, 126 in the third, and 484 in the fourth. The foods in the highest quartile had a relatively greater importance for diet quality. Given this relative importance, NDL planned to collect and analyze more samples of foods in the highest quartile than foods in the other 3 quartiles, thereby concentrating analytical resources on the most important foods. Recently, NDL regenerated the list of key foods using data from What We Eat in America 2011–2012, part of the NHANES survey [14]. A total of 576 food items were included in this list of key foods; these had a cumulative contribution of up to 75% of intake for at least one of the 14 key nutrients addressed in the 2010 Dietary Guidelines for Americans. NDL divided the 576 key foods into quartiles according to the nutrient consumption score; this resulted in 11 foods in the first quartile, 40 in the second, 92 in the third, and 433 in the fourth.
The core elements of the key food approach were developed by the US NDL, but this method has been adopted in many other countries with modifications [181920]. In Sweden, key foods were chosen using group-specific key nutrients for each food group [18]. Among the 1,894 foods included in the Swedish national dietary survey 2010–2011, 320 were chosen as key foods, each contributing 75% of the key nutrient intake. In Bangladesh, key foods were identified among those most frequently consumed [19]. Australia first developed their food composition tables in the 1980s, but a substantial amount of information in the databases was obtained from overseas. To update the databases, Food Standards Australia New Zealand (FSANZ) identified key foods based on a modification of the approach developed by NDL. FSANZ chose 40 foods as key for Australian children aged 2–15 years in 2006 and 48 foods for Australian adults aged ≥16 years in 2008 [20]. Deciding the number of foods for nutrient profile analysis naturally depends on the resources available. There are no specific criteria for identifying key foods. However, it is essential to continually update the existing food composition databases.
In this study, a total of 456 foods were identified and selected as key foods for the Korean population, contributing at least 90% of the key nutrient intake. Identifying key foods and setting priorities for analysis will be helpful for systematically updating and improving food composition databases.

 XML Download