

 PDF
PDF ePub
ePub Citation
 Print
Print


INTRODUCTION
Atherosclerosis is a progressive vascular disease characterized by the deposition of lipid-laden plaques within arterial walls. Foam cells are observed in the early stage of atherosclerosis, which subsequently develops into fatty streaks where macrophage cell debris is found. Atherosclerosis is accelerated by several factors including hypercholesterolemia, oxidative stress, and inflammation [1].
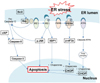
Endoplasmic reticulum (ER) is the site where peptide folding and post-translational modification occurs [2]. Numerous lines of evidences have ascertained that elevated ER stress in aorta plays a critical role in the formation of fatty streak because of macrophage cell death [23]. As ER stress elevates, unfolded protein response (UPR) will be initiated via activation of ER membrane receptors such as protein kinase RNA-like ER kinase (PERK), inositol requiring kinase 1 (IRE1), and activating transcription factor 6 (ATF6) by dissociating from glucose regulated protein 78 (GRP78) [3]. Under the prolonged ER stress, transcription factor known as C/EBP homologous protein (CHOP) will be upregulated to start apoptosis in order to terminate the problem [4]. In parallel, mitochondria-controlled apoptosis is also initiated via the c-Jun N-terminal kinase (JNK)/bcl-2-associated X protein (Bax)-dependent pathway [5]. The JNK, which activation can be partially IRE1-dependent, regulates the balance of Bax/B-cell lymphoma 2 (Bcl-2) [26]. Through the mitochondria-dependent apoptotic pathway, the activities of downstream caspase-9 and caspase-3 trigger apoptosis.
Kimchi is a Korean fermented vegetable dish made with cabbage, red pepper, garlic, ginger, green onion, and fermented fish sauce. Health benefits have been well established with respect to antioxidaitve [7], lipid-lowering [8], anti-atherogenic [9], and anti-inflammatory [10] effects. Health promoting effects of kimchi might be attributed to bioactive compounds present in kimchi. Our team previously identified ascorbic acid, capsaicin, 3-(4'-hydroxyl-3',5'-dimethoxyphenyl)propionic acid (HDMPPA), quercitrin, and quercetin in kimchi methanol extracts (KME), which amounts were 280, 270, 40, 30, and 20 µg/g-KME, respectively [11]. Lipid lowering and antioxidative effects of quercetin [12], capsaicin [13], ascorbic acid [14], and HDMPPA [1516] have been cited. In our previous study, KME and HDMPPA demonstrated antioxidative [15], lipid-lowering [16], fatty streak formation inhibition [17], and anti-inflammatory activity [18] in animal studies. In addition, KME and HDMPPA demonstrated ER stress inhibitory effects in macrophage cells [19]. However, the relationship between fatty streak formation and ER stress and apoptosis in aorta have not elucidated in vivo yet. In this study, the anti-atherogenic effects of KME were examined in a high cholesterol diet (HCD)-fed low-density lipoprotein receptor knockout (LDLr KO) mice through elucidation of the ER stress and apoptotic signaling in the aorta.
MATERIALS AND METHODS
Preparation of kimchi methanol extract
Kimchi was made by previously described [9]. Kimchi ingredients were brined Korean cabbage (84.9%), red pepper powder (2.6%), garlic (2.5%), green onion (2.3%), ginger (0.5%), fermented fish sauce (3.0%), sugar (0.5%), and glutinous rice paste (3.7%). Kimchi was fermented until its pH reached 4.3 ± 0.1. The freeze-dried kimchi was extracted with 10 volumes of 70% methanol for 24 h at room temperature and repeated three times. The extract was concentrated using a rotary evaporator (R-200; Buchi, Flawil, Switzerland) and freeze-dried. The yield of KME was approximately 8%.
Experimental animals and diet
LDLr KO mice (male, 5 weeks old) were purchased from Jackson Laboratories (Bar Harbor, ME, USA). After 1 week of acclimation, the animals were divided into two groups on the basis of their body weights: the KME group (KME, n = 20) and the control group (distilled water, n = 20). The mice were housed individually under a 12 h light-dark cycle, temperature of 23 ± 1℃, and humidity of 50 ± 5%. The HCD, containing 1.25% cholesterol was prepared according to the guideline of Paigen's atherogenic rodent diet [20]. Mice fed HCD for 8 weeks together with oral administration of KME or distilled water. The dose of KME was 200 mg·kg-bw−1·day−1, which we had previously exhibited health benefits in mice [11]. The body weight was measured weekly and food intake was monitored daily. After 8 weeks, the mice were fasted for 12 h and then subjected to CO2 anesthetization. Blood was drawn from the inferior vena cava into heparin tubes. The organs were perfused with ice-cold phosphate-buffered saline and the aortas were excised. For histological analysis, the heart and the connected part of the aorta (5 mm) were fixed with 4% paraformaldehyde. The animal study was approved by the Pusan National University Institutional Animal Care and Use Committee (Approval No. PNU-2016-1063).
Plasma lipid profile
Plasma triglyceride (TG), total cholesterol (TC), and high-density lipoprotein cholesterol (HDL-C) concentrations were measured using commercially available kits (AM157S-K, AM202-K, and AM203-K, respectively; Asan Pharmaceutical Co., Seoul, Korea). Low-density lipoprotein cholesterol (LDL-C) concentration was calculated by the method of Friedewald et al. [21].
Plasma reactive oxygen species and peroxynitrite levels
Reactive oxygen species (ROS) and peroxynitrite levels were determined using 2',7'-dichlorofluorescein-diacetate reagent [22] and rhodamine solution containing dihydrorhodamine 123 [23], respectively. Fluorescence changes were measured at wavelengths of 480 and 530 nm for 30 min, using a fluorescence plate reader (FLUOstar OPTIMA; BMG Labtech, Durham, NC, USA).
Western blot analysis
Western blot analysis was conducted as previously reported [9]. In this study, two aortas from the same group were combined and homogenized to extract protein for the western blot assay [2425]. The protein content was quantified using a Bio-Rad Protein Assay Kit (Bio-Rad Laboratories, Hercules, CA, USA). Protein expression was visualized by enhanced chemiluminescence and detected with CAS-400 apparatus (Core Bio, Seoul, Korea). The band densities were calculated using ImageJ software (National Institutes of Health, Bethesda, MD, USA) and normalized to the expression of β-actin. The antibodies used in this study; nuclear factor (erythroid-derived 2)-like 2 (Nrf2, sc-13032), superoxide dismutase (SOD, sc-11407), catalase (CAT, sc-34285), glutathione peroxidase (GSHPx, sc-133160), GRP78 (sc-1050), phospho-PERK (p-PERK, sc-32577), X-box binding protein 1 (XBP1, sc-7160), Bcl-2 (sc-7382), and Bax (sc-493) were purchased from Santa Cruz Biotech. (Santa Cruz, CA, USA). Phospho-JNK (p-JNK, MA5-14943) was from Thermo Scientific (Waltham, MA, USA). Phospho-eukaryotic initiation factor 2 subunit alpha (p-eIF2α, ab32157), caspase-3 (ab32351), caspase-9 (ab63488), cellular inhibitor of apoptosis protein (cIAP, ab25939-100), and β-actin (ab8226) were from Abcam Inc. (Cambridge, UK).
Measurement of atherosclerotic lesion size
Aorta with the three valve cusps were embedded (Tissue-Tek OCT compound; Miles Inc., Elkhart, IN, USA) for preparation of the frozen blocks. Sections were sliced to 7 µm thickness using a microtome (CM1510S-3; Leica, Wetzlar, Germany), which were stained with oil red O and counterstained with hematoxylin. The degree of fatty streak formation was observed under an optical microscope (ECLIPSE Ti; Nikon Corp., Tokyo, Japan). The lesion size was measured using computer-assisted microscope with DMC Advance Image software (Techsan Ltd., Suwon, Korea).
TUNEL assay
Paraffin-blocked aorta samples were sliced into 4-µm-thick sections using a microtome (Microm HM 325; Thermo Fisher Scientific), which were then subjected to terminal deoxynucleotidyl transferase-mediated deoxyuridine triphosphate-biotin nick end labeling (TUNEL) assay, developed using the 3,3'-diaminobenzidine stain (ApopTag Plus Peroxidase In Situ Apoptosis Detection Kit; Chemicon International, Temecula, CA, USA). For each slide, cells with brown-colored TUNEL-positive nuclei were counted in five contiguous high-power fields under a light microscope (ECLIPSE Ti; Nikon Corp.) and presented as TUNEL-positive nuclei per 100 cell nuclei [26].
RESULTS
Body weight gain, food intake, and food efficacy ratio
The food efficacy ratio in the KME group was higher than that of the control group, but the differences were not significant. The aorta weights between two groups were also not significantly different (Table 1).
Effects of plasma lipid and oxidative stress levels
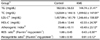
Compared with the control group, the TG, TC, and LDL-C concentrations in the KME group were significantly lower, by 20.69%, 7.96%, and 7.59%, respectively (P < 0.05, Table 2). In contrast, the plasma HDL-C concentration was significantly higher, by 165.42% (P < 0.05). The atherogenic index was decreased by 40.11% in the KME group (P < 0.05), and the ROS and peroxynitrite ratios were reduced by 57.09% (P < 0.01) and 9.26% (P < 0.05), respectively, relative to the control values.
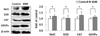
Expression of antioxidative transcription factor and enzymes in the aorta
The expression level of Nrf2 was 120.31% higher in the KME group (Fig. 1, P < 0.05) than the control group. Antioxidant enzymes expression such as SOD, CAT, and GSHPx significantly increased by 108.37%, 128.57%, and 114.53%, respectively, in the KME group (P < 0.05).
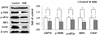
Expression of ER stress markers in the aort
Compared with the control group, the expression level of GRP78 in the KME group was decreased by 28.47% (Fig. 2, P < 0.05). The expression level of p-PERK and its target genes, p-eIF2α and CHOP, were decreased by 33.59%, 18.28%, and 24.69%, respectively, in the KME group (P < 0.05). In addition, the expression level of XBP1 was diminished by 35.29% (P < 0.05).
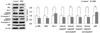
Expression of apoptosis-related molecules in the aorta
The expression levels of p-JNK, Bax, cleaved caspase-3, and cleaved caspase-9 were decreased by 31.25%, 29.91%, 20.35%, and 20.25%, respectively, whereas that of Bcl-2 was increased by 128.48%, relative to the control values (Fig. 3, P < 0.05). The expression of cIAP was not significant.
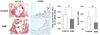
Fatty streak lesion size and the degree of apoptosis in aortas
Fatty streak lesion size in the aortic sinus was significantly reduced (by 30.92%) in the KME group (P < 0.05, Fig. 4). In addition, the degree of apoptosis in the aorta was less severe in this group. Apoptotic index was significantly decreased (by 47.15%) compared with that in the control group (P < 0.05).
DISCUSSION
Hypercholesterolemia, oxidized LDL, lipid peroxidation, oxidative stress, inflammation, and apoptosis are typical features of atherosclerosis and ER stress is positively associated with these symptoms [27]. Evidences from animal and human studies ascertained that ER stress and apoptosis lead to macrophage cell death, of which event subsequently contributes to atherosclerotic plaques formation and growth [23]. There are demands for the natural products possessing an ability to modulate the UPR and apoptosis induced by ER stress as therapeutic strategies for atherosclerosis prevention.
Oxidative stress is a distinctive pathophysiological condition observed in hypercholesterolemia wherein lipid peroxidation, reactive oxygen/nitrogen species production, and inflammation are prominent [1]. Earlier events in the atherosclerosis progression, oxidized LDL and monocytes must be translocated to the intima area of endothelium, which are stimulated under the oxidative stress via expression of adhesion molecules on the endothelium membrane. In the current study, kimchi consumption decreased plasma lipid, ROS, and peroxynitrite levels. Moreover, antioxidants such as Nrf2, SOD, CAT, and GSHPx in the aorta were upregulated, suggesting that KME diminished the oxidative stress in the plasma and aorta, which might contribute to the inhibition of fatty streak formation. These results are in line with previous studies on kimchi that demonstrated antioxidative [7], hypolipidemic [8], anti-inflammatory [10], and anti-atherogenic effects [9]. Health promoting effects of kimchi are expected because kimchi bioactive compounds such as allicin, gingerol, quercetin, capsaicin, ascorbic acid, and HDMPPA have revealed antioxidative effects [10]. Antioxidative effects of these bioactive compounds have been extensively studied. HDMPPA, a bioactive compound in KME revealed antioxidant effects in rabbits and apoE-/- mice [1516].
UPR is originally programmed to resolve an ER problem. But, the UPR pathway primed to ER stress in aorta could trigger atherosclerosis progression [3] because oxidative stress elevated in lipid-laden macrophages provoke ER stress and apoptosis. UPR pathways take place through dissociation of ER membrane sensors, PERK, IRE1, and ATF6, from GRP78 through phosphorylation. In the resting cells, these three molecules are inactivated by binding to GRP78. However, under ER stress, activated membrane sensors regulate chaperone, foldase, and other enzymes synthesis to increase the peptide folding. In parallel, p-PERK/p-eIF2α pathway upregulates CHOP, a transcription factor that initiates apoptosis. Several studies have shown that ER stress markers were found in the atherosclerotic lesions, indicating that ER stress in the aorta is a one of critical conditions in the progression of atherosclerosis [34]. In this study, KME decreased the expression levels of ER stress markers, GRP78, p-PERK, p-eIF2α, CHOP, and XBP1 in the aorta. Our results are in line with the previous study that KME and HDMPPA suppressed GRP78 and ATF6 expressions in 7-ketocholesterol-treated macrophages [19]. Similarly, superoxide scavenger, tempol, reduced the atherosclerotic lesion size by attenuating the oxidized LDL-induced ER stress [28] and glutathione suppressed the expression levels of ER stress markers in 7-ketocholesterol-treated macrophages [29]. Quercetin, a bioactive compound identified in KME, inhibited the activation of PERK, eIF2α, and IRE1 in ER stress-induced SH-SY5Y cells [30]. Furthermore, aortic apoptosis and plaque necrosis were tapered in mice (Ldlr-/- and Apoe-/-) lacking the CHOP gene [431]. It is evident that antioxidants or natural products with antioxidative property like kimchi [711] would diminish ER stress in the aorta, which might retard the development of atherosclerosis.
Bcl-2 families including Bax (pro-apoptotic molecule) and Bcl-2 (anti-apoptotic molecule) are key regulators in the mitochondrial apoptosis through caspase cascade. JNK is an upstream molecule in this signaling pathway [4]. Caspase cascade is sequential signaling pathways through activation of procaspase-12, caspase-9, caspase-3, and cell death. There is evidence showing that caspase cascade is activated during UPR, suggesting that IRE1 might enhance the activation of p-JNK and procaspase 12 during ER stress [6]. Moreover, ER stress inhibited Bcl-2 thereby induces conformational changes in Bax located on ER membrane [32]. Apoptosis pathways take place under the prolonged or uncontrolled ER stress, implying that disease state could be directly affected by the severity and duration of ER stress [2]. Atherosclerotic plaque formation is affected by the apoptotic events, in particular, macrophage cell death in the aortic intima [3]. Moreover, the plaque erosion or rupture, a critical event in atherosclerosis, was enhanced under the prolonged ER stress [29]. In this study, KME attenuated apoptotic signaling pathway in the aorta by decreasing the pro-apoptotic molecules, p-JNK, Bax, caspase-9, and -3, with concomitant increase of anti-apoptotic molecules, Bcl-2. Our results supported from the previous studies reporting that plaque necrosis was more susceptible to ER stress-induced apoptosis in macrophages lacking the Bcl-2 gene [33]. Hesperetin, a flavanone compound, inhibited mitochondria-dependent apoptosis in cardiomyocytes via downregulation of p-JNK, Bax, caspase-9, and -3, and upregulation of Bcl-2 [34], indicating that compounds with antioxidative properties might attenuate atherosclerosis through inhibition of apoptosis. Hypocholesterolemic effects of kimchi have been reported from animal and human studies [8910]. Mechanisms of action of KME reducing fatty streak lesion size were elucidated via suppression of adhesion molecule expressions, lipid peroxidation, and inflammation in the aorta. [17]. In parallel, current study of histological examination showed that KME reduced the fatty streak lesion size and apoptosis. We could interpret that the inhibitory effects KME on the ER stress and apoptosis in the aorta might, in part, impede the fatty streak formation.
In summary, KME downregulated ER stress markers and pro-apoptotic molecules, and upregulated antioxidants and anti-apoptotic molecules in HCD-fed LDLr KO mice (Fig. 5). A significant reduction in fatty streak lesion size in the KME group was observed. These findings of anti-atherogenic effects of KME through attenuation of ER stress and apoptosis would be suggested as a new approach to preventing the progression of atherosclerosis. Benefits of kimchi consumption might be attributed to antioxidative properties of bioactive compounds in kimchi. Further studies are needed for sound evidence from individual kimchi bioactive compound on the attenuation of ER stress and apoptosis and their synergic effects in atherogenic animal models.

 XML Download