Journal List > Nutr Res Pract > v.11(2) > 1050872

Yun, Kim, and Oh: Trends in energy intake among Korean adults, 1998-2015: Results from the Korea National Health and Nutrition Examination Survey

Abstract

BACKGROUND/OBJECTIVES

Assessing changes in energy intake and dietary sources is important to understand trends in the prevalence of obesity. Thus, we examined trends in energy intake and its nutrient and food sources in Korean adults from 1998 through 2015.

SUBJECTS/METHODS

This study included 70,769 subjects aged ≥ 19 years who completed a nutrition survey. Subject data were obtained from the 1998, 2001, 2005, 2007-2009, 2010-2012, and 2013-2015 Korea National Health and Nutrition Examination Surveys. Dietary intake was assessed by a 1-day 24-hour recall method.

RESULTS

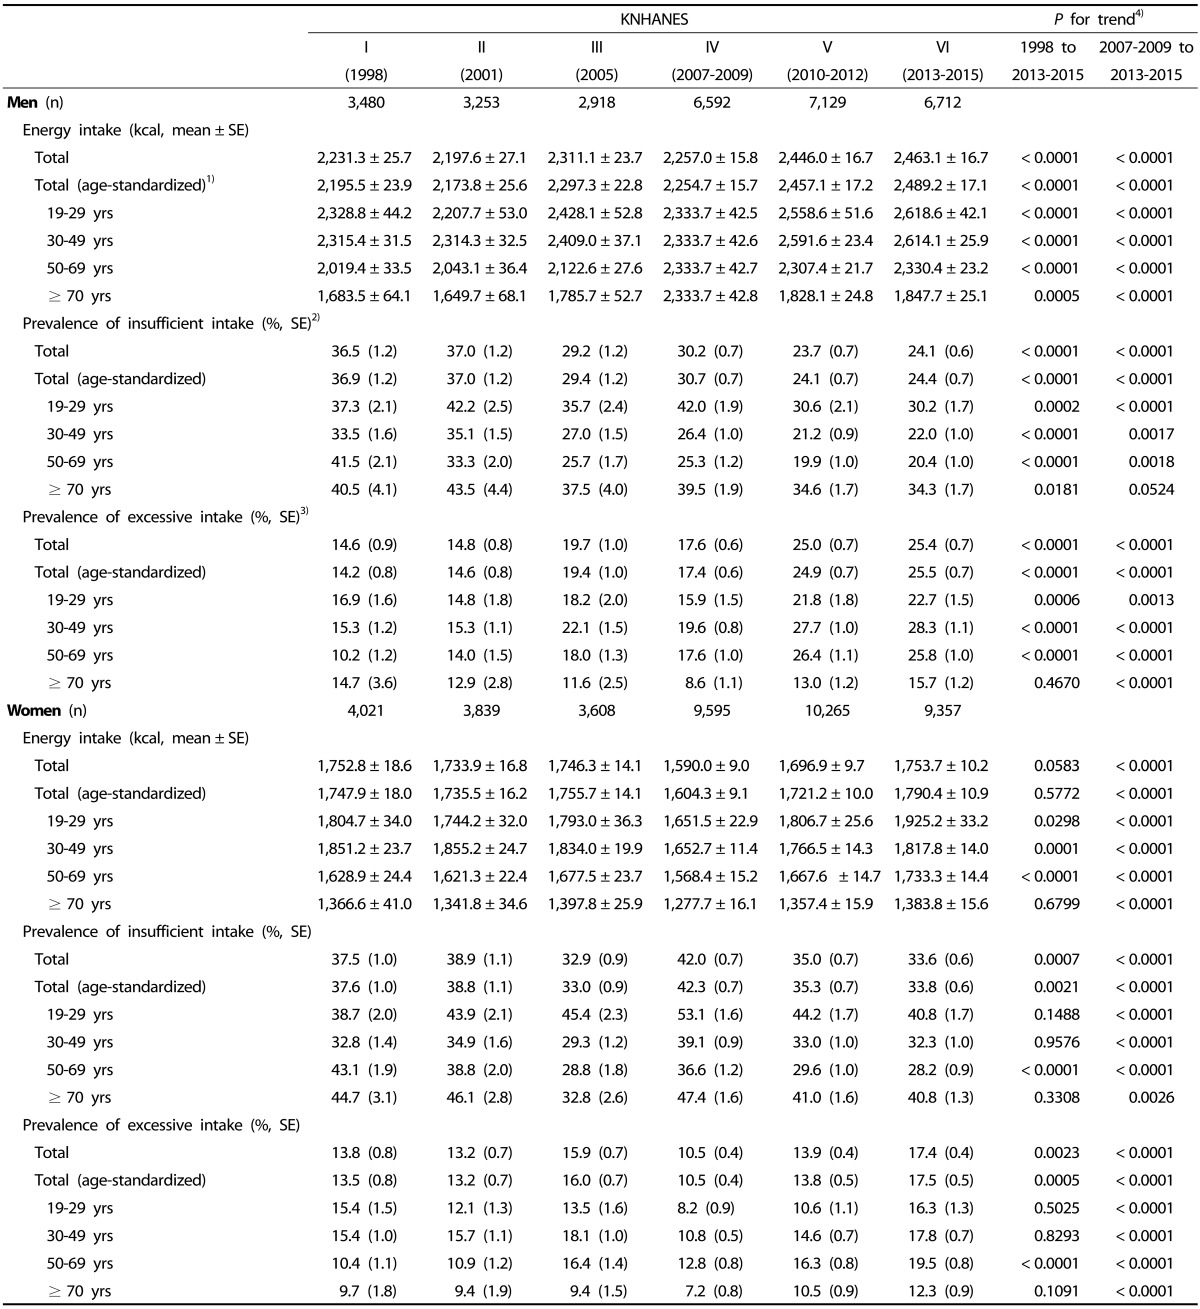
In men, the daily energy intake significantly increased from 2,196 kcal in 1998 to 2,489 kcal in 2013-2015 (P for trend < 0.0001). However, the daily energy intake among women did not change significantly over the same period (P for trend = 0.5772). The percentages of energy intake from animal foods (e.g., meat and milk) and beverages increased during the study period in both men and women. However, the percentage of energy intake from plant foods decreased due to a marked decrease in the intake of white rice. Changes in food sources of energy intake led to changes in the nutrient sources of energy intake; for example, the increase of energy intake from fat and decrease of energy intake from carbohydrate.

CONCLUSIONS

This study suggests that since 1998, energy intake has increased among Korean adult men, but not among women. However, the composition of food and nutrient sources of energy intake has changed in both men and women. Energy intake and its nutrient and food sources should continue to be monitored regularly in the Korean adult population.

INTRODUCTION

Assessing changes in food and nutrient consumption is important in the prevention of disease and improvement of health because dietary consumption has been reported to contribute to obesity and chronic diseases such as heart disease, diabetes, and cancer [123]. Many countries are monitoring nutrient intake and the food sources of those nutrients using national nutrition survey, and the results of those surveys have been used to develop and implement nutritional policies tailored to reflect changes in dietary consumption [45678].
According to nationally representative data for Korean, the prevalence of obesity in men aged 19 years and older increased from 25.1% in 1998 to 39.7% in 2015, and this trend was consistent across all age groups [9]. However, the trend for the prevalence of obesity in women differed across age groups during same period. The prevalence of obesity in women aged 40-59 years decreased slightly between 1998 and 2015, whereas the prevalence of obesity in elderly women (aged 70 years and over) increased over that period. In addition to physical inactivity, excessive energy intake has been documented as a major risk factor for obesity [10]. Therefore, assessing changes in energy intake and sources of energy intake is important to understand the observed trends in the prevalence of obesity.
Previous studies into dietary transition within Korean population have indicated that even though the percentage of energy intake obtained from the animal food or fat increased between 1969 to 1995, total energy intake decreased (from 2,105 kcal for 1969 to 1,839 kcal for 1995) [1112]. However, trends in energy intake and its nutrient and food sources have not been examined since 1998.
The objective of this study was to examine the trends in energy intake and its nutrient and food sources from 1998 to 2015 among Korean adults according to sex and age groups using data from the Korea National Health and Nutrition Examination Survey (KNHANES).

SUBJECTS AND METHODS

Study population

The KNHANES is a nationwide cross-sectional survey that has been used to assess the health and nutritional status of the non-institutionalized Korean population [12]. This surveillance system was initiated in 1998 as a triennial survey. In 1998 and 2001, surveys were performed in November and December, whereas the 2005 was conducted from April to June. In 2007, KNHANES was converted to an annual survey in order to provide timely health statistics for the Centers for Disease Control and Prevention and surveys are conducted all year round. Nationally representative households of the non-institutionalized Korean population for KNHANES were selected using a stratified multistage probability sampling design. The survey's target population includes all family members aged 1 year and older in the selected households.
The current study included data for subjects aged 19 years and over who completed the KNHANES nutrition survey. The KNHANES occurred in 1998 (KNHANES I), 2001 (KNHANES II), 2005 (KNHANES III), 2007-2009 (KNHANES IV), 2010-2012 (KNHANES V), and 2013-2015 (KNHANES VI). The study sample consisted of 70,769 persons (7,501 for 1998, 7,092 for 2001, 6,526 for 2005, 16,187 for 2007-2009, 17,394 for 2010-2012 and 16,069 for 2013-2015).
The KNHANES was approved by the institutional review board of the Centers for Disease Control and Prevention(2007-02CON-04-P, 2008-04EXP-01-C, 2009-01CON-03-2C, 2010-02CON-21-C, 2011-02CON-06-C, 2012-01EXP-01-2C, 2013-07CON-03-4C, and 2013-12EXP-03-5C) from 2007 to 2013.
Since 2014, the KNHANES has been exempted from review about research ethics based on Bioethics and Safety Act. Written informed consent was obtained from all participants since 1998.

Data collection

Health interview and examination

The KNHANES consists of a health interview, health examination, and nutrition survey. The health interview and health examination were conducted by trained medical staff and interviewers in a mobile examination center.
The health interview questionnaire included requests for information on socio-demographic features including household characteristics (e.g., education, occupational status, and household income) and health related behaviors (e.g., smoking, alcohol use, and physical activity). Data on physical activity have been collected since the 2005 KNHANES. Physical activity was defined as walking at least 10 minutes at a time, for 30 minutes or more per day, on 5 or more per days during the 7 days preceding the survey.
The KNHANES health examination obtained anthropometrical, biochemical and clinical information on diseases such as obesity, hypertension, and diabetes. Obesity was defined as a body mass index of ≥ 25 kg/m2 based on previously reported obesity criteria for the Asian population [14].

Nutrition survey and dietary assessment

The nutrition survey of KNHANES consisted of dietary habits, 1-day 24-hour recall, and food frequency questionnaire. The nutrition survey data were collected by trained dietitians in the homes of the participants one week after the health interview and health examination. The daily intake of energy was calculated using the Korean Foods and Nutrients Database of the Rural Development Administration [15161718]. The prevalence of insufficient or excessive energy intake was estimated by the estimated energy requirement (EER) for Koreans [19202122]. The EER for Koreans was applied differently by KNHANES year. The Recommended Dietary Allowances for Koreans (6th revision) [19] was used for 1998 data, the Recommended Dietary Allowances for Koreans (7th revision) [20] for 2001 data, the Dietary Reference Intakes for Koreans [21] for 2005 and 2007-2009 data, and the Dietary Reference Intakes for Koreans (1st revision) [22] for 2010-2015 data. Insufficient energy intake was defined as consumption of ≤ 75% of the Korean EER and excessive energy intake was defined as ≥ 125% of the Korean EER.
Food group assignments were based on the food grouping system in KNHANES, and some food groups (i.e., the principal food sources of energy) were divided into subgroups. Because of their importance in the Korean diet, the cereal and grain product food group was separated into white rice, whole grains, flour and its products, and rice products. In addition, non-alcoholic and alcoholic beverages were grouped separately from plant foods because they have higher energy densities than other foods.

Statistical analysis

We conducted our analyses using survey weighting that accounted for the complex survey design, which consisted of multistage, stratified, and clustered samples. Data analyses were performed using SAS 9.4 (SAS Institute Inc., Cary, NC, USA). The significance of trends was tested using linear regression (SAS, Proc surveyreg) for continuous variables and logistic regression (SAS, Proc surveylogistic) for categorical variables. Statistical significance of P for trend was ≤ 0.05.

RESULTS

The average ages of both men and women increased from 1998 to 2013-2015 (Table 1). In addition, the mean of household monthly income, percentage of respondents with a college diploma and higher, and percentage of non-manual workers increased during the same period. The prevalence of obesity has increased steadily in men (24.8% for 1998, 36.0% for 2007-2009, and 38.9% for 2013-2015). In contrast, over the 1998 to 2013-2015 period, the prevalence of obesity decreased slightly in women (26.9% for 1998 and 25.0% for 2013-2015). The percentage of subjects who engaged in physical activities, such as walking, decreased from 2005 to 2013-2015.

Trends in energy intake

Table 2 summarizes the trends in total energy intake among men and women from 1998 to 2013-2015. In men, the age-standardized mean intake of total energy significantly increased over time (2,196 kcal in 1998, 2,255 kcal in 2007-2009, and 2,489 kcal in 2013-2015), and this trend was consistent across all age groups. The percentages of men with an insufficient energy intake decreased from 36.9% to 24.4%, while, over the same period, the percentages of men with excessive energy intake increased from 14.2% to 25.5%. The increase in the proportion of subjects with excessive energy intake among men aged 30-69 years was larger than that of the other age groups. In women, the age-standardized mean intake of total energy showed a non-significant change over time, but there was a slight increase over the last three surveys (1,604 kcal for 2007-2009, 1,721 kcal for 2010-2012, and 1,790 kcal for 2013-2015). The prevalence of women with an insufficient energy intake was lower in 2013-2015 (33.8%) than in 1998 (37.6%), while the prevalence of women with excessive energy intake increased to 17.5% in 2013-2015 from 13.5% in 1998. However, decreasing trend of percentage of women with insufficient energy intake and the increasing trend of percentage of women with excessive energy intake were only significant in women aged 50-69 years.

Trends in the percentage of energy intake from the carbohydrate, fat, and protein

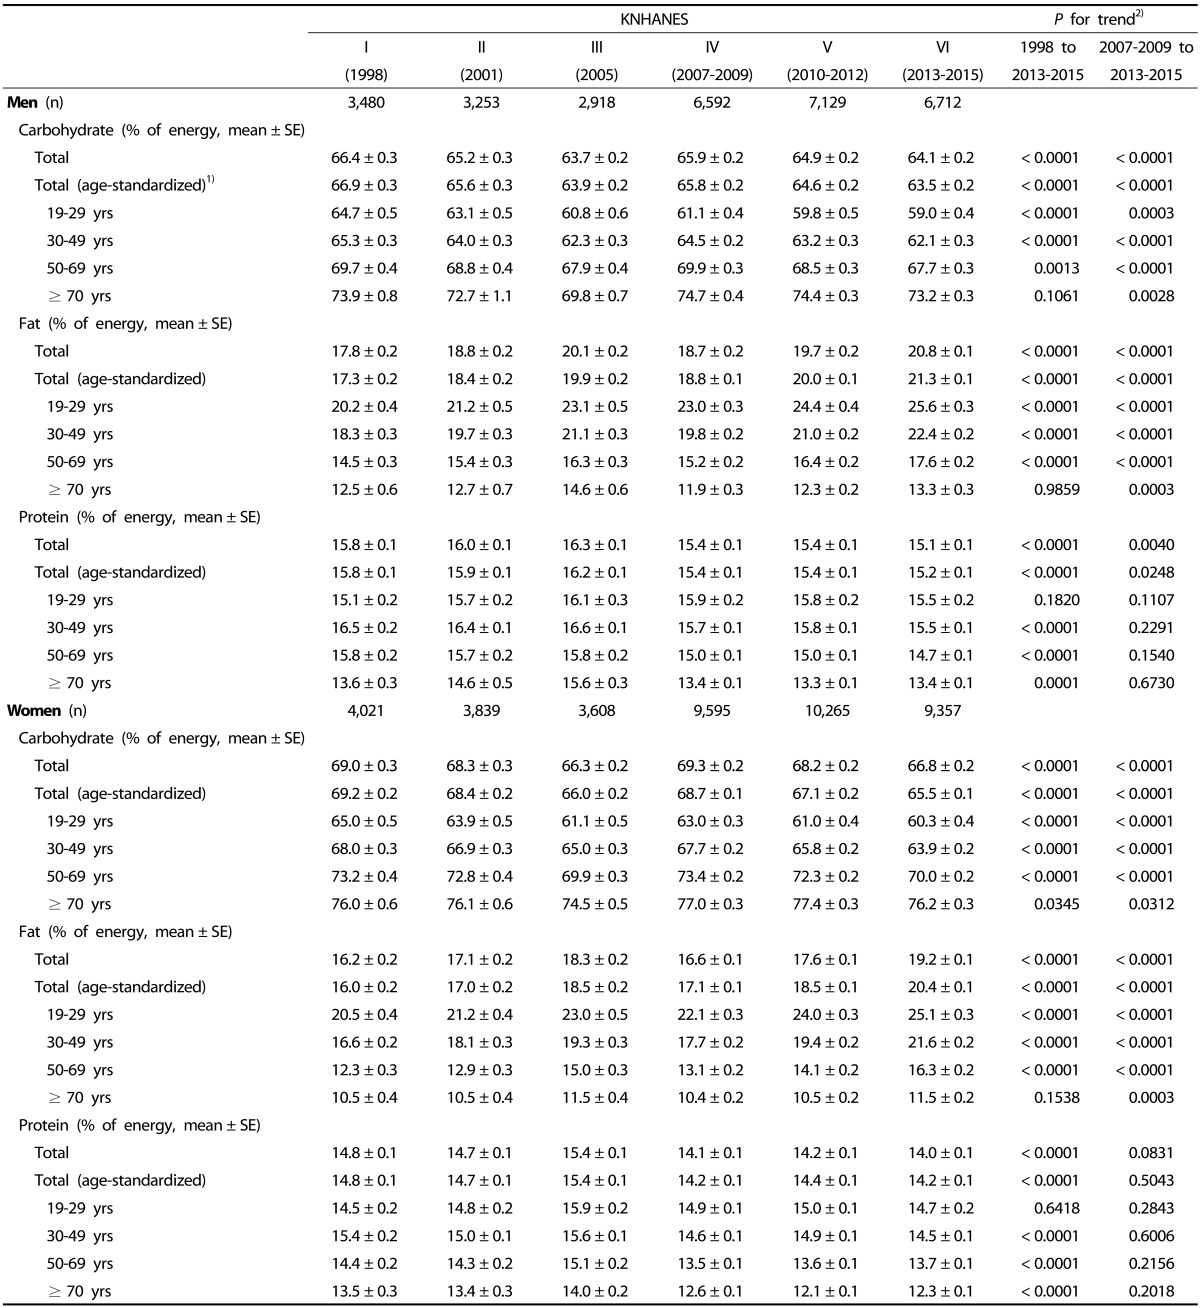
The percentage of energy intake from the carbohydrate decreased from 1998 to 2013-2015 in both men (66.9% for 1998, 65.8% for 2007-2009, and 63.5% for 2013-2015) and women (69.2% for 1998, 68.7% for 2007-2009, and 65.5% for 2013-2015) (Table 3). In contrast, the percentage of energy intake from fat increased during the same period (17.3% in 1998, 18.8% in 2007-2009, and 21.3% in 2013-2015 for men; 16.0% in 1998, 17.1% in 2007-2009, and 20.4% in 2013-2015 for women). In both sexes, these changes in the percentage of energy intake from carbohydrate and fat were consistent across all age groups, but the changes were greater in younger age groups than in older age groups. With the exception of men and women aged 19-29 years, the percentage of energy intake from protein decreased slightly in the other age groups, but significantly.

Trends in the food sources of energy intake

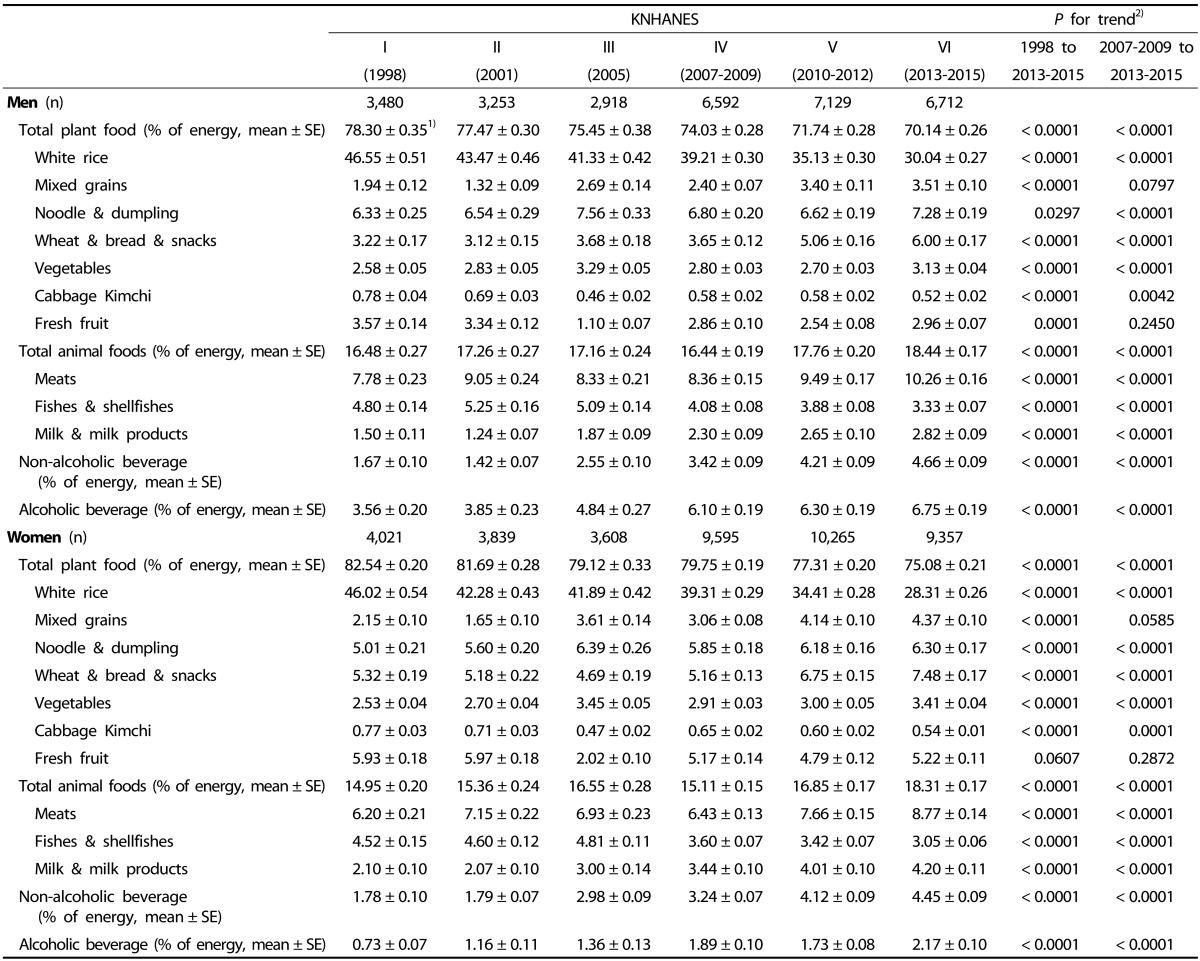
As shown in Table 4, the percentage of energy intake from the plant foods, including cereal and grain products, vegetables, and fruits, decreased steadily from 1998 to 2013-2015 in both men and women (78.3% in 1998, 74.0% in 2007-2009, and 70.1% in 2013-2015 for men; 82.5% in 1998, 79.8% in 2007-2009, and 75.1% in 2013-2015 for women). Within the plant foods, the most important source of total energy intake was white rice in both men and women. However, the percentage of energy intake from white rice decreased by 16.5% in men and by 17.7% in women from 1998 to 2013-2015. In contrast to white rice, the percentages of energy intake from mixed grains (e.g., barley and unpolished rice), noodles and dumplings, and wheat and its products (e.g., bread and snacks) continuously increased between 1998 and 2013-2015. The percentage of energy intake from cabbage Kimchi, a Korean traditional fermented vegetable, decreased in both men and women, while that of vegetables other than Kimchi increased. The percentage of energy intake from fresh fruit (except fruit juices) showed a slight, but significant, decrease in men only.
The percentage of energy intake from the animal foods was higher in 2013-2015 than in 1998 (16.5% in 1998 and 18.4% in 2013-2015 for men; 15.0% in 1998 and 18.3% for 2013-2015) (Table 4). During that same period, the percentage of energy intake from the milk and milk products among the animal foods showed the largest increases (a 1.9-fold increase in men and a 2.0-fold increase in women). The percentage of energy intake from non-alcoholic beverages, including fruit juice, sugar-sweetened beverages, and coffee, showed large increases between 1998 and 2013-2015 with a ≥ 2.0-fold increase in both men (1.7% for 1998, 3.4% for 2007-2009, and 4.7% for 2013-2015) and women (1.8% for 1998, 3.2% for 2007-2009, and 4.5% for 2013-2015). Furthermore, the percentage of energy intake from alcoholic beverages showed large increases from 1998 to 2013-2015 in both men (3.6% for 1998, 6.1% for 2007-2009, and 6.8% for 2013-2015) and women (0.7% for 1998, 1.9% for 2007-2009, and 2.2% for 2013-2015).

DISCUSSION

The present study describes the trends in energy intake and its nutrient and food sources among Korean adults based on the KNHANES data from 1998 to 2013-2015. In men, the daily energy intake increased from 1998 to 2013-2015, but there was no increase in women. However, the proportions of both men and women with insufficient energy intake decreased and the proportions of both men and women with excessive energy intake increased during the study period. Among the food sources of energy intake, the percentages of energy intake from animal foods, non-alcoholic beverages, and alcoholic beverages increased while the energy intake percentages from plant foods decreased during the study period in both men and women. At the same time, the percentage of energy intake from fat increased and the energy percentage from carbohydrate decreased.
In men, the increasing trends in total energy intake and proportions of subjects with excessive energy intake were consistent with the increasing trend in prevalence of obesity. In addition, the proportion of men who engaged in physical activity, such as walking, decreased from 2005 to 2013-2015. Despite the variety of factors that can affect obesity, the increase in the prevalence of obesity among men may be due, in part, to the increase of energy intake and the decrease of physical activity. In contrast, the results of the present study showing an increase in excessive energy intake among women were inconsistent with the absence of an increase in the prevalence of obesity in women. Previous reports on major cardiovascular disease risk factors, such as obesity, among Koreans have suggested that a decreasing tendency in prevalence of obesity among women may be related to the increases in participation in economic activities and a social preference for thinness, in addition to the change in energy intake [2324]. Further study on the effect of changes in energy intake and its food sources on the prevalence of obesity should be undertaken in Korean adults.
In this study, we observed that the trends in energy intake differed by sex and age group; however, the changes in food and the nutrient sources of energy intake were consistent among those groups. The percentage of energy intake derived from animal foods, such as meat and milk, and beverages including alcoholic drinks increased over the study period. In contrast, the percentage of energy intake derived from plant foods decreased, largely due to the marked decrease in the intake of white rice. Furthermore, changes in the food sources of energy intake are related to changes of the nutrient sources of energy intake, as demonstrated by the increases of energy intake from fat and animal foods and the decreases of energy intake from carbohydrate and plant foods. These trends are similar to those reported in other studies conducted in Korean adults [2526] and other Asian [67]. In Korea, socio-economic growth [2728] and socio-demographic changes, such as the increase in prevalence of single household [29] and decrease in the proportion of unemployed women (Table 1), have been observed. In conjunction with these changes, the general Korean population has increased a preference for convenience meals such as those from restaurants or delivery and take-out foods [3031]. Such changes in dietary habits may have led to the observed changes in food and nutrient sources associated with energy intake. In this study, the younger age groups showed lager changes in nutrient sources composition of their energy intake than those in the older age groups (Table 3), which may reflect a higher frequency of eating away from home among the younger age groups than that among the older age groups. Such changes in dietary habits may be related to the increase in energy intake among men over the study period.
Several studies have indicated that a high consumption of non-alcoholic and alcoholic beverages can contribute to an increase in energy intake because such beverages have a higher energy density than that in the other food groups [3233]. The current study showed that the increase in energy intake from beverages was greater than that from the other food groups, and the increase in beverage consumption contributed notably to the increased energy intake. When beverages were excluded from total energy intake, the proportion of men with excessive energy intake increased by 4.8% between 1998 and 2013-2015; however, when beverages were included, the proportion of men with excessive energy intake increased by 11.3%. In women, when beverages excluded, the proportion of women with excessive energy intake increased by 1.6% between 1998 and 2013-2015; however, when beverages were included, the proportion of women with excessive energy intake increased by 4.0% (data not shown).
The present study has several limitations. First, we used data from a 1-day 24-hour recall, which might not represent the usual intake. Thus, the proportions of insufficient and excessive energy intake may have been under- or over-estimated. However, the 24-hour recall method has been used as a usual method for assessing the mean intake of a population. Secondly, we used data from the KNHANES collected in different seasons. The 1998 and 2001 surveys were performed in autumn, the 2005 survey was performed in spring, and the survey for the 2007-2015 surveys were performed during all four seasons. In 2005, the low proportion of energy intake from fruits may have been due to the survey season (i.e., spring). Nevertheless, this study, based on nationally representative data, provides important insight into changes in energy intake and its nutrients and food sources trends among Korean adults over a 17 years period.
The results of this study suggest that since 1998, total energy intake has increased among Korean adult men, but not among women. Although the trends in total energy intake differed by sex, the composition of food sources of energy intake, such as the increases in the percentages of energy intake from animal foods and beverages, changed in both men and women. Furthermore, the changes in food sources of energy intake was related to the observed changes in nutrient sources of energy intake. Because the energy intake may be related to obesity and chronic disease, a continuous monitoring for energy intake and its nutrient and food sources is needed in Korean population.

Notes

CONFLICT OF INTEREST: The authors declare no potential conflicts of interests.

References

1. World Health Organization. Global strategy on diet, physical activity and health [Internet]. Geneva: World Health Organization;2004. cited 2016 November 2. Available from: http://apps.who.int/gb/ebwha/pdf_files/WHA57/A57_9-en.pdf?ua=1.
2. Institute for Health Metrics and Evaluation (US). GBD profile: South Korea [Internet]. Seattle (WA): Institute for Health Metrics and Evaluation;cited 2016 November 2. Available from: http://www.healthdata.org/sites/default/files/files/country_profiles/GBD/ihme_gbd_country_report_south_korea.pdf.
3. Popkin BM, Adair LS, Ng SW. Global nutrition transition and the pandemic of obesity in developing countries. Nutr Rev. 2012; 70:3–21. PMID: 22221213.
crossref
4. Ford ES, Dietz WH. Trends in energy intake among adults in the United States: findings from NHANES. Am J Clin Nutr. 2013; 97:848–853. PMID: 23426032.
5. Whitton C, Nicholson SK, Roberts C, Prynne CJ, Pot GK, Olson A, Fitt E, Cole D, Teucher B, Bates B, Henderson H, Pigott S, Deverill C, Swan G, Stephen AM. National Diet and Nutrition Survey: UK food consumption and nutrient intakes from the first year of the rolling programme and comparisons with previous surveys. Br J Nutr. 2011; 106:1899–1914. PMID: 21736781.
crossref
6. Tada N, Maruyama C, Koba S, Tanaka H, Birou S, Teramoto T, Sasaki J. Japanese dietary lifestyle and cardiovascular disease. J Atheroscler Thromb. 2011; 18:723–734. PMID: 21685707.
crossref
7. Zhai F, Wang H, Du S, He Y, Wang Z, Ge K, Popkin BM. Lifespan nutrition and changing socio-economic conditions in China. Asia Pac J Clin Nutr. 2007; 16(Suppl 1):374–382. PMID: 17392135.
8. Flood VM, Burlutsky G, Webb KL, Wang JJ, Smith WT, Mitchell P. Food and nutrient consumption trends in older Australians: a 10-year cohort study. Eur J Clin Nutr. 2010; 64:603–613. PMID: 20234384.
crossref
9. Ministry of Health and Welfare, Korea Centers for Disease Control and Prevention. Korea Health Statistics 2015: Korea National Health and Nutrition Examination Survey (KNHANES VI-3). Sejong: Korea Centers for Disease Control and Prevention;2016.
10. Swinburn BA, Caterson I, Seidell JC, James WP. Diet, nutrition and the prevention of excess weight gain and obesity. Public Health Nutr. 2004; 7:123–146. PMID: 14972057.
11. Kim S, Moon S, Popkin BM. The nutrition transition in South Korea. Am J Clin Nutr. 2000; 71:44–53. PMID: 10617945.
crossref
12. Sook M. Food consumption trends and nutrition transition in Korea. Malays J Nutr. 2003; 9:7–17. PMID: 22692528.
13. Kweon S, Kim Y, Jang MJ, Kim Y, Kim K, Choi S, Chun C, Khang YH, Oh K. Data resource profile: the Korea National Health and Nutrition Examination Survey (KNHANES). Int J Epidemiol. 2014; 43:69–77. PMID: 24585853.
crossref
14. World Health Organization Western Pacific Region. International Association for the Study of Obesity. International Obesity Task Force. The Asia-Pacific Perspective: Redefining Obesity and Its Treatment. Sydney: Health Communications Australia Pty Limited;2000. p. 18.
15. Rural Development Administration, National Rural Living Science Institute (KR). Food Composition Table. 5th rev. ed. Suwon: Rural Development Administration, National Rural Living Science Institute;1996.
16. Rural Development Administration, National Rural Living Science Institute (KR). Food Composition Table. 6th rev. ed. Suwon: Rural Development Administration, National Rural Living Science Institute;2001.
17. Rural Development Administration, Rural Resource Development Institute (KR). Food Composition Table. 7th rev. ed. Suwon: Rural Development Administration, Rural Resource Development Institute;2006.
18. Rural Development Administration, National Institute of Agriculatural Sciences (KR). Standard Food Composition Table. 8th rev.ed. Suwon: Rural development Administration, National Institute of Agriculatural Sciences;2012.
19. The Korean Nutrition Society. Recommended Dietary Allowances for Koreans. 6th rev. ed. Seoul: The Korean Nutrition Society;1995.
20. The Korean Nutrition Society. Recommended Dietary Allowances for Koreans. 7th rev. ed. Seoul: The Korean Nutrition Society;2000.
21. The Korean Nutrition Society. Dietary Reference Intakes for Koreans. Seoul: The Korean Nutrition Society;2005.
22. The Korean Nutrition Society. Dietary Reference Intakes for Koreans. 1th rev. ed. Seoul: The Korean Nutrition Society;2010.
23. Kim HJ, Kim Y, Cho Y, Jun B, Oh KW. Trends in the prevalence of major cardiovascular disease risk factors among Korean adults: results from the Korea National Health and Nutrition Examination Survey, 1998-2012. Int J Cardiol. 2014; 174:64–72. PMID: 24742812.
crossref
24. Rhee SY, Park SW, Kim DJ, Woo J. Gender disparity in the secular trends for obesity prevalence in Korea: analyses based on the KNHANES 1998-2009. Korean J Intern Med. 2013; 28:29–34. PMID: 23345994.
crossref
25. Lim H, Kim SY, Wang Y, Lee SJ, Oh K, Sohn CY, Moon YM, Jee SH. Preservation of a traditional Korean dietary pattern and emergence of a fruit and dairy dietary pattern among adults in South Korea: secular transitions in dietary patterns of a prospective study from 1998 to 2010. Nutr Res. 2014; 34:760–770. PMID: 25262419.
crossref
26. Jang HB, Lee HY, Han YH, Song J, Kim KN, Hyun T. Changes in food and nutrient intakes of college students between 1999 and 2009. Korean J Community Nutr. 2011; 16:324–336.
crossref
27. Statistics Korea. Korean social indicator: 2012 [Internet]. Daejeon: Statistics Korea;2013. cited 2015 July 27. Available from: http://kostat.go.kr/portal/korea/kor_nw/2/1/index.board?bmode=read&aSeq=306733.
28. Korea Food & Drug Administration. Food & Drug Statistical Yearbook: 2012 [Internet]. Cheongwon: Korea Food & Drug Administration;2012. cited 2015 July 27. Available from: http://rndmoa.mfds.go.kr:9010/stat/cop/bbs/selectBoardArticle.do?bbsId=BBSMSTR_000000000001&nttId=47&bbsTyCode=BBST01&bbsAttrbCode=BBSA03&authFlag=&pageIndex=1.
29. Statistics Korea. Korean social trends: 2012 [Internet]. Daejeon: Statistics Korea;2013. cited 2015 July 27. Available from: http://www.kostat.go.kr/portal/korea/kor_nw/2/1/index.board?bmode=read&aSeq=270115.
30. Park JH, Jang JB. An analysis of consumption structure in the ‘eating out of home’ sector [Internet]. Seoul: Korea Rural Economic Institute;2012. cited 2015 July 27. http://www.krei.re.kr/web/www/23?p_p_id=EXT_BBS&p_p_lifecycle=0&p_p_state=normal&p_p_mode=view&_EXT_BBS_struts_action=%2Fext%2Fbbs%2Fview_message&_EXT_BBS_messageId=200169.
31. Kwon YS, Ju SY. Trends in nutrient intakes and consumption while eating-out among Korean adults based on Korea National Health and Nutrition Examination Survey (1998-2012) data. Nutr Res Pract. 2014; 8:670–678. PMID: 25489407.
crossref
32. Gombi-Vaca MF, Sichieri R, Verly-Jr E. Caloric compensation for sugar-sweetened beverages in meals: a population-based study in Brazil. Appetite. 2016; 98:67–73. PMID: 26708263.
crossref
33. Park YS, Han JL, Kim SK, Kim C. Caloric intake to fat or alcoholic drink intake in middle-aged men is highly co-related than those in young men. J Korean Soc Food Sci Nutr. 2004; 33:679–686.
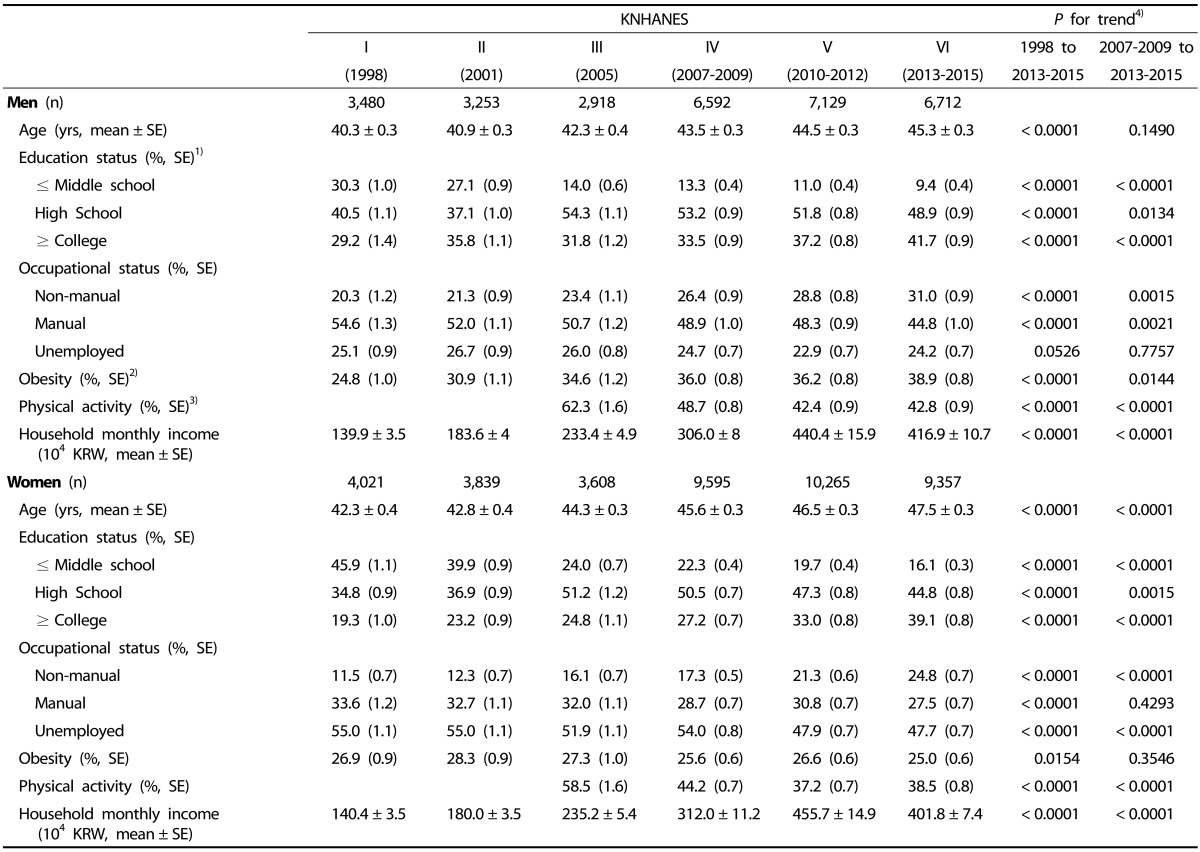
Table 1

General characteristics among Korean adults aged 19 years and over

nrp-11-147-i001

KNHANES, Korea National Health and Nutrition Examination Survey; KRW, South Korean won; SE, standard error.

1)Age-standardized mean ± SE or % (SE) values were calculated using age- and sex-specific structures of the estimated population in the 2005 Korea Census, except for average age.

2)Obesity was defined as a body mass index of ≥ 25 kg/m2.

3)Physical activity was defined as percentage of subjects who walked at least 10 minutes at a time, for 30 minutes or more per day, on 5 or more per days during the 7 days preceding the survey.

4)P for trend values were calculated using multivariate linear regression or logistic regression.

Table 2

Trends in energy intake and prevalence of subjects with insufficient or excessive intake of energy among Korean adults aged 19 years and over

nrp-11-147-i002

KNHANES, Korea National Health and Nutrition Examination Survey; SE, standard error.

1)Age-standardized means ± SE or % (SE) values were calculated using the age- and sex-specific structures of the estimated population in the 2005 Korea Census.

2)Insufficient energy intake was defined as less than 75% of the estimated energy intake requirement (EER).

3)Excessive energy intake was defined as more than 125% of the EER.

4)P for trend values were calculated using multivariate linear regression or logistic regression.

Table 3

Trends in percentage of total energy intake provided by carbohydrate, fat, and protein among Korean adults aged 19 years and over

nrp-11-147-i003

KNHANES, Korea National Health and Nutrition Examination Survey; SE, standard error.

1)Age-standardized means ± SE were calculated using the age- and sex-specific structures of the estimated population in the 2005 Korea Census.

2)P for trend values were calculated using multivariate linear regression.

Table 4

Trends in percentage of total energy intake provided by major food groups among Korean adults aged 19 years and over

nrp-11-147-i004

KNHANES, Korea National Health and Nutrition Examination Survey; SE, standard error.

1)Age-standardized means ± SE were calculated using the age- and sex-specific structures of the estimated population in the 2005 Korea Census.

2)P for trend values were calculated using multivariate linear regression after adjusting for age (continuous).

TOOLS
Similar articles