

 PDF
PDF ePub
ePub Citation
 Print
Print


INTRODUCTION
The ratio of older to younger people in the population has been increasing due to improvements in living conditions and advancements in medical techniques worldwide. According to the World Population Prospects Revision 2015 of the UN, the worldwide number of elderly people has increased by 8.2%, and the world has already changed into an aging society [1]. Older adults in Korea comprised 13.1% of the total population in 2015. As time progresses, it is expected that people aged over 65 years will increase to comprise 40.1% of the Korean population by 2060 [2]. According to the 2015 population statistics, the leading cause of death among elderly people is lifestyle-related diseases such as cancer, cardiovascular disease, and diabetes [2]. These statistics suggest we will have to cope with an increase in problems related to elderly people in Korea.
Adequate dietary intake in the elderly is necessary to help avoid lifestyle-related diseases [3]. Dietary habits of the elderly are affected by various factors including physiological, psychological, economic, and social conditions [45].
Oral problems such as oral pain, periodontal diseases, and missing teeth related to physiological changes can cause chewing difficulties [67], and these problems can directly influence dietary intake [89]. The function of chewing, the first step in moving food from the mouth to the gut [1011], is to produce a bolus and assist in swallowing food. By chewing food, one can reduce the digestive burden of the stomach and assist in absorption of nutrients. Therefore, poor chewing ability can induce gastrointestinal disorders in elderly people [12131415]. In addition, restrictions on the available food, as well as inappropriate dietary choices based on food that can be chewed easily may exacerbate imbalances in nutrient intake by reducing dietary quality. Individuals with chewing difficulties have been reported to have a less varied diet [16], and have been identified as people who tend to avoid hard-to-chew foods such as some meats, vegetables, and solid fruits. For this reason, malnutrition is more likely to occur in elderly people [17].
Malnutrition in elderly people can lead to a reduced lean body mass, a decrease in basal metabolic rate, and decreased body weight, and these conditions can contribute to a low quality of life and high morbidity and mortality [18]. Therefore, adequate nutrient intakes are important for the elderly to maintain an optimal and healthy life. The Korea Centers for Disease Control and Prevention in 2013 reported that the prevalence of chewing difficulty in Korea was approximately 10% in people aged in their 40s, over 30% in people in their 50s, and 49% in people over 65 years of age [19]. These results indicate that older people are more vulnerable to problems associated with chewing difficulties than those in other age groups. A study of French elderly living at nursing homes reported that, as chewing difficulty decreased by 10 points, the odds of malnutrition decreased by 15% [20]. Thus, chewing difficulty is a serious risk factor for malnutrition and a major factor in nutrition-related problems.
Previous studies conducted internationally have investigated the relationship between chewing difficulty and the nutritional status among elderly people, and it has been reported that the intake of nutrients decreases as chewing difficulties increase [141721]. In contrast, researchers in Korea have reported that chewing difficulty is related to one's health status and complex chronic diseases such as osteoarthritis [222324]. Although approximately 50% of Korean people aged 65 years and over have experienced chewing difficulties, there are few studies on the relationship between chewing difficulty and dietary consumption.
Therefore, the purpose of this study was to investigate socio-demographic factors and disparities in nutrient and food intake among elderly Koreans with chewing difficulty. The results of our study can be used as baseline data for developing health care and nutritional programs for elderly people with chewing difficulties.
SUBJECTS AND METHODS
Study population and design
This study utilized data from the 6th Korea National Health and Nutrition Examination Survey (KNHANES VI). People (n = 8,018) aged one-year-old and above participated in KNHANES VI. From that study, we included data for men and women aged 65 years and older who were not required to adhere to a special diet due to disease or sickness. As a result, 999 KNHANES VI participants (576 women and 423 men) aged 65 years and older, who had completed the health questionnaire survey, the health examination, and the nutrition survey (based on 24-hour recall), were included in this study.
Chewing difficulty was measured by using the health questionnaire results for those subjects who had difficulty chewing food due to tooth denture and gingivitis problems. The chewing difficulty variable was categorized as “very difficult”, “difficult”, “moderately difficult”, “easy”, and “very easy”. The subjects were divided into two groups according to their ability to chew food. The very difficult and difficult categories were combined to form the chewing difficulty group. Similarly, the moderate, easy, and very easy categories were combined to form the normal group. The study protocol was reviewed and approved by the Institutional Review Board of KNHANES VI (2013-07CON-03-4C).
Dietary intake assessment
Surveys of the intake of food and nutrients were completed by using the 24-hour recall method, which uses various measuring aids such as food models and measuring tools to assist the subjects to recall the name of the food and size of the portion they had eaten. Food groups were categorized into 18 items (cereals, potatoes, saccharides, pulses, nuts, vegetables, mushrooms, fruits, seaweed, beverages, seasonings, vegetable oils, other vegetables, meats, eggs, seafoods, milk/dairy products, and animal oils) based on the Standard Food Composition Table 8th Revision (2011) by the Rural Development Administration, National Institute of Agricultural Sciences [25]. Water intake was excluded because the dietary survey data were limited to recalling what people ate, not in what or how they cooked.
Nutrient intake was compared to Dietary Reference Intakes for Koreans 2015 (KDRIs). To determine a reference level for nutrient intake, energy was based on estimated energy requirements, whereas reference levels of protein, vitamin A, vitamin C, thiamin, riboflavin, niacin, calcium, phosphorus, and iron were based on recommended nutrient intake, and sodium and potassium levels were based on adequate intake.
General characteristics
The study's socio-demographic variables included age, gender, residential area, beneficiary of basic livelihood or not, and education level. Age groups were classified as 65-74 years of age and over 75 years of age, while education level was classified as elementary school or less, middle school, high school, and college or more. Residence type was classified as urban or rural. For classification of the income level variable, data on beneficiary of basic livelihood or not was used.
Statistical analyses
All statistical analyses were conducted by using SPSS 19.0 Ver. (2010, International Business Machines, Armonk, NY, USA). As KNHANES VI collected data via a complex sample design, a variety of weights, stratification variables, and clusters were applied to avoid biased results. The weights were based on inverted selection probabilities, and inverted response rates in the results were modified by adjusting them according to the gender, age, health, and nutrition survey as submitted by the participants. Age, gender, and energy intake variables were adjusted according to data characteristics. The associations between chewing ability and socio-demographic variables were tested by applying the chi-square test. We conducted complex sample general linear models (CSGLM) to assess mean differences in food group and nutrient intakes between the normal and chewing difficulty groups. CSGLM were employed to calculate age- and gender-adjusted means and standard errors (SE) of the mean for each food group and nutrient intakes in Model 1, whereas in Model 2, age-, gender-, and energy intake-adjusted data were used. The significance threshold was set at a P of 0.05.
RESULTS
General characteristics
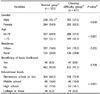
The general characteristics of the study participants are presented in Table 1. The number of subjects was 999, and 52.3% of the subjects (n = 522) had no chewing difficulties, whereas 47.7% (n = 477) had chewing difficulties. Among the normal group, 45.1% were male and 54.9% were females. In the chewing difficulty group, males comprised 37.5% and females 62.5%. There was a significantly high percentage of females in the chewing difficulty group (P = 0.030). With regard to age, the percentage of subjects with chewing difficulty was significantly higher in the over 75 years of age group than in the 65-74 years of age group. The normal group had 64.9% of its members aged 65-74 years compared to 57.5% aged 65-74 years in the chewing difficulty group, whereas 42.5% of the chewing difficulty group and 35.1% of the normal group were over 75 years of age (P < 0.001).
With regard to residence location, 74.0% of the normal group and 70.2% of the chewing difficulty group were urban residents, and the difference was not significant. Within the chewing difficulty group, 8.8% were beneficiaries of basic livelihood, whereas 8.0% were basic livelihood beneficiaries in the normal group, and the difference was not significant. Regarding educational levels, 75.9% were educated at the elementary school or less level in the chewing difficulty group while 60.3% of those in the normal group received that same education level. The chewing difficulty group had a significantly lower educational level than that in the normal group (P < 0.001).
Food group intakes
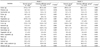
Table 2 shows the results of the daily food group intake analysis for the two chewing groups. Model 1 was adjusted for age and gender while Model 2 was adjusted for age, gender, and energy intake. Both models revealed that, compared to the normal group, the chewing difficulty group ate significantly lower amounts of fruits and vegetables. The Model 1 results showed that the chewing difficulty group consumed 132.8 g of fruits and 295.9 g of vegetables, whereas the normal group consumed 175.0 g of fruits and 357.8 g of vegetables (P = 0.014 and P = 0.001, respectively). Moreover, Model 2 results showed that the normal group consumed 169.4 g of fruits and 350.0 g of vegetables, whereas the chewing difficulty group consumed 133.7 g of fruits and 297.1 g of vegetables (P = 0.025 and P = 0.004, respectively). Model 2 also showed a significant difference in the intake of beverages between the two groups (P = 0.016). Although no statistically significant differences were detected in the other variables in Model 1 or Model 2, there were tendencies indicating that the intake of potatoes, pulses, meats, seafood, and seasoning were higher in the normal group than in the chewing difficulty group.
Nutrient intakes
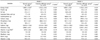
The nutrient intake analysis results related to chewing difficulty are summarized in Table 3. The Model 1 results include adjustments for age and gender, whereas Model 2 results include adjustments for age, gender, and energy intake. The chewing difficulty group had a significantly lower intake of vitamin C and potassium than those in the normal group in both Model 1 and Model 2 (P < 0.05).
In Model 1, significant differences (P < 0.05) were observed between the chewing difficulty group and the normal group for fat (24.3 g vs. 27.2 g), carbohydrates (301.3 g vs. 319.1 g), vitamins and minerals such as thiamin (1.8 mg vs. 1.9 mg), niacin (12.1 mg vs. 13.2 mg), vitamin C (77.0 mg vs. 95.6 g), calcium (397.9 mg vs. 446.7 mg), phosphorus (880.2 mg vs. 951.7 mg), and potassium (2,516.8 mg vs. 2,808.7 mg). In Model 2, significant differences (P < 0.05) were detected in the intake of potassium (2,529.1 mg vs. 2,727.9 mg) and vitamin C (77.4 mg vs. 93.0 mg). While there were no significant differences in other variables, the chewing difficulty group tended to intake less energy, iron, sodium, and vitamin A than those intakes in the normal group.
Nutrient intakes as a percentage of KDRIs indicators
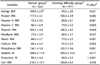
Table 4 shows the levels of nutrient intake in the two groups and in comparison to the 2015 KDRIs. The differences in the level of nutrient intake are expressed as differences (as a percentage) from the KDRIs indicator values between the normal and chewing difficulty groups. There were significant intergroup differences (P < 0.05) in the nutrient intake levels of energy (100.9% vs. 94.5%), vitamin C (96.3% vs. 73.9%), thiamin (164.3% vs. 148.5%), riboflavin (77.8% vs. 69.9%), niacin (88.0% vs. 77.6%), calcium (60.4% vs. 51.0%), phosphorus (136.1% vs. 120.7%), sodium (296.6% vs. 259.5%), potassium (80.4% vs. 69.5%) and iron (218.7% vs. 183.8%). In particular, the intake levels of vitamin C, riboflavin, niacin, and potassium were about 70% of the KDRIs, and, in the case of calcium, the intake was only 51% of the KDRIs in the chewing difficulty group. In particular, it was revealed that the chewing difficulty group ingested very low calcium.
DISCUSSION
Although physical changed in the elderly are inevitable, an adequate dietary intake is an important determinant in one's quality of life. It has been reported that most elderly experience a decrease in digestive juices and oral problems such as gingivitis, missing teeth, and a diminished sense of taste, and these factors can contribute to nutritional deficiencies in older people [18]. The objective of this study was to assess the effect of chewing difficulty on food and nutrient intakes of the elderly.
In the KNHANES VI 2013 data, the percentage of elderly Koreans with chewing difficulty was 47.7%, which was lower than the 2009 results (56.6%) but higher than the results in the 2012 report (46.6%) [19]. These results suggests that approximately one in two elderly Koreans experience chewing difficulty. Thus, chewing difficulty problems in the elderly should not be overlooked when considering the health of the elderly.
Among our KNHANES VI study participants, there was a greater percentage of females (62.5%) than males (37.5%) in the chewing difficulty group. Previous studies have reported that menopause in women was associated with oral problems, including a shortage of saliva, increased tooth decay, atrophic gingivitis, and periodontitis [26]. In addition, menopause could induce tooth loss because estrogen deficiency leads to bone loss and enhances the rate of breakdown of connective tissue leading to gingivitis and other oral diseases [2728]. Therefore, women can be exposed to greater levels of periodontal disease and tooth loss than that in men. Based on the study results, it is evident that women can experience more chewing difficulty than men.
Our results also indicated that chewing difficulty was associated with aging and a low education level. Age-related changes in tooth loss can occur and can contribute to chewing difficulty [2930]. Borrell and Crawford [31], using 1999-2004 NHANES data, reported that the education and income levels of people with periodontal disease were relatively low. These previous study results are supported by the results of our study, which indicated that the chewing difficulty group had lower levels of education and income. Those with lower education and income are more likely to have difficulty in chewing because they have had less opportunity to be educated concerning oral health; moreover, they are vulnerable to tooth loss due to financial problems related to obtaining oral care.
The intakes of foods and nutrients in the chewing difficulty group were significantly lower than those in the normal group in the results of both Model 1 and Model 2. Kagawa et al. [32] showed that elderly Japanese study participants with poor masticatory ability had significant associations with shortages of meat, green and yellow vegetables, other vegetables, and fruit intake. Those results are consistent with those in our study, which showed that the chewing difficulty group consumed less fruits and vegetables than that in the normal group. The Model 2 results indicate that the chewing difficulty consumed a greater amount of beverages than that consumed in the normal group. Beverages are a food group that elderly people with chewing difficulty can easily consume. Based on the observed differences in food and nutrient intakes, elderly people with chewing difficulty are likely to have an unbalanced diet and unhealthy eating habits, possibly leading to degenerative diseases. Therefore, it is necessary to develop nutrition management strategies that consider chewing difficulty.
In comparison to the 2015 KDRIs, the levels of nutrient intake, calculated as a percentage of the KDRIs, differed between groups. However, both groups exhibited a notably deficient intake of calcium. Moreover, the intake of energy, vitamin C, thiamin, riboflavin, niacin, calcium, phosphorus, sodium, potassium and iron in the chewing difficulty group were lower than those of the normal group. According to KNHANES VI results, the major food groups contributing to these nutrients are vegetables, fruits, and meats in the Korean population [19]. However, elderly people in the chewing difficulty group consumed lower amounts of fruits, vegetables, and meats (which can be hard-to-chew) than that consumed in the normal group. Thus, it may be assumed that chewing difficulty among the elderly might lead to lower intakes of vitamin C, riboflavin, and potassium. Similarly, Mann reported that average intakes of calcium, potassium, and vitamins were about 45% of the KDRIs in subjects with chewing or swallowing problems [33]. Moreover, a lack of micronutrients such as iron, zinc, and vitamin C can result in burning mouth syndrome, atrophic mucosa, and a weakened immune status [21]. Thus, chewing problems should not be regarded as only related to malnutrition, as chewing difficulties can also affect the immune system.
Fat and saturated fat intakes in the normal group were significantly higher (P < 0.05) than those in the chewing difficulty group. These results are similar to those of Cousson in France, who reported that the control group with no chewing difficulty had a greater fat intake than that in their chewing difficulty group [34]. In contrast, Hung et al. [35] suggested that edentulous US women had a significantly high intake of saturated fat, trans-fat, and cholesterol. Moreover, women with few teeth were more likely to change their diet to a less nutritious one. This discrepancy between study results may be related to the variety of dietary patterns and dietary cultures in each country. Regardless, the relationship between chewing difficulty and intake of fat and saturated fat remains unclear.
Both of our study groups consumed more than the recommended levels of thiamine, phosphorus, and iron. Cereals and meats are thought to mainly contribute these nutrient types in the Korean diet. However, the results in our study showed a lower intake of meats, about 65 g lower than the average intake of meats (150.0 g) in Korea. Thus, the results showing high levels of thiamine, phosphorus, and iron have been attributed to the increase in the intake of cereals in our study groups. Although there was a lower consumption of meat in the chewing difficulty group, the meat consumption in the two groups was not significantly different. This similarity may indicate that some Korean elderly with chewing difficulty are trying to chew. In addition, Korean traditional cooking typically use a cooking method that adds moisture, and the purpose of that cooking method is to make meat soft and easy to eat. We speculate that such tendencies are reflected in our results.
Sodium intakes were considerably high; double or triple the recommended level, in both the normal (296%) and chewing difficulty (259%) groups (P = 0.011). Worldwide, many adult populations have mean sodium intakes that are above the quantity needed on a daily basis [36]. Moreover, the traditional Korean diet is more likely to have a high intake sodium because of the frequent consumption in Korea of kimchi and seasoned vegetables, which are major contributors of dietary sodium intake [37]. In addition, elderly people tend to intake salty stews and soups more frequently than younger adults [38].
Our study showed that the calcium intake of the chewing difficulty group was about 50% of the recommended intake level. Moreover, the level of calcium intake in both the chewing difficulty and normal groups were low (51% and 60%, respectively, of the KDRIs). Calcium is a component of bone and teeth, and an adequate calcium intake may improve enamel re-mineralization and preserve alveolar bones [39]. Consequently, to prevent oral problems, calcium intake is essential for elderly people who are vulnerable to disease. Elderly Koreans have reported that they consume milk and dairy products less frequently than other age groups [19], and this appears to be the main reason for the low calcium intake observed in our study. Regardless, it is important for the elderly to intake an appropriate amount of calcium. This is particularly important in Korean middle-aged and elderly people who do not consume milk and dairy products because of lactose intolerance. It is recommended that lactose intolerant elderly consume lactose-free milk and other non-dairy products. In addition, a connection between sodium intake and high blood pressure and other cardiovascular diseases has been widely reported. To reduce the incidence of such diseases and conditions, the eating habits of elderly people who do not consume the recommended intake of calcium should be improved. Moreover, this study revealed that chewing difficulty can result in an unbalanced intake of nutrients; especially for foods rich in fiber, vitamins, and minerals. This can lead to a rise in morbidity related to immunologic diseases in the elderly. The development of food and nutrition management programs is needed for elderly people with chewing difficulties to prevent osteoporosis and various diseases that are associated with an unbalanced diet.
In Japan, where the elderly portion of the population is the highest in the world, a universal design food program was created in which processed foods are classified according to the degree of texture for the elderly [4041]. Moreover, researchers insist that it is necessary for elderly with chewing difficulties to be educated about dietary intake [42]. These studies in Japan demonstrate the necessity of developing of food consumption recommendations for the elderly with chewing difficulties. In another study in Japan, the authors reported that subjects with chewing difficulty consumed higher amounts of food after they were given minced and blended diets; moreover, their satisfaction levels increased [43]. Korea is a rapidly aging society, like that in Japan, and various customized programs associated with oral health status and improving dietary intakes are needed.
This study has certain limitations. First, due to the limited data collected through the 24-hour recall method, we could not address the usual daily intake amounts of the subjects. As the study was based on data from KNHANES VI, we could only estimate the average daily intake of the Korean elderly population for a 24 hour period. Second, since chewing difficulty status was determined by the subjective judgment of the participants, not by professional discernment, there could be differences in individual interpretation of chewing difficulty. In future research, it will be necessary to more objectively define chewing ability. Finally, in this research, there was a limitation in our ability to describe the intake of particular foods in detail as there were no data available on cooking methods.
To summarize our results, the chewing difficulty group had significantly lower intakes of fruits and vegetables than those in the normal group, and the ingestion of vitamin C and potassium associated with the intake of these food groups were also lower. In contrast, although the intake of grains, meats, and dairy products was not significantly different between the two groups, there were tendencies indicating that the consumptions of grains, meats, and dairy products were lower in the chewing difficulty group than in the normal group. Also, intakes of calories, fats, and proteins related to these food groups showed a tendency to lower intake in the chewing difficulty group than in the normal group. The lack of significant differences between groups may be due to the large standard errors in the intake of these food groups.
In conclusion, nutrition-related problems in the elderly appear to be aggravated by chewing difficulties. Because people with chewing difficulties have a lower nutrient intake than people without chewing difficulties, it is imperative that individuals with chewing difficulties maintain an adequate nutrient intake. In particular, female elderly and people over 75 years of age are more vulnerable to chewing difficulties. The elderly should be intensively cared for by developing systematically devised nutritional programs that are based on scientific research. Specially devised foods for the elderly should be developed in order to provide them with supplemental nutrients such as protein, fiber, and calcium. Also, further research into the relationships between various chronic diseases and chewing difficulties is needed.
 XML Download