Journal List > Nutr Res Pract > v.11(2) > 1050866

Yoon, Tammen, Park, Han, and Choi: Genome-wide hepatic DNA methylation changes in high-fat diet-induced obese mice

Abstract

BACKGROUND/OBJECTIVES

A high-fat diet (HFD) induces obesity, which is a major risk factor for cardiovascular disease and cancer, while a calorie-restricted diet can extend life span by reducing the risk of these diseases. It is known that health effects of diet are partially conveyed through epigenetic mechanism including DNA methylation. In this study, we investigated the genome-wide hepatic DNA methylation to identify the epigenetic effects of HFD-induced obesity.

MATERIALS AND METHODS

Seven-week-old male C57BL/6 mice were fed control diet (CD), calorie-restricted control diet (CRCD), or HFD for 16 weeks (after one week of acclimation to the control diet). Food intake, body weight, and liver weight were measured. Hepatic triacylglycerol and cholesterol levels were determined using enzymatic colorimetric methods. Changes in genome-wide DNA methylation were determined by a DNA methylation microarray method combined with methylated DNA immunoprecipitation. The level of transcription of individual genes was measured by real-time PCR.

RESULTS

The DNA methylation statuses of genes in biological networks related to lipid metabolism and hepatic steatosis were influenced by HFD-induced obesity. In HFD group, a proinflammatory Casp1 (Caspase 1) gene had hypomethylated CpG sites at the 1.5-kb upstream region of its transcription start site (TSS), and its mRNA level was higher compared with that in CD group. Additionally, an energy metabolism-associated gene Ndufb9 (NADH dehydrogenase 1 beta subcomplex 9) in HFD group had hypermethylated CpG sites at the 2.6-kb downstream region of its TSS, and its mRNA level was lower compared with that in CRCD group.

CONCLUSIONS

HFD alters DNA methylation profiles in genes associated with liver lipid metabolism and hepatic steatosis. The methylation statuses of Casp1 and Ndufb9 were particularly influenced by the HFD. The expression of these genes in HFD differed significantly compared with CD and CRCD, respectively, suggesting that the expressions of Casp1 and Ndufb9 in liver were regulated by their methylation statuses.

INTRODUCTION

Obesity can lead to serious health consequences. Increasing evidence suggests that obesity has been recognized as a global health concern. In 2010, overweight and obesity were estimated to cause 3.4 million deaths (95% UI 2.8 million to 4.0 million deaths) and 3.8% (3.1 to 4.4%) of disability-adjusted life years (93.6 million years, 77.1 million to 110.6 million years) globally [1]. The perils of obesity may lie in its association with non-communicable diseases, including cardiovascular disease, diabetes, and cancers.
Genetic, environmental, and dietary factors contribute to the development of obesity. Among dietary risk factors, an energy-dense diet that is often represented by high-fat diet (HFD) is one of the main causes of obesity. Diet-induced obesity has been shown to induce metabolic syndrome (generally implicated in glucose intolerance, hypertension, and dyslipidemia) and nonalcoholic fatty liver disease (NAFLD, hepatic manifestation of obesity and metabolic syndrome) [23]. Because liver is a critical organ for the metabolisms of glucose and triacylglycerol, liver tissues have been often used to elucidate the molecular and pathophysiological mechanisms of the metabolic disruptions associated with obesity. Thus far, studies have shown that obesity and metabolic syndrome are associated with increased hepatic fat (triacylglycerol) content and insulin resistance [4]. Moreover, the overproduction of inflammatory markers, such as plaminogen activator inhibitor-1, interleukin-6, and tumor necrosis factor, has been observed with obesity [567].
Epigenetics is defined as a reversible and heritable change that affects gene expression without altered DNA sequence. With advances in epigenetic tools and technologies, attempts have been made to uncover the epigenetic mechanisms underlying metabolic disruption and chronic inflammation in the liver caused by diet-induced obesity. Particularly, the effects of nutrition on DNA methylation, a major epigenetic mechanism, have been extensively investigated [8]. A differential methylation in the promoter of hepatic leptin has been suggested as a cause of lower circulating leptin level in HFD-induced obese rats [9]. The decreased expression of glycolysis related Gck (glucokinase) and L-PK (L-type pyruvate kinase) genes in liver was associated with the DNA hypermethylation in HFD-induced obese rats [10]. Genes related to hepatic lipid metabolism including Scd1 (stearoyl-CoA desaturase 1) [11] and Mttp (microsomal triglyceride transfer protein) [12] were also hypermethylated in response to HFD, resulting in decreased expression of these genes. Maternal HFD during pregnancy and lactation led to CpG island hypomethylation of the cell cycle-related Cdkn1a gene in the livers of the offsprings, which was inversely correlated with its mRNA expression, suggestive of hepatic dysfunction in these offsprings [13]. However, regarding HFD-induced changes in hepatic DNA methylation, genome-wide analysis using high-throughput methods is limited and majority of previous studies have investigated DNA methylation in gene-specific way. In a study that examined the impact of HFD on genome-wide hepatic DNA methylation, animals were exposed to HFD from conception onward into adulthood [14]. DNA methylation patterns are established during prenatal and early postnatal period and generally persist through adulthood. However, exposure to factors influencing methylation patterns accumulates throughout life and such methylation changes are observed during aging [15]. Therefore it is necessary to look into the influence of HFD during adulthood on DNA methylation as well.
In this study, using a combination of high-throughput DNA methylation array method, bioinformatics analysis and real time PCR, we examined the changes in genome-wide DNA methylation patterns associated with HFD-induced obesity and determined that these DNA methylation changes influenced gene expression.

MATERIALS AND METHODS

Animals and diets

Seven weeks old male C57BL/6N mice were purchased from Central laboratory Inc. (Seoul, Korea). On arrival, all mice were housed individually at constant temperature (25 ± 4℃) with a 12-h light/12-h dark cycle and were fed a control diet (CD; #D12450B, Research Diets, New Brunswick, NJ, USA; 10% fat, 70% carbohydrate, and 20% protein in kcal%; 3.85 kcal/g) ad libitum for a week. After a week of acclimation period, mice were assigned to one of three groups, each according to similar average initial body weights: control diet (CD, n = 7) group, calorie-restricted control diet (CRCD, n = 7) group, and high-fat diet (HFD; #D12492, Research Diets, New Brunswick, NJ, USA. high-fat diet; 60% fat, 20% carbohydrate, and 20% protein in kcal%; 5.24 kcal/g, n = 7) group. The composition of diets is presented in Table 1. CD and HFD mice were fed diets ad libitum while CRCD mice were provided the same amount of control diet as HFD animals ate. Daily food intake and body weight were recorded. At the end of 16 weeks of the experimental period, mice were fasted for 12 hours and then euthanized with CO2 asphyxiation. Their livers were collected and weighed. Portions of each liver were either flash frozen in liquid nitrogen or stored at -80℃ until further analysis or embedded in paraffin and stained with hematoxylin and eosin for histology. All animal protocols in this study were approved by the Institutional Animal Care and Use Committee of Seoul National University (Approval No. SNU-090710-1).

Determination of hepatic lipid levels

Total hepatic lipids were extracted using a modified Folch extraction procedure [16]. Briefly, each liver sample was homogenized in phosphate buffered saline and the lipids were extracted with chloroform-methanol (2:1, v/v) solution. Triacylglycerol and cholesterol levels were determined using an enzymatic colorimetric kit (Asan Pharm Co., Ltd, Seoul, Korea) according to the manufacturer's protocol.

DNA methylation microarray

Genomic DNA was extracted using the standard phenol/chloroform/isoamyl alcohol method (25:24:1, v/v/v; Invitrogen Life Technologies, Grand Island, NY). DNA was precipitated with 100 % ethanol and 3 mol/L sodium acetate (pH 5.2) and re-dissolved in Tris-EDTA buffer. It was then randomly fragmented to 200-1,000 bp in length by sonication. Each DNA sample was divided into two parts, and one half underwent immunoprecipitation with an antibody (AF-110-0016, Diagenode, Denville, NJ) against methylated cytosine (MeDIP) [17]. MeDIP and non-MeDIP (input) DNAs were amplified by whole genome amplification kit (WGA2, Sigma-Aldrich, St. Louis, MO) as per the manufacturer's instructions.
Immunoprecipitated DNA and input DNA were fluorescently labeled (Cy5 and Cy3 dyes) using Roche Nimblegen kit (6370250001 & 558368300, Roche NimbleGen Inc, Madison, WI) and competitively hybridized to a high-throughput NimbleGen 3x720k CpG Island plus RefSeq promoter array (5924537001, Roche NimbleGen Inc, Madison, WI) containing probes for all known gene promoters, and CpG islands in the mouse genome. NimbleGen microarray scanner MS 200 (Roche NimbleGen Inc.) was used to detect signals, followed by the log2 ratio calculation between immunoprecipitated and input signals with the NimbelScan software (version 2.5; Roche NimbleGen Inc., Madison, WI) to identify enrichment.

Searching for differentially methylated regions (DMRs)

The comprehensive high-throughput array for relative methylation (CHARM) method [18] in R studio was used for the analysis of our MeDIP DNA methylation arrays, with modifications used in previous study [19]. Briefly, between groups, if probes had a t-test P-value < 0.01 and mean difference in log2 ratio > 0.5, they were considered differentially methylated probes (DMP). Thereafter, regions of genomically neighboring probes that had a between-group t-test P-value < 0.005 were identified to analyze our MeDIP DNA methylation arrays between different comparisons. The CHARM package is freely available open software program from Bioconductor (http://bioconductor.org/packages/release/bioc/html/charm.html).

Annotation of DMRs

After DMRs for each diet comparison was determined, regions were annotated to the nearest genes using Genomic Regions Enrichment of Annotations Tool (GREAT) [20]. This tool uses UCSC mm9 mouse genome to annotate chromosomal regions to their nearest genes [21]. For this study, if a region falls within a range of 5.0-kb upstream or 1.0-kb downstream of the gene's transcription start site (TSS), it was assigned to that gene (regardless of other nearby genes). Curated regulatory domains, which fall outside of the aforementioned region but have experimental evidence of directly regulating a gene, were also perceived to be associated with that gene.

Ingenuity Pathway Analysis

After DMRs were annotated to the genes, genes which showed significant differences in DNA methylation between the study group (HFD) and the control groups (CD and CRCD) underwent Network analysis using Ingenuity Pathway Analysis (IPA) (Ingenuity® Systems, http://www.ingenuity.com) to identify top molecular functions associated with HFD mice methylome. Network analysis of IPA performs a Fisher's exact test to generate de novo molecular networks based upon user-specified input data. P-values calculated by Fisher's exact tests determine the significance of the enriched network, deriving a Network score.

Quantification of gene expression

mRNA levels of genes selected from network analysis were measured using real time PCR.
Genes of interest were selected based on the following steps: First, genes of interest should be in a network with the highest network score. Secondly, genes in the network chosen should be evidenced by previous papers that they were likely to be involved in the top diseases and functions indicated by the IPA network analysis result. This step was important because some of the genes in the networks were better known for functions and diseases other than the ones revealed by IPA. Thirdly, among those genes that passed the second step, Casp1 and Ndufb9 were the ones that showed greatest differences in methylation levels between HFD vs. CD and HFD vs. CRCD, respectively. Therefore, we chose Casp1 and Ndufb9 to be our genes of interest in HFD vs. CD and HFD vs. CRCD comparisons, respectively.
Total RNA was extracted from the liver using RNAiso Plus (Takara Bio), and RNA sample quality was verified by agarose gel electrophoresis and Gel Doc XR system (Bio-Rad Laboratories). The absorbance at 260 nm and 280 nm was measured using a spectrophotometer (DU530, Beckman Coulter) for RNA purity assessment and concentration quantification. Each RNA extract was then reverse transcribed to cDNA (PrimeScriptTM II 1st strand cDNA synthesis kit, Takara Bio). Gene expression was determined in a StepOneTM Real-time PCR system (Applied Biosystems) using ROX reference dye (Takara Bio) and SYBR Premix (Takara Bio). Target gene expression was normalized to that of the endogenous control glyceraldehyde 3-phosphate dehydrogenase (Gapdh) and the relative quantification (2-ΔΔCT) method [22] was used to determine the relative expression level of the target genes, using Gapdh as the internal control. The sequences of the primers used are shown in Table 2.

Statistical analysis

Differences in body weight, diet intake, liver weight, hepatic lipid levels, and gene expression were analyzed by one-way ANOVA using SAS version 9.3 (SAS Institute, Cary, NC, USA), followed by Fisher's Least Significant Difference (LSD) test for individual group comparison. P < 0.05 was considered statistically significant. The results are presented as means ± SEM.

RESULTS

Body weight, weight gain, Liver weight, and food intake

Average food intake (g/day) was 13.7% lower in the HFD group compared with the CD group. However, the average daily energy intake (kcal/day) was 17.4 % higher in the HFD than in the CD groups. The CRCD group's average daily energy intake (kcal/day) was 15.3% lower than that of the CD group. After 16 weeks of experiment, there were significant differences in body and liver weights among groups, the HFD group had the highest body and liver weights and the CRCD group had the lowest (Table 3).

Hepatic lipid levels

Liver triacylglycerol and cholesterol levels were significantly different among groups (Table 4). The liver triacylglycerol levels of the HFD and CD groups were significantly higher than those of the CRCD group. The liver cholesterol levels of the HFD group were significantly higher compared with those of the CD (78.1% higher in mg/g tissue, 82.1% higher in µg/mg protein) and CRCD (720.6% higher in mg/g tissue, 155.2% higher in µg/mg protein) groups.

Genome-wide DNA methylation

Three comparisons were performed for DNA methylation analysis: HFD vs. CD, HFD vs. CRCD, and CD vs. CRCD. To organize microarray measurements in a heat-map matrix, all probes from the microarray with a difference in log2 ratio > 0.5 and a t-test P-value < 0.01 were used. The heat maps between CD and CRCD did not show significant differences. On the other hand, the heat maps between HFD and CRCD showed stronger clustering effect than that between HFD and CD (Fig. 1).
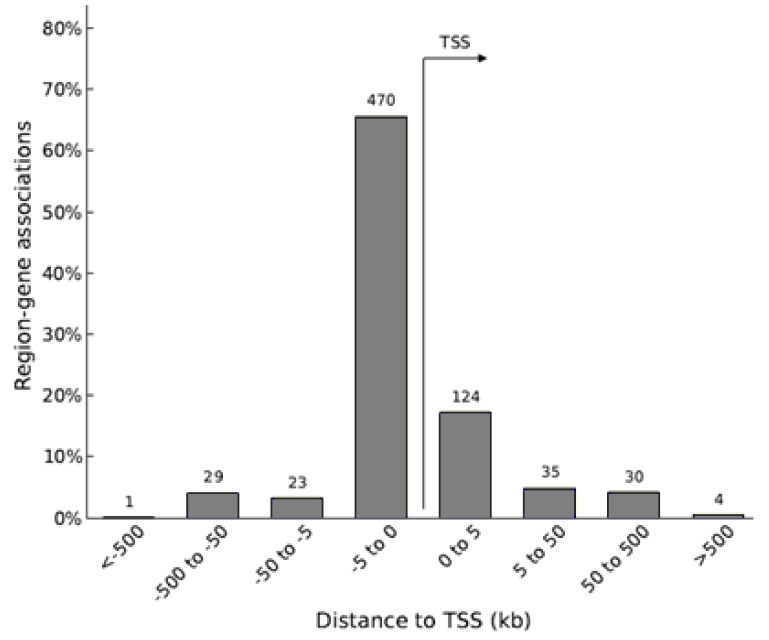
After applying the per-probe quality control techniques, genomically neighboring probes were grouped together into a differentially methylated region (DMR) when each of those probes was determined to be differentially methylated between two compared groups with the P-value < 0.01. In all three comparisons combined, most of the DMRs were near the transcription start sites (TSSs) of their annotated genes (Fig. 2), indicating that those DNA methylation changes may affect gene expression.

DMR annotation and IPA analysis

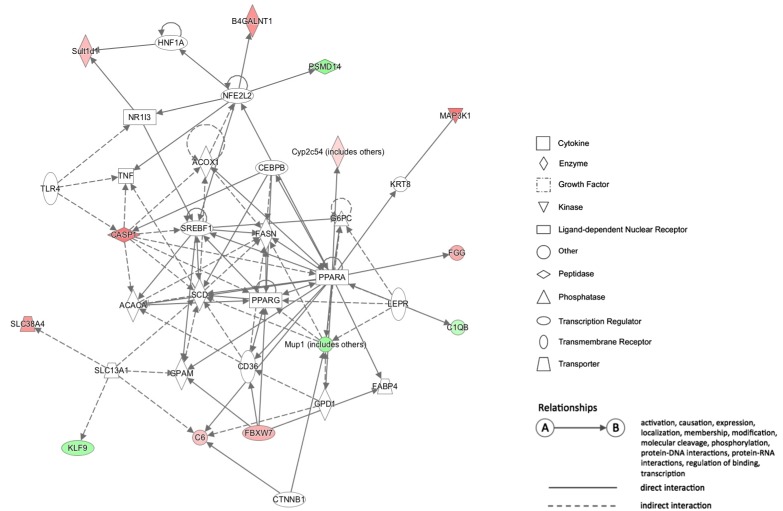
Using DMRs annotated to the genes of mouse genome, we conducted a network analysis using IPA (Table 5 and Table 6). In the HFD vs. CD comparison, 13 of 280 genes annotated back from DMRs were related to gastrointestinal disease, hepatic system disease, and liver steatosis (network score of 16). Five of 280 genes from the same comparison were related to the network with the biological function of carbohydrate metabolism, small molecule biochemistry, and cell death and survival (network score of 6). Within these two networks, HFD showed tendency of lower DNA methylation with few exceptions.
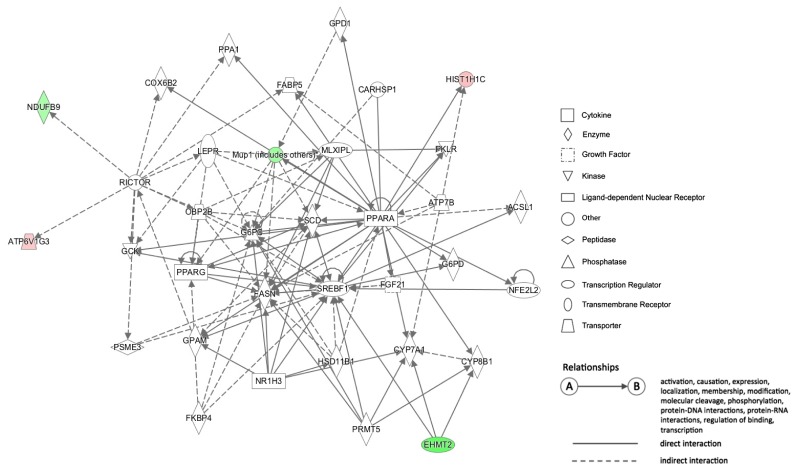
In the HFD vs. CRCD comparison, 5 of 179 genes annotated back from DMRs were mapped into a network with the biological function of lipid metabolism, molecular transport, and small molecule biochemistry (network score of 5). Three of 179 genes from the same comparison were enriched in another network related to cardiovascular disease, cellular assembly and organization, and cellular development (network score of 3). The HFD group showed lower DNA methylation in the HFD vs. CRCD comparison as well, with just a couple of exceptions.

Gene expression affected by DNA methylation

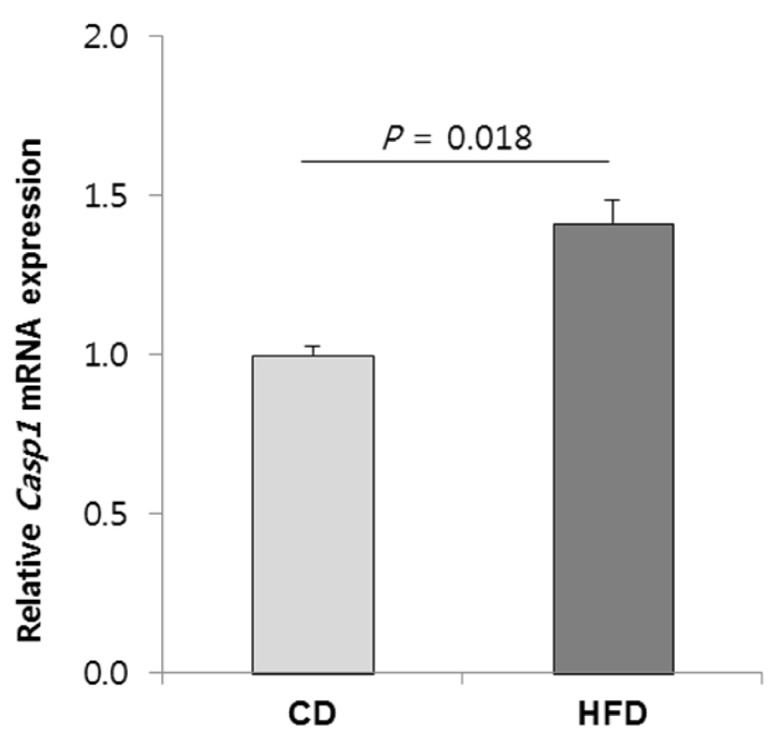
In the HFD vs. CD comparison, Casp1 (Caspase 1) is one of the central nodes in network 1 (Fig. 3). Casp1 is a gene that encodes caspase-1 which is known to be a proinflammatory caspase involved in the proteolytic activation of inflammatory cytokines IL-1 and IL-18 [23]. Our data indicated that CpG sites located at roughly 1.5-kb upstream of the TSS of Casp1 gene might be hypomethylated in the HFD group. Our data also exhibited that the mRNA expression of Casp1 was 1.4-fold upregulated in the HFD group compared with the CD group (P = 0.018) (Fig. 4), suggesting that the gene expression might be influenced by CpG site hypomethylation in its gene promoter region.
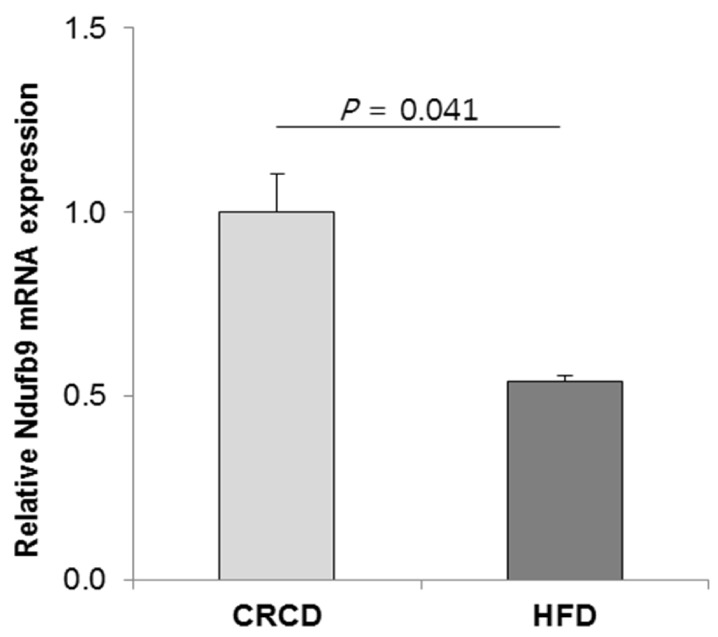
In the network 1 of HFD vs. CRCD comparison (Fig. 5), Ndufb9 (NADH dehydrogenase 1 beta subcomplex 9) is one of the hypermethylated genes in the HFD group. Ndufb9 is a nuclear gene that encodes an accessory subunit of mitochondrial complex I of the oxidative phosphorylation system [24] and is one of the necessary subunits for assembly and/or stability of complex I [25]. Based on our data, CpG sites ~2.6-kb downstream of the TSS of Ndufb9 gene were hypermethylated in the HFD group compared with the CRCD group and its mRNA expression was lower in the HFD group compared with the CRCD group at the half level (P = 0.041) (Fig. 6). Thus, the intragenic DNA methylation of Ndufb9 might have led to the down-regulation of its mRNA expression.

DISCUSSION

In this study, genome-wide changes in DNA methylation patterns in HFD-induced obese mice were analyzed to understand biological network associated with consumption of HFD compared with CD and CRCD and to validate whether transcription of the genes with DMRs were regulated by DNA methylation. Biological networks related to liver lipid accumulation and liver diseases were associated with HFD-induced DNA methylation changes. Particularly in the HFD vs. CD comparison, hypomethylation of DMR in the promoter region of proinflammatory Casp1 gene under HFD seemed to be a possible cause of its increased mRNA level. Moreover, in the HFD vs. CRCD comparison, hypermethylated DMR in intragenic region of Ndufb9 under HFD might be a cause of its lower mRNA expression.
The significance of these findings is that high-throughput method was utilized to provide the insight into the influence of HFD-induced obesity on genome-wide changes in hepatic DNA methylation. There was a similar high-throughput approach previously, in which the effect of HFD was examined from mouse conception through the adulthood [14]. The current study differs in its design from the previous study in that it examined the effect of HFD consumption during the adulthood only. Since changes in DNA methylation patterns after early life period is also important [15], this study could complement current knowledge by providing information on genome-wide influence of HFD consumption during adulthood.
Heat maps of HFD vs. CD and HFD vs. CRCD comparisons showed strong clustering effects suggesting that HFD had an influence on DNA methylation. Most of the DMRs were located within 5-kb up or downstream of TSS in this study. Since methylation around TSS is generally known to affect gene expression [26], it is suggested that changes in methylation detected in our study might have influences on gene expression.
In both HFD vs. CD and HFD vs. CRCD comparisons, HFD-induced DNA methylation changes were associated with biological networks of functions related to liver lipid accumulation and liver diseases. It is concurrent with previous findings that HFD causes changes in methylation status of specific genes involved in glucose and lipid metabolism of liver, inflammation, and liver development [1011121327]. In a previous study that investigated the genome-wide effect of HFD on liver DNA methylation starting from mouse conception, annotated genes with DMRs were enriched in signaling pathways of liver steatosis and liver development such as cell morphogenesis, developmental growth, response to stimuli, signal transduction, and triacylglycerol biosynthesis [14]. Therefore, results from this study could complement current knowledge by providing genome-wide evidence that HFD affects biological networks associated with liver lipid accumulation and liver diseases even during the adulthood.
Proinflammatory Casp1 gene in the HFD vs. CD comparison was selected to examine its gene expression because CpG sites within the promoter region of human CASP1 gene was reported to be hypomethylated in the livers of advanced NAFLD patients compared with that of the mild NAFLD patients and CASP1 mRNA level were inversely related to methylation status of its CpG sites [28]. Although mice from the HFD group in this study had enlarged liver and accumulation of lipid in the liver, the magnitude was not severe enough to be considered as NAFLD. This suggests that HFD could modulate Casp1 methylation status and its expression even at the pre-NAFLD stage.
On the other hand, there was no previous study regarding the influence of HFD or obesity on regulation of Ndufb9 gene expression in liver. In epididymal white adipose tissue, Ndufb9 was down-regulated in response to high-fat diet [29]. However, it is not known whether this downregulation was due to changes in DNA methylation. In this study, Ndufb9 was hypermethylated in the HFD group compared with the CD group and the level of Ndufb9 mRNA was also lower, suggesting that Ndufb9 expression was regulated by DNA methylation. Moreover, because Ndufb9 encodes one of the necessary subunits for assembly and/or stability of complex I of oxidative phosphorylation system of mitochondria [2425], decrease in Ndufb9 expression might contribute to the impairment of energy metabolism in HFD-induced obese mice.
Regarding the location of methylation sites, our results showed that DMR of Casp1 is located approximately 1.5-kb upstream of TSS. Although the impact of methylation within the promoter region varies depending on the particular genomic and cellular context of a given cell [26], it is generally accepted that the initiation of transcription is blocked by methylation within the promoter region in mammalian cells [30]. Our result showed that hypomethylation of Casp1 promoter region in HFD group compared to CD group was associated with reduction of transcriptional activity. DMR of Ndufb9, on the other hand, was located approximately 2.6-kb downstream of TSS, indicating that differential methylation was at the downstream of TSS. Role of intragenic methylation in mammal is controversial. Some suggests that methylation in gene body is positively correlated with mRNA transcription, meaning that methylation downstream of TSS does not block transcription elongation [30]. However, it was also reported that gene-body methylation could interfere with transcription elongation [31]. In this study, there was a hypermethylation downstream of Ndufb9 TSS in HFD group compared with CRCD group and the mRNA expression was lower in HFD group. Therefore, it seemed that intragenic methylation of Ndufb9 might have reduced efficiency of transcription elongation of the gene in HFD group and consequently downregulated its mRNA expression.
To the best of our knowledge, our study is the first to provide the evidence of genome-wide effect of HFD consumption during the adulthood on DNA methylation of liver tissue. However, some cautions are needed when interpreting the results due to its study design and experimental methods. First, paired mouse in CRCD group was provided the same total amount of food as the amount of food consumed by the paired mouse in HFD group and as a result the amount of individual nutrients consumed were different. Thus when interpreting the results from HFD vs. CRCD comparison, factors such as lower micronutrient intake in the CRCD group compared with the HFD group should be considered. However, the micronutrient intake of the CRCD group was lower by only 14% than that of the HFD group, and the amount consumed by the CRCD group would be enough to meet the nutrient requirement of the mouse [32]. Secondly, genomic DNA was extracted from whole liver tissue, therefore, changes in DNA methylation of specific cell types in liver tissue could not be determined. Finally, although microarray is a powerful tool for analysis of DNA methylation on a genome scale, it only provides crude tendency of methylation status, but does not give detailed information on the degree of methylation level. Hence, in order to validate DNA methylation differences screened via microarray method, additional examinations such as bisulfite pyrosequencing is required.
In summary, our findings provide genome-wide evidence that HFD feeding during the adulthood affects genes involved in liver lipid accumulation and liver steatosis through alteration of DNA methylation patterns.

Notes

This research was supported by the Basic Science Research Program through the National Research Foundation of Korea (NRF) funded by the Ministry of Education (grant number NRF-2010-0024878) and by the research grant from the Korean Food Research Institute (to S-W C).

CONFLICT OF INTEREST: The authors declare no conflicts of interests.

References

1. Lim SS, Vos T, Flaxman AD, Danaei G, Shibuya K, Adair-Rohani H, Amann M, Anderson HR, Andrews KG, Aryee M, Atkinson C, Bacchus LJ, Bahalim AN, Balakrishnan K, Balmes J, Barker-Collo S, Baxter A, Bell ML, Blore JD, Blyth F, Bonner C, Borges G, Bourne R, Boussinesq M, Brauer M, Brooks P, Bruce NG, Brunekreef B, Bryan-Hancock C, Bucello C, Buchbinder R, Bull F, Burnett RT, Byers TE, Calabria B, Carapetis J, Carnahan E, Chafe Z, Charlson F, Chen H, Chen JS, Cheng AT, Child JC, Cohen A, Colson KE, Cowie BC, Darby S, Darling S, Davis A, Degenhardt L, Dentener F, Des Jarlais DC, Devries K, Dherani M, Ding EL, Dorsey ER, Driscoll T, Edmond K, Ali SE, Engell RE, Erwin PJ, Fahimi S, Falder G, Farzadfar F, Ferrari A, Finucane MM, Flaxman S, Fowkes FG, Freedman G, Freeman MK, Gakidou E, Ghosh S, Giovannucci E, Gmel G, Graham K, Grainger R, Grant B, Gunnell D, Gutierrez HR, Hall W, Hoek HW, Hogan A, Hosgood HD 3rd, Hoy D, Hu H, Hubbell BJ, Hutchings SJ, Ibeanusi SE, Jacklyn GL, Jasrasaria R, Jonas JB, Kan H, Kanis JA, Kassebaum N, Kawakami N, Khang YH, Khatibzadeh S, Khoo JP, Kok C, Laden F, Lalloo R, Lan Q, Lathlean T, Leasher JL, Leigh J, Li Y, Lin JK, Lipshultz SE, London S, Lozano R, Lu Y, Mak J, Malekzadeh R, Mallinger L, Marcenes W, March L, Marks R, Martin R, McGale P, McGrath J, Mehta S, Mensah GA, Merriman TR, Micha R, Michaud C, Mishra V, Mohd Hanafiah K, Mokdad AA, Morawska L, Mozaffarian D, Murphy T, Naghavi M, Neal B, Nelson PK, Nolla JM, Norman R, Olives C, Omer SB, Orchard J, Osborne R, Ostro B, Page A, Pandey KD, Parry CD, Passmore E, Patra J, Pearce N, Pelizzari PM, Petzold M, Phillips MR, Pope D, Pope CA 3rd, Powles J, Rao M, Razavi H, Rehfuess EA, Rehm JT, Ritz B, Rivara FP, Roberts T, Robinson C, Rodriguez-Portales JA, Romieu I, Room R, Rosenfeld LC, Roy A, Rushton L, Salomon JA, Sampson U, Sanchez-Riera L, Sanman E, Sapkota A, Seedat S, Shi P, Shield K, Shivakoti R, Singh GM, Sleet DA, Smith E, Smith KR, Stapelberg NJ, Steenland K, Stöckl H, Stovner LJ, Straif K, Straney L, Thurston GD, Tran JH, Van Dingenen R, van Donkelaar A, Veerman JL, Vijayakumar L, Weintraub R, Weissman MM, White RA, Whiteford H, Wiersma ST, Wilkinson JD, Williams HC, Williams W, Wilson N, Woolf AD, Yip P, Zielinski JM, Lopez AD, Murray CJ, Ezzati M, AlMazroa MA, Memish ZA. A comparative risk assessment of burden of disease and injury attributable to 67 risk factors and risk factor clusters in 21 regions, 1990-2010: a systematic analysis for the Global Burden of Disease Study 2010. Lancet. 2012; 380:2224–2260. PMID: 23245609.
crossref
2. Eckel RH, Grundy SM, Zimmet PZ. The metabolic syndrome. Lancet. 2005; 365:1415–1428. PMID: 15836891.
crossref
3. Seppälä-Lindroos A, Vehkavaara S, Häkkinen AM, Goto T, Westerbacka J, Sovijärvi A, Halavaara J, Yki-Järvinen H. Fat accumulation in the liver is associated with defects in insulin suppression of glucose production and serum free fatty acids independent of obesity in normal men. J Clin Endocrinol Metab. 2002; 87:3023–3028. PMID: 12107194.
crossref
4. Kotronen A, Westerbacka J, Bergholm R, Pietiläinen KH, Yki-Järvinen H. Liver fat in the metabolic syndrome. J Clin Endocrinol Metab. 2007; 92:3490–3497. PMID: 17595248.
crossref
5. Ridker PM, Buring JE, Cook NR, Rifai N. C-reactive protein, the metabolic syndrome, and risk of incident cardiovascular events: an 8-year follow-up of 14 719 initially healthy American women. Circulation. 2003; 107:391–397. PMID: 12551861.
6. Mertens I, Verrijken A, Michiels JJ, Van der Planken M, Ruige JB, Van Gaal LF. Among inflammation and coagulation markers, PAI-1 is a true component of the metabolic syndrome. Int J Obes (Lond). 2006; 30:1308–1314. PMID: 16389265.
crossref
7. Park EJ, Lee JH, Yu GY, He G, Ali SR, Holzer RG, Österreicher CH, Takahashi H, Karin M. Dietary and genetic obesity promote liver inflammation and tumorigenesis by enhancing IL-6 and TNF expression. Cell. 2010; 140:197–208. PMID: 20141834.
crossref
8. Choi SW, Friso S. Epigenetics: a new bridge between nutrition and health. Adv Nutr. 2010; 1:8–16. PMID: 22043447.
crossref
9. Milagro FI, Campión J, García-Díaz DF, Goyenechea E, Paternain L, Martínez JA. High fat diet-induced obesity modifies the methylation pattern of leptin promoter in rats. J Physiol Biochem. 2009; 65:1–9. PMID: 19588726.
crossref
10. Jiang M, Zhang Y, Liu M, Lan MS, Fei J, Fan W, Gao X, Lu D. Hypermethylation of hepatic glucokinase and L-type pyruvate kinase promoters in high-fat diet-induced obese rats. Endocrinology. 2011; 152:1284–1289. PMID: 21239437.
crossref
11. Schwenk RW, Jonas W, Ernst SB, Kammel A, Jähnert M, Schürmann A. Diet-dependent alterations of hepatic Scd1 expression are accompanied by differences in promoter methylation. Horm Metab Res. 2013; 45:786–794. PMID: 23803969.
crossref
12. Chang X, Yan H, Fei J, Jiang M, Zhu H, Lu D, Gao X. Berberine reduces methylation of the MTTP promoter and alleviates fatty liver induced by a high-fat diet in rats. J Lipid Res. 2010; 51:2504–2515. PMID: 20567026.
crossref
13. Dudley KJ, Sloboda DM, Connor KL, Beltrand J, Vickers MH. Offspring of mothers fed a high fat diet display hepatic cell cycle inhibition and associated changes in gene expression and DNA methylation. PLoS One. 2011; 6:e21662. PMID: 21779332.
crossref
14. Zhang Y, Wang H, Zhou D, Moody L, Lezmi S, Chen H, Pan YX. High-fat diet caused widespread epigenomic differences on hepatic methylome in rat. Physiol Genomics. 2015; 47:514–523. PMID: 26199400.
crossref
15. Richardson B. Impact of aging on DNA methylation. Ageing Res Rev. 2003; 2:245–261. PMID: 12726774.
crossref
16. Folch J, Lees M, Sloane Stanley GH. A simple method for the isolation and purification of total lipides from animal tissues. J Biol Chem. 1957; 226:497–509. PMID: 13428781.
crossref
17. Jin SG, Kadam S, Pfeifer GP. Examination of the specificity of DNA methylation profiling techniques towards 5-methylcytosine and 5-hydroxymethylcytosine. Nucleic Acids Res. 2010; 38:e125. PMID: 20371518.
crossref
18. Irizarry RA, Ladd-Acosta C, Carvalho B, Wu H, Brandenburg SA, Jeddeloh JA, Wen B, Feinberg AP. Comprehensive high-throughput arrays for relative methylation (CHARM). Genome Res. 2008; 18:780–790. PMID: 18316654.
crossref
19. Tammen SA, Park LK, Dolnikowski GG, Ausman LM, Friso S, Choi SW. Hepatic DNA hydroxymethylation is site-specifically altered by chronic alcohol consumption and aging. Eur J Nutr. Forthcoming 2015.
crossref
20. McLean CY, Bristor D, Hiller M, Clarke SL, Schaar BT, Lowe CB, Wenger AM, Bejerano G. GREAT improves functional interpretation of cis-regulatory regions. Nat Biotechnol. 2010; 28:495–501. PMID: 20436461.
crossref
21. Fujita PA, Rhead B, Zweig AS, Hinrichs AS, Karolchik D, Cline MS, Goldman M, Barber GP, Clawson H, Coelho A, Diekhans M, Dreszer TR, Giardine BM, Harte RA, Hillman-Jackson J, Hsu F, Kirkup V, Kuhn RM, Learned K, Li CH, Meyer LR, Pohl A, Raney BJ, Rosenbloom KR, Smith KE, Haussler D, Kent WJ. The UCSC Genome Browser database: update 2011. Nucleic Acids Res. 2011; 39:D876–D882. PMID: 20959295.
crossref
22. Livak KJ, Schmittgen TD. Analysis of relative gene expression data using real-time quantitative PCR and the 2(-Δ Δ C(T)) method. Methods. 2001; 25:402–408. PMID: 11846609.
23. Franchi L, Eigenbrod T, Muñoz-Planillo R, Nuñez G. The inflammasome: a caspase-1-activation platform that regulates immune responses and disease pathogenesis. Nat Immunol. 2009; 10:241–247. PMID: 19221555.
crossref
24. Smeitink J, van den Heuvel L. Human mitochondrial complex I in health and disease. Am J Hum Genet. 1999; 64:1505–1510. PMID: 10330338.
crossref
25. Haack TB, Madignier F, Herzer M, Lamantea E, Danhauser K, Invernizzi F, Koch J, Freitag M, Drost R, Hillier I, Haberberger B, Mayr JA, Ahting U, Tiranti V, Rötig A, Iuso A, Horvath R, Tesarova M, Baric I, Uziel G, Rolinski B, Sperl W, Meitinger T, Zeviani M, Freisinger P, Prokisch H. Mutation screening of 75 candidate genes in 152 complex I deficiency cases identifies pathogenic variants in 16 genes including NDUFB9. J Med Genet. 2012; 49:83–89. PMID: 22200994.
26. Jones PA. Functions of DNA methylation: islands, start sites, gene bodies and beyond. Nat Rev Genet. 2012; 13:484–492. PMID: 22641018.
crossref
27. Ge ZJ, Luo SM, Lin F, Liang QX, Huang L, Wei YC, Hou Y, Han ZM, Schatten H, Sun QY. DNA methylation in oocytes and liver of female mice and their offspring: effects of high-fat-diet-induced obesity. Environ Health Perspect. 2014; 122:159–164. PMID: 24316659.
crossref
28. Murphy SK, Yang H, Moylan CA, Pang H, Dellinger A, Abdelmalek MF, Garrett ME, Ashley-Koch A, Suzuki A, Tillmann HL, Hauser MA, Diehl AM. Relationship between methylome and transcriptome in patients with nonalcoholic fatty liver disease. Gastroenterology. 2013; 145:1076–1087. PMID: 23916847.
crossref
29. Choi MS, Kim YJ, Kwon EY, Ryoo JY, Kim SR, Jung UJ. High-fat diet decreases energy expenditure and expression of genes controlling lipid metabolism, mitochondrial function and skeletal system development in the adipose tissue, along with increased expression of extracellular matrix remodelling- and inflammation-related genes. Br J Nutr. 2015; 113:867–877. PMID: 25744306.
crossref
30. Jones PA. The DNA methylation paradox. Trends Genet. 1999; 15:34–37. PMID: 10087932.
crossref
31. Lorincz MC, Dickerson DR, Schmitt M, Groudine M. Intragenic DNA methylation alters chromatin structure and elongation efficiency in mammalian cells. Nat Struct Mol Biol. 2004; 11:1068–1075. PMID: 15467727.
crossref
32. National Research Council (US) Subcommittee on Laboratory Animal Nutrition. Nutrient Requirements of Laboratory Animals. 4th rev. ed. Washington (D.C.): National Academies Press;1995.
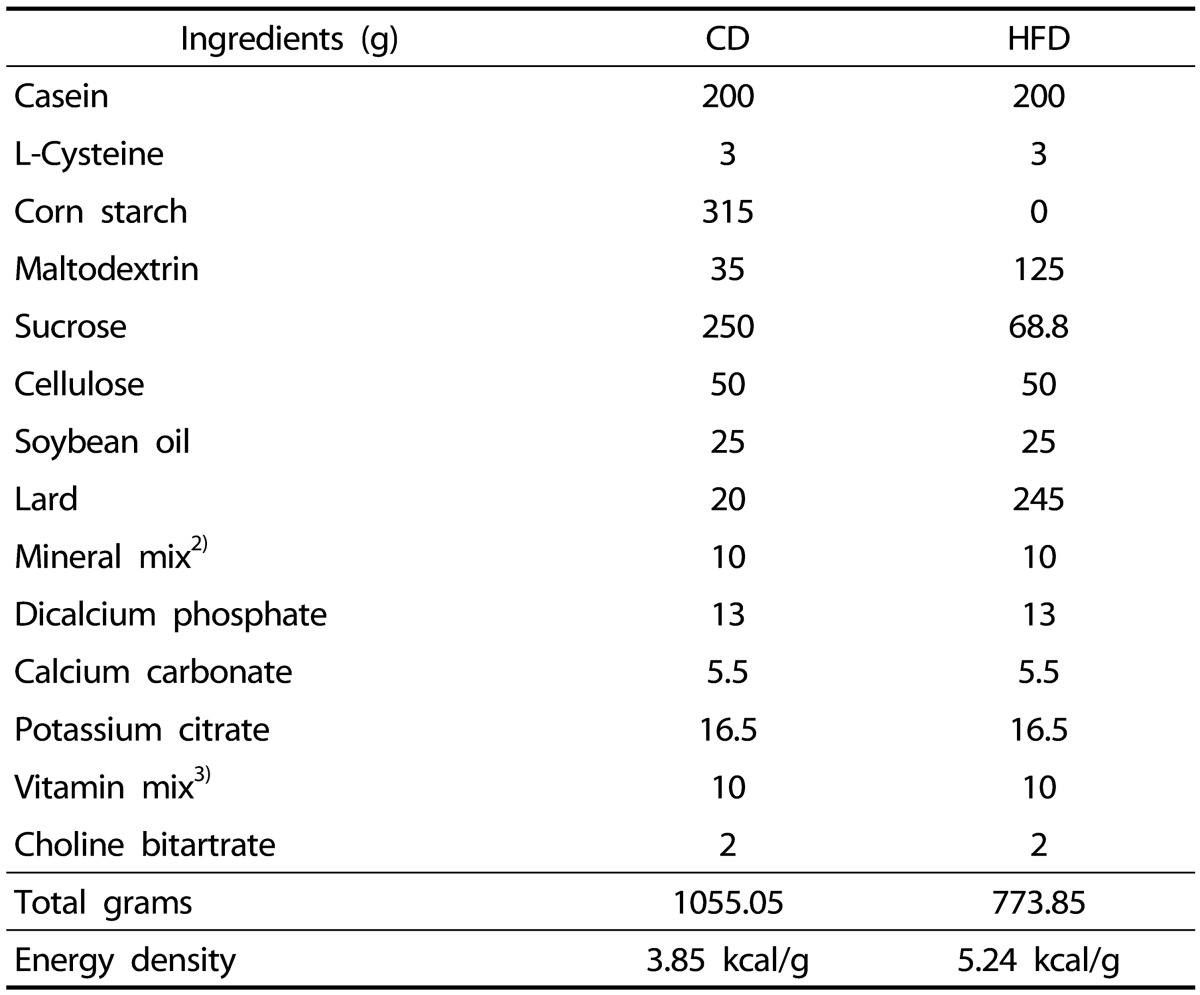
Fig. 1

Heat maps showing differentially methylated probes in each comparison. (A) CD vs. CRCD comparison. (B) HFD vs. CD comparison. (C) HFD vs. CRCD comparison. CRCD, calorie-restricted control diet; CD, control diet; HFD, high-fat diet.

nrp-11-105-g001
Fig. 2

Distance between DMRs and their annotated genes. The number of DMRs falling within the designated intervals relative to their annotated genes' transcription start sites (TSSs) are presented above each bar. This graph was generated via Stanford University's GREAT Analysis. DMRs: differentially methylated regions.

nrp-11-105-g002
Fig. 3

Network 1 of the HFD vs. CD comparison. This network is involved in gastrointestinal disease, hepatic system disease, and liver steatosis. Red: Genes found in our data that were hypomethylated in HFD group. Green: Genes found in our data that were hypermethylated in HFD group. HFD, high-fat diet; CD, control diet.

nrp-11-105-g003
Fig. 4

Relative level of Casp1 mRNA in the HFD group compared with that of the CD group. The value are expressed as means ± SEM, n = 7 for each group. Student's t-test P-value is shown. HFD, high-fat diet; CD, control diet.

nrp-11-105-g004
Fig. 5

Network 1 of the HFD vs. CRCD comparison. This network is involved in lipid metabolism, molecular transport, and small molecule biochemistry. Red: Genes found in our data that were hypomethylated in HFD group. Green: Genes found in our data that were hypermethylated in HFD group. HFD, high-fat diet; CRCD, calorie-restricted control diet.

nrp-11-105-g005
Fig. 6

Relative level of Ndufb9 mRNA inthe HFD group compared with that of the CRCD group. The values are expressed as means ± SEM, n = 6 for CRCD and 7 for HFD. Student's t-test P-value is shown. HFD, high-fat diet; CRCD, calorie-restricted control diet.

nrp-11-105-g006
Table 1

Composition of the diets1)

nrp-11-105-i001

1) Resource: Research Diets, Inc. New Brunswick, NJ, USA.

2) 10 g of mineral mix (Research Diets, S10026) contains 1.0 g of sodium, 1.6 g of chloride, 0.5 g of magnesium, 0.33 g of sulfate, 1.6 g of molybdate, 2.0 g of chromium, 6.0 g of copper, 37 mg of iron, 59 mg of magnesium, 0.2 mg of iodate, 0.9 mg of fluoride, 0.16 mg of selenite, 29 mg of zinc, 3.99 g of sucrose.

3) 10 g of vitamin mix (Research Diets, V10001) contains 4,000 IU of vitamin A, 1,000 IU of Vitamin D3, 50 IU of vitamin E, 0.5 mg of menadione, 0.2 mg of biotin, 10 µg of vitamin B12, 2 mg of folate, 30 mg of niacin, 16 mg of panthothenic acid, 7 mg of vitamin B6, 6 mg of vitamin B2, 6 mg of vitamin B1, 9.78 g of sucrose.

CD, control diet; HFD, high-fat diet.

Table 2

Sequences of primers used for real time PCR

nrp-11-105-i002

Casp1, Caspase 1; Ndufb9, NADH dehydrogenase 1 beta subcomplex 9, Gapdh, glyceraldehyde 3-phosphate dehydrogenase.

Table 3

Body weight, weight gain, liver weight, and liver weight per body weight, food intake of CRCD, CD, and HFD groups

nrp-11-105-i003

1) Values are expressed as means ± SEM.

2) One-way ANOVA was used to determine the statistical differences among groups, followed by Fisher's LSD tests (P < 0.05 was considered significantly different). CRCD, calorie-restricted control diet; CD, control diet; HFD, high-fat diet.

Table 4

Liver triacylglycerol and cholesterol levels

nrp-11-105-i004

1) Values are expressed as means ± SEM.

2) One-way ANOVA was used to determine the statistical differences among groups, followed by Fisher's LSD tests (P < 0.05).

CRCD, calorie-restricted control diet; CD, control diet; HFD, high-fat diet.

Table 5

IPA network analysis result of genes annotated back from DMRs of the HFD vs. CD comparison.

nrp-11-105-i005

Shade: Genes found in our data that were hypomethylated in HFD group.

Bold: Genes found in our data that were hypermethylated in HFD group.

For Mup1( includes others) in this table, it refers to Mup5.

DMRs, differentially methylated regions; HFD, high-fat diet; CD, control diet.

Table 6

IPA network analysis result of genes annotated based on DMRs of the HFD vs. CRCD comparison.

nrp-11-105-i006

Shade: Genes found in our data that were hypomethylated in HFD group.

Bold: Genes found in our data that were hypermethylated in HFD group.

For Mup1( includes others) in this table, it refers to Mup4 and Mup6.

DMRs, differentially methylated regions; HFD, high-fat diet; CRCD, calorie-restricted control diet.

TOOLS
Similar articles