

 PDF
PDF ePub
ePub Citation
 Print
Print


INTRODUCTION
Iron is stored in our body as a form of ferritin, and thus ferritin serves as a convenient and accurate indicator of iron status in humans [1]. It has been suggested that a high level of serum ferritin acts as a potent oxidant, increasing oxidative stress and leading to various diseases [234].
Studies have tried to identify factors, besides iron intake. That affect serum ferritin levels. The result of studies have shown that drinking, smoking, educational level, and regular exercise are possible factors associated with serum ferritin levels [567]. Dietary iron intake, such as the amount of iron intake and the type of iron consumed, is also one of the determinants of serum ferritin level [8].
There are two types of iron in food: heme and nonheme iron. Heme iron, mainly found in animal based foods, has high bioavailability in the body while non-heme iron is obtained from grains, legumes, vegetables, or fruits and is considered to have low bioavailability [9]. Interestingly, recent studies have shown that a plant-based diet was beneficial in reducing serum ferritin level in either diabetes or anemia patients with high ferritin [1011]. A study reported that vegetarian females had lower metabolic syndrome incidence, which was related with lower serum ferritin level compared to non-vegetarians [12].
High ferritin level in postmenopausal women has been implicated in the pathogenesis of many diseases, such as cardiovascular diseases, diabetes, and metabolic syndrome [13141516]. Furthermore, although increased iron resulting from menopause may be considered within normal physiologic range, it may also lead to potential health problems [17]. If the associations between high ferritin and diseases are truly causal, monitoring factors associated with the high risk of serum ferritin in this population will have substantial implications for public health.
While several studies have assessed the relation between serum ferritin and various chronic diseases [1213141516] or dietary influences in subjects at risk of anemia [181920], limited study has focused on the relationship between dietary factors and the high ferritin risk in postmenopausal women [2122]. Therefore, the purpose of this study is to determine the association between serum ferritin levels and various factors including dietary intake in postmenopausal women by analyzing 3 years of KNHANES data (2010-2012).
SUBJECTS AND METHODS
Study population
The Korean National Health and Nutrition Examination Survey (KNHANES) is an ongoing series of cross-sectional surveys. It is conducted by the Korea Centers for Disease Control (KCDC) and is designed to assess health and nutritional information from a representative sample of Koreans. This study analyzed the fifth Korean National Health and Nutrition Examination Survey (KNHANES V, 2010-2012), which included a total number of 17,218 participants, 7,170 males and 10,048 females. Only postmenopausal women (n = 4,667) who answered "yes" to the question about menopausal status were included. The subjects for this study were selected based on the following criteria. First of all, individuals who did not respond to the food intake survey or lacked information on serum ferritin level were excluded. Those who had chronic liver or renal diseases, known diagnoses of malignancies, or probable hemochromatosis, based on abnormal values of serum ferritin (≥ 500 ng/mL), were also excluded. Thus, the postmenopausal women who met the above criteria (n = 3880) were selected, and the subjects were divided into quartiles, based on serum ferritin concentrations: Q1, ≤ 35.4 ng/mL (median; 24. 5 ng/mL); Q2, 35.5-56.1 ng/mL (median; 45.3 ng/mL); Q3, 56.2-86.6 ng/mL (median; 69.1 ng/mL); and Q4, > 86.7 ng/mL (median; 114.9 ng/mL).
General characteristics
The subjects in this study were grouped according to the general characteristics of the subjects: survey year (2011, 2012, 2013), age (less than 50, 50-59, 60-69 and over 70 years), current smoking status (yes or no to 'current smoking'), regular exercise ('yes' and 'no', based on self-reported regular physical exercise), education (less than middle school graduate, high school graduate, and college graduate or higher), drinking habit (none-drinker, drinking frequency ≤ 1-2 times/year; occasional drinker, drinking frequency ≤ 2-4 times/month; heavy drinker, drinking frequency alcohol ≥ 2 times/week), living area (large city, mid-sized or small city, rural area), and monthly income (divided into 4 groups - Low, Mid-low, Mid-high, and High groups by mean values based on the income of the participant's age group).
Physical and hematological measurements
Body mass index (BMI) was calculated by dividing the weight (kilograms) by the height squared (square meters). Since subjects who were underweight (BMI < less than 18.5) comprised only 2.1%, BMI was separated into 3 categories: less than 22.9 as normal, 23 < BMI < 24.9 as overweight, and more than 25.0 kg/m2 as obese. Blood pressure was measured in the sitting position with a mercury sphygmomanometer on the right arm and averaged for a final blood pressure reading.
Blood samples were obtained in the morning following an overnight fast. The serum concentrations of glucose, cholesterol, high- density lipoprotein (HDL) cholesterol, and triglyceride (TG) were measured using a Hitachi automatic analyzer 7600 (Tokyo, Japan). Serum ferritin and iron were measured by immunoradiometric assays using a 1470 Wizard gamma-counter (Perkin-Elmer, Turku, Finland). Total blood heavy metals were measured by a cold-vapor atomic absorption spectrometric method using a dedicated mercury analyzer (M-6000A, CETAC Technologies). All clinical analyses were performed by the Neodin Medical Institute, a laboratory certified by the Korea Ministry of Health and Welfare.
Food groups and nutrient intakes
The consumptions of major food groups and nutrient intakes were estimated based on 24-hour dietary recalls interviews. Nutrient intakes and the ratios of energy intake from each macronutrient to total energy (percentage (%) of energy intake from carbohydrate, fat, and protein) were determined. To estimate the intake of food groups by the participants, the secondary food code for 24 hour recall data was used. The KNHENES applied 18 food group classifications based on the Rural Development Administration (RDA) food ingredient tables: 16 general food groups, one cooking processed food group, and one other group [23]. Briefly, 5000 different food codes were used to code the intake of adult respondents and these individual KNHANES food codes were collapsed into 144 food items. In addition to the 144 food item codes, the foods were further collapsed into 18 food groups.
Statistical analysis
To make valid inferences accounting for the KNHANES 2010-2012 complex multistage sampling design, sampling weights were incorporated to produce population estimates using SAS software (version 9.2; SAS Institute, Cary, NC, USA). The survey sample weights were calculated taking into consideration the sampling rate, response rate, and proportion of the reference population. The data results were reported as weighted %, mean values, and standard errors.
Chi-square test (χ2-test) was performed to identify significant differences among categorical variables, and significant differences among continuous variables were verified by GLM (Generalized Linear Model) through the proc surveyreg procedure. To analyze nutrient and food intake, descriptive statistics were generated for mean values and standard errors of nutrient intake, using ferritin quartiles as the independent variable and the nutrient and food group intake as the dependent variable. Significance testing was conducted for P for trends using the proc surveyreg procedure.
Odds ratios (ORs) were used as a measure of association. For OR calculation, the subjects were categorized into two classes based on the value of ferritin: a high-risk group (4Q, serum ferritin level > 86.7 ng/mL) and a control group (1Q-3Q, serum ferritin level ≤ 86.7 ng/mL). In comparing the effect of the selected variable, the remaining covariates were adjusted. For example, to determine the effect of age on high ferritin risk, variables other than age were adjusted: drinking habit, educational level, BMI, Blood glucose, SBP, HDL, TG, serum iron, and energy intake. Significance level was set at the 95% Confidence Interval (CI).
RESULTS
Descriptive characteristics of subjects by ferritin quartiles
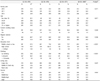
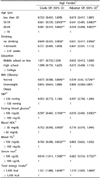
The baseline characteristics of the subjects by ferritin quartiles are presented in Table 1. Age, education levels, and drinking habits were significantly associated with ferritin levels. Subjects aged 70 or higher constituted the highest weighted percentage (32.2%) in the 4th quartile of ferritin levels, whereas those aged 50-59 years had higher proportions in the 2nd and 3rd quartiles. In terms of education, the proportion of individuals with low education level (middle school or less) significantly increased as the quartile of serum ferritin increased. The percentage of subjects who drank more than 2-4 times/week significantly increased as the quartile of serum ferritin increased (1st quartile 5.4%, 2nd quartile 6.1%, 3rd quartile 9.3%, 4th quartile 10.7%. P = 0.0003). Other variables such as survey year, smoking status, exercise habit, living area, or monthly income, were not associated with ferritin level in postmenopausal women.
Physical and hematological parameters of subjects by ferritin quartiles
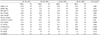
Subjects with higher ferritin levels tended to have higher mean BMI (Table 2). Systolic blood pressure (SBP) and blood glucose levels also showed a positive association with serum ferritin levels. The high density lipoprotein (HDL) cholesterol had a negative correlation with serum ferritin levels, while TG showed a positive association. Serum Fe level was positively correlated with serum ferritin level, whereas heavy metals such as Pb and Cd were not significantly associated with ferritin level.
Major food intakes by serum ferritin quartile
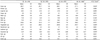
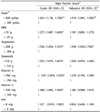
Grain consumption was found to negatively relate with serum ferritin levels in postmenopausal women (Table 3). Furthermore, milk intake was also found to have a negative association among the groups. Vegetable intake also showed a negative correlation with serum ferritin levels. There were no significant associations between the intakes of potatoes, legume, sugar, meat, egg, fruit, mushroom, seafood, nuts, oil, or eggs and ferritin quartiles.
Major nutrient intakes by serum ferritin quartile
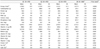
The daily intakes of energy, carbohydrate, protein, and fat showed a significantly negative association with increasing ferritin quartiles (Table 4). However, when calculating the percent ratio of these energy nutrients to the total daily intake, no significant relationship between ferritin levels and the energy nutrients was found. Serum ferritin levels were also found to have a significantly negative association with calcium, vitamin A, and vitamin C intakes.
Odds Ratios of potential factors associated with serum ferritin level
In comparing the effect of the selected variable, the remaining covariates were adjusted (Table 5). ORs greater than 1 indicated an increased likelihood of having high ferritin among postmenopausal women after adjustment of covariates. Postmenopausal women aged 50-59 were significantly less likely to have high ferritin levels than women of age 70 or more. Drinking habit (no drinking vs. 2-4 times /week) was significantly associated with high ferritin levels even after adjustment of covariates. Subjects with normal weight (BMI less than 23) were significantly less likely than obese subjects to have high ferritin levels, both with crude or adjusted covariates. The significant associations between high ferritin levels and SBP, HDL, or TG levels disappeared after the adjustment of covariates. Subjects with high fasting blood glucose levels were significantly more likely to have high ferritin levels, even after adjustment of covariates. The OR for high ferritin in relation to serum iron levels was statistically significant in postmenopausal women after adjustments.
Odds Ratios (ORs) for potential food groups and nutrients associated with high serum ferritin levels
The ORs and confidence interval (CI) for the risk of high ferritin levels in relation to the intakes of foods and nutrients are presented in Table 6. Subjects with low grain intake were significantly more likely than those with high grain intake to have high ferritin levels, for either crude or adjusted confounding cofactors. The significant negative association between milk intake and ferritin levels disappeared after adjustment. The significant negative association between vegetable intake and ferritin levels remained after the adjustment of confounding cofactors. The significant negative association between seaweed intake and ferritin levels also disappeared after adjustment. The significant association between ferritin risk and vitamin A or vitamin C and iron intakes was attenuated after adjustment.
DISCUSSION
In light of the dearth of reports on health problems caused by high ferritin in women in recent years, it is important to assess which factors, besides hormonal changes, are related to high ferritin levels. Thus, we selected postmenopausal women to minimize the effects of hormonal changes, and to evaluate the dietary and lifestyle factors related to high ferritin levels. We applied logistic regression models to determine the independent effect of those factors on the risk of serum ferritin. A previous study reported that moderately elevated iron levels (median level of 75-85 ng/mL in postmenopausal women) were associated with an increased prevalence of metabolic syndrome and diabetes [24]. Based on the above study, we compared the high-risk group (4Q, serum median ferritin level > 86.7 ng/mL) to the control group (1Q-3Q, serum median ferritin level ≤ 86.7 ng/mL). Odds ratios (ORs) and 95% confidence intervals (95% CIs) for high ferritin risk were calculated using multivariate logistic regression analyses after adjusting for confounding variables
In this study, upon fully adjusting for covariates, age, BMI, and blood glucose still remained as significant factors for high risk of ferritin in postmenopausal women. Age seems to be an important factor for high ferritin risk in postmenopausal women. Our study showed that women over 70 comprised the highest percentage of the high-risk ferritin group (Q4). This result is consistent with a previous study that reported that plasma ferritin concentrations increased with age in postmenopausal women [8]. We believe that older women, especially those older than 70, face greater health risk from various external factors as well as hormonal decline, which may have triggered an increase in ferritin levels [17].
Besides age, other important cofactors of ferritin risk in postmenopausal women were BMI and blood glucose level. This result is consistent with studies showing that BMI and glucose were positively associated with serum ferritin [242526]. These two factors are also indicators of metabolic syndromes, which arise as a combination of medical disorders closely linked to insulin resistance and increased risk of cardiovascular diseases [34]. Several studies have revealed that increased iron stores in postmenopausal women are associated with such diseases. Recent meta-analysis also indicated that elevated levels of ferritin (individuals in the top fifth of ferritin levels) have about a 70% higher risk of T2DM events compared with those in the bottom fifth [25]. Possible mechanisms underlying how high ferritin levels affect metabolic syndromes or diabetes have been suggested: high levels of serum ferritin acts as a potent oxidant, which may cause cell damage in the body and lead to the development of various diseases [2]. Based on these studies, it may be that high glucose, high BMI, and high serum ferritin act synergistically, contributing to these diseases. However, this is only a cross sectional study, and thus the results of this study do not explain the causal effect relationship; longitudinal studies are needed to clarify this relationship.
Several studies have reported that socio- economical and lifestyle factors such as smoking, drinking, exercise, monthly income and educational level were associated with high ferritin [5817]. However, in this study only drinking habit was associated with high ferritin levels. This discrepancy may have resulted from the selection of the study subjects and their gender. Previous studies have reported smoking as an especially important factor associated with ferritin risk, but the subjects of this study had less than a 5% smoking population (possibly due to cultural and gender norms), which may have affected the results of our study.
This study found that the intake of grains and vegetables are important dietary factors negatively associated with serum ferritin level. It was reported that the subjects who consumed whole grains had a 77% lower risk of high iron stores than did the subjects who did not consume grains [8]. Another study also reported negative associations with serum ferritin and bread intake, independent of other potential confounders [21]. The intake of vegetables has been linked to anti-inflammatory effects, which may have caused the negative association with high serum ferritin level in women [12]. The negative influence of grain and vegetable consumption on serum ferritin may be related to various components in these plant based foods, most importantly fiber, phytate, and phytochemicals including polyphenols [11122627].
Interestingly, the total iron intake was not significantly associated with serum ferritin levels, in contrast to some previous studies [820]. Yet, this result is consistent with previous studies showing no significant correlation between serum ferritin and total iron intake in both young and adult women [282930]. However, Fleming DJ et al. [31] reported that exclusion of supplemental iron from total iron intake may be the reason for the lack of association between total iron intake and serum ferritin. Since the information on vitamin or mineral supplements that contain iron is not available in KNHANES data at present, we did not include iron supplements in the total amount of iron intake. Therefore, further study of iron intake from supplements or health functional foods which may affect ferritin levels in postmenopausal women is needed.
There are also other limitations in this study. First, this is a cross sectional study and thus only shows statistical associations, rather than any cause-and-effect relationships. Second, because of the nature of the survey questionnaires, we could not exclude the effects of information bias. Third, the estimated amounts of food consumption were based on one 24 hour dietary recall, which is known to have high within-person variability. Despite these limitations, the present study has several strengths. First, we used data from a reliable nationally representative database, collected for 3 years from 2010-2012. Second, strict quality controls were applied to the study procedures within KNHANES. In dietary intake data using 24 hour recall, despite within-person variability, the average intake level of the population drawn from a large, representative sample is believed to be unaffected by day-to-day variation [32]. Thus the result of this diet study is unlikely to be distorted due to a single day of 24 hour recall [33]. Overall, this study is meaningful because we think this is the first study showing that intakes of grains and vegetables are associated with high ferritin risk in postmenopausal women. Prospective studies are needed to further identify the causal relationship between dietary intake and reduction of blood ferritin concentration in postmenopausal women.
In conclusion, we have demonstrated that age, obesity, drinking habit, and blood glucose were the most influential factors for elevated serum ferritin levels in postmenopausal women. To reduce the risk of high ferritin in postmenopausal women, proper intake of plant based foods, especially whole grains and vegetables may be helpful.
 XML Download