Journal List > Nutr Res Pract > v.10(6) > 1050859

Ju, Song, Park, Do, and Park: Korean solar salts reduce obesity and alter its related markers in diet-induced obese mice

Abstract

BACKGROUND/OBJECTIVES

The aim of this experiments was to show anti-obesity effects of Korean solar salt from different salt fields in diet-induced obese mice.

SUBJECTS/METHODS

Diet-induced obesity (DIO) was induced by a high-fat diet (HFD; 45% cal from fat) in C57BL/6J mice for eight weeks. The mice were fed with the designated diets (chow diet for Normal, HFD for Control, 0.47%-salt-mixed HFD for purified salt (PS), Guerande solar salt from France (SS-G), solar salt from Y salt field (SS-Y), solar salts from T salt field (SS-T) and S salt field (SS-S)) for another eight weeks. We checked body weight, food efficiency ratio (FER) and tissue weights (liver and epididymal adipose tissue (EAT)), and observed serum concentrations of triacylglycerol (TG), total cholesterol (TC), leptin and insulin. We also evaluated gene expressions of adipogenic / lipogenic mRNAs of C/EBPα, PPARγ and FAS and beta-oxidation-related factors (PPARα and CPT-1) in liver and EAT. The mineral composition of salt samples were analyzed using inductively coupled plasma optical emission spectrometry (ICP-OES).

RESULTS

SS-T and SS-S significantly reduced body weight gain, FER, and weight of EAT compared to control and other samples (P < 0.05). SS-T and SS-S also significantly decreased serum levels of TG, TC, leptin and insulin (P < 0.05). SS-T and SS-S suppressed expressions of adipogenic / lipogenic mRNAs in liver and EAT, while promoting expression of beta-oxidation-related factors. The lowest sodium concentration was observed in SS-T (30.30 ± 0.59%), and the lowest sodium-to-potassium (Na/K) ratio was found in SS-S (17.81).

CONCLUSIONS

Our study shows that well-processed Korean solar salt may have anti-obesity effects in vivo, probably owing to its differences in mineral composition and other components, presumably resulting from the manufacturing processes. Further research is needed into the mechanism and to explore optimal manufacturing processes.

INTRODUCTION

Table salt is an essential condiment and is available as solar salt, purified salt, and processed salts such as bamboo salt, all of which have unique mineral content and processing method [1]. Solar salt, defined as "a crystalline material obtained from sea water by natural evaporation in salt fields," contains 92.4-94.4% of sodium chloride, and other minerals including potassium, magnesium, calcium, while purified salt, which is manufactured by evaporation of sea water after dialytic condensation, is 99.9% sodium chloride [123]. The mineral compositions of solar salts depend on the salt field [4], the duration of aging and manufacturing process [5]. Fleur de Sel, solar salt from Guerande, France, is abundant in minerals like calcium, magnesium, and potassium. However, solar salt produced in Korea contains more minerals than European salt [6]. Solar salt possesses anti-cancer properties in sarcoma-180-transplanted mice, lower mutagenic effect in comparison with purified salt and anti-hypertensive effect in Dahl salt-sensitive rats [789]. Obesity is characterized as an abnormal increase in body fat due to dysregulated energy homeostasis; untreated obesity is associated with type 2 diabetes, hyperlipidemia, atherosclerosis, hypertension and even osteoarthritis [101112]. Bamboo salt, possibly owing to higher concentration of minerals (potassium, calcium and sulfur) than other commercially-available salt, has an anti-obesity effect [13], while differences in suppression of obesity by the different origin of Korean solar salts have not been researched. Thus, we have selected representative solar salts from different salt fields in Korea, along with Guerande solar salt from France and purified salt, to be tested and compared for anti-obesity effects and related markers in the serum and tissues in mice with diet-induced obesity (DIO).

SUBJECTS AND METHODS

Samples, preparation of the experimental diet, and mineral analyses

Solar salt was obtained from different salt fields as follows; Y Corporation (Tae-an-gun, Chungcheongnam-do, South Korea; SS-Y), T Corporation (Shin-an-gun, Jeollanam-do, South Korea; SS-T), S Corporation (Shinan-gun, Jeollanamdo, South Korea; SS-S), and Sas Bourdic Co. (Guerande salt; Batz-sur-Mer, France; SS-G). Purified salt was provided from H Corporation (Ulsan, South Korea; PS).
Each salt sample was mixed into a high-fat diet (45% calories from fat; TD.06415. Harlan Laboratories, Madison, WI, USA) at 0.47% (wt/wt). The daily dosage administered was equivalent to 5 grams for a 60-kilogram human [14]. AIN-76A, which was administered to Normal group, was purchased from Samtaco (Osan, Gyeonggido, Korea)
Salt samples, heat-dried at 60℃ for 12 hrs, were analyzed for mineral composition by ICP-OES (inductively coupled plasma optical emission spectrometry) using an Optima 8300 unit (Perkin-Elmer, Waltham, MA, USA), in accordance with EPA (Environmental Protection Agency) method 6010 [15].

Animal study

Male C57BL/6J mice (6 weeks old, 16-18 g) were purchased from Samtako Bio Korea (Gyeonggi-do, South Korea). After obtaining study approval from the Institutional Animal Care and Use Committee (PNU-IACUC; PNU-2015-0889) of Pusan National University in Busan (Korea), animals were housed under a 12-h light/dark cycle at room temperature with ad libitum access to food and water. Animals were randomly divided into eight groups of ten mice per group as follows; a chow-diet-fed group (Normal), an HFD-fed group (Control), and HFD + PS, HFD + SS-T, HFD + SS-Y, HFD + SS-S, and HFD + SS-G groups. DIO was induced in all groups except for a Normal group feeding with an HFD for the first eight weeks, and appropriate experimental diets were then administered for the next eight weeks. Body weight and food consumption were measured twice weekly. Food efficiency ratio (FER) was calculated by dividing total weight gain with total food intake, from week 0 to week 16 [16].
At the end of the 16-week experimental period, mice were sacrificed without fasting [17], and tissues were harvested, weighed, snap-frozen in liquid nitrogen, and stored at −80℃ until required. Plasma was obtained from blood collected from abdominal aortas by centrifugation at 3,000 × g for 10 min and stored at −80℃ until analyzed.

Serum levels of triglyceride, total cholesterol, leptin, and insulin

Serum levels of triglyceride (TG), and total cholesterol (TC) were determined using commercial assay kits purchased from Asan Pharmaceutical (Seoul, South Korea). Serum insulin and leptin levels were also determined using commercial ELISA kits (R&D Systems, Minneapolis, MN, USA).

Reverse transcriptase polymerase chain reaction (RT-PCR)

mRNA extraction and cDNA constitution from tissues were performed with slight modification [18]. Amplification was performed over 40 cycles of 94℃ for 1 min (denaturing), 54℃ for 1 min (annealing), and 72℃ for 30 sec (extension) followed by a final 72℃ for 7 min. Gene expressions were quantified using Image J software (NIH, Maryland, MD, USA), and β-actin was used as an internal control. The sequences of the primers used were as follows; β-actin (5'-TGA AGG TCG GTG TGA ACG GAT TTG GC-3' (forward), 5'-CAT GTA GGC CAT GAG GTC CAC CAC-3' (reverse); NM_008084.3), CCAAT/enhancer-binding protein alpha (C/EBPα; 5'-CAA GAA CAG CAA CGA GTA CCG-3' (forward), 5'-GTC ACT GGT CAA CTC CAG CAC-3' (reverse); NM_007678.3), peroxisome proliferator-activated receptor alpha (PPARα; 5'-TCA GGG TAC CAC TAC GGA GT-3' (forward), 5'-CTT GGC ATT CTT CCA AAG CG-3' (reverse); NM_001113418.1), peroxisome proliferator-activated receptor gamma (PPARγ; 5'-TCG CTG ATG CAC TGC CTA TG-3' (forward), 5'-GAG AGG TCC ACA GAG CTG ATT-3' (reverse); NM_013124.3), fatty acid synthase (FAS; 5'-GCA CCT GCA GAT CCT TTG AT-3' (forward), 5'-GTC CCG GCA TTC AGA ATA GT-3' (reverse); NM_007988.3), and carnitine palmitoyl transferase I (CPT-1; 5'-TAT CGC CAC CTG CTG AAC C-3' (forward), 5'-TTG AAG GTG ACG AAG GTG GT-3' (reverse); NM_153679.2).

Statistical analysis

Results are presented as means ± SDs. The significance of differences between mean values were assessed using one-way ANOVA with Duncan's multiple range test. Null hypotheses of no difference were rejected if P-values were less than 0.05. The analysis was performed using SAS v 9.1 software (SAS Institute Inc., Cary, NC, USA).

RESULTS

Changes in body weight, food efficiency ratios and weights of epididymal adipose tissue

During the salt-treatment phase (week 9-week 16), HFD administration promoted weight gain in Control (7.9 ± 0.9 g) versus the Normal group (5.6 ± 1.0 g). Among the salt-administered groups at the same period, however, the HFD + SS-T (3.8 ± 0.4 g) and HFD + SS-S (4.1 ± 0.7 g) groups gained significantly less weight than Control (P < 0.05). Body weight gain of HFD + PS (6.1 ± 1.3 g), HFD + SS-Y (6.3 ± 0.9 g), however, was not significantly different from the Control, and HFD + SS-G (7.5 ± 1.3 g) adversely gained more weight than Control (P < 0.05) (Table 1).
The lowest food efficiency ratio (FER) occurred in the HFD + SS-T group (4.4 ± 0.6%), significantly less than the Control (6.3 ± 0.4%; P < 0.05) followed by HFD + SS-S (4.8 ± 0.3%), HFD + SS-Y (5.2 ± 0.3%), HFD + PS (5.6 ± 0.6%) and HFD + SS-G group (6.2 ± 0.8%).
Epididymal adipose tissue (EAT) weights in the HFD + SS-S group (1.53 ± 0.05 g, P < 0.05) were significantly lower than in the Control, and not different from Normal, followed by the HFD + SS-T (1.61 ± 0.04 g), HFD + SS-Y (1.67 ± 0.02 g) and HFD + SS-G groups (1.69 ± 0.03 g) (Table 1).

Serum analysis; triacylglycerol, total cholesterol, leptin and insulin

Among the salt-administered groups, the HFD + SS-S group had significantly lower TG levels (120.9 ± 1.4 mg/dl, P < 0.05), followed by the HFD + SS-T (134.2 ± 2.2 mg/dl), HFD + SS-Y (142.6 ± 3.6 mg/dl) and HFD + SS-G groups (143.5 ± 0.7 mg/dl). Conversely, the HFD + PS group showed higher TG level (164.5 ± 2.2 mg/dl) than Control (160.5 ± 1.7 mg/dl) (Table 2).
The lowest TC concentration among the salt-administered groups occurred in the HFD + SS-T group (163.3 ± 1.1 mg/dl, P < 0.05), followed by the HFD + SS-S (165.1 ± 1.1 mg/dl) and HFD + PS groups (189.5 ± 3.2 mg/dl). Conversely, the HFD + SS-G group showed a higher TG level (205.3 ± 1.0 mg/dl) than the Control (Table 2).
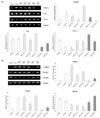
The leptin concentrations in salt-administered groups were significantly lower than in the Control (4.8 ± 0.3 ng/mL). The HFD + SS-T (3.1 ± 0.3 ng/mL) and the HFD + SS-S (3.3 ± 0.1 ng/mL) group had the lowest leptin level, followed by HFD + PS, HFD + SS-Y and HFD + SS-G (Fig. 1A).
Administration of HFD significantly increased the serum concentration of insulin (17.2 ± 0.1 ng/mL; P < 0.05) versus the Normal group (6.9 ± 0.7 ng/mL). The lowest insulin concentration among the salt-administered groups was observed in the HFD + SS-S group (13.0 ± 0.4 ng/mL, P < 0.05). On the other hand, HFD + SS-Y group had the highest insulin among the salt-administered groups (17.2 ± 0.1 ng/mL) (Fig. 1B).

mRNA expression of adipogenic-/lipogenic- and β-oxidation-related factors in the liver and EAT

The hepatic expression of peroxisome proliferator-activated receptor gamma (PPARγ) in the Control was 4.04 fold higher than the Normal group, but its expression was suppressed in the HFD + SS-S (0.00 fold) and HFD + SS-T (0.53 fold) versus the Control. HFD + SS-Y adversely boosted its mRNA expression by 1.95 fold higher than the Control. The expression of fatty acid synthase (FAS), in comparison with the Control, was suppressed in the HFD + SS-T (0.33 fold), HFD + SS-S group (0.63 fold), while HFD + SS-Y and HFD + PS showed higher expression levels of 1.41 fold and 1.35 fold of Control, respectively. The strongest carnitine palmitoyltransferase type 1 (CPT-1) expression, in comparison with the Control to have its expression level of 0.35 fold of that in Normal, was observed in the HFD + SS-T group (4.40 folds) (Fig. 2A), followed by HFD + SS-S (2.68 folds) group. The expression level in HFD + PS group was the lowest among the salt-administered groups (0.68 fold) (Fig. 2A).
The strong suppression in expression of C/EBPα of EAT, in comparison with the Control (47.5 folds of Normal), occurred in the HFD + SS-T group (0.05 folds) and HFD + SS-S (0.37 fold). Conversely, HFD + SS-Y (1.23 fold) and HFD + PS group (2.19 folds) had higher expression levels than the Control. The lowest expression level of PPARγ, in comparison with the Control (16.5 folds of Normal), occurred in HFD + SS-T group (0.03 fold) and HFD + SS-S (0.29 fold). Conversely, HFD + PS (1.16 fold) and HFD + SS-Y (1.25 fold) groups had higher levels than Control (P < 0.05). In addition, the expression level of PPARα in Control was 0.84 fold that in Normal group. However, expression levels of HFD + SS-S and HFD + SS-T groups were higher than HFD + PS, HFD + SS-G and HFD + SS-Y (Fig. 2B).

Mineral composition of salt samples

The highest concentration of sodium was found in SS-Y (57.97 ± 1.21%), followed by PS (38.90 ± 0.56%) and SS-G (37.87 ± 0.72%). SS-T had the lowest concentration of sodium (30.30 ± 0.59%), followed by SS-S (34.61 ± 0.72%). The lowest potassium concentration was observed in SS-G (0.30 ± 0.00%), followed by PS (1.01 ± 0.02%), while the highest concentration of potassium was found in SS-Y (1.98 ± 0.03%), followed by SS-S (1.94 ± 0.01%) and SS-T (1.62 ± 0.02%). The Na/K ratio was the lowest in SS-S (17.81), followed by SS-T (18.69) and SS-Y (29.21), while SS-G had the highest (124.56) followed by PS (38.45) (Table 3).

DISCUSSION

Administration of solar salt samples from different salt fields resulted in different changes in body weight gain, FER, and weight of EAT. SS-S and SS-T suppressed those factors more strongly than SS-Y, PS and even SS-G. Weight gain suppression was stronger in the SS-T and SS-S groups than other salt groups, even surpassing Normal.
The food efficiency ratio (FER) can be used as a scale of obesity, and a low FER is a powerful predictor of reduction of obesity without possible anorectic activity [16]. It may thus be inferred that administration of Korean solar salt in a DIO model, especially HFD + SS-T and HFD + SS-S, suppresses weight gain and reduces serum lipid without changing dietary intake.
HFD-administered mice generally showed higher TG and TC concentration. Mice in HFD + SS-S and HFD-SS-T group, however, had significantly lower serum TG and TC concentration than Control. The present study shows that Korean solar salts, especially SS-S and SS-T, significantly reduced leptin and insulin concentrations, which suggests they may be able to suppress TG accumulation in adipose tissue by their unique chemical features. Clinically, high sodium intake is associated with a high serum leptin concentration, high serum insulin concentration, and insulin resistance [1920]. Owing to low sodium content and Na/K ratios, Korean solar salts may suppress the progress of obesity and eventually contribute to reductions in serum insulin concentrations. PPARγ is expressed in liver and adipose tissues, either alone or in cooperation with C/EBPα via a positive feedback mechanism, and induces the transcription of adipogenic genes like FAS [2122]. Therefore, reduction in expression of these factors is of high importance; fortunately, SS-T and SS-S produced that reduction. On the other hand, PPARα induces the transcription of β-oxidation-related factors such as CPT-1 [23]. Significant liver weight reduction was achieved in HFD + SS-T (2.1 ± 0.2 g; P < 0.05) and HFD-SS-S (2.2 ± 0.1 g; P < 0.05) in comparison with HFD-fed group (2.7 ± 0.1 g) (data not shown). Based on these findings, Korean solar salt, especially SS-S and SS-T, suppresses the expression of adipogenic- and lipogenic factors (PPARγ, C/EBPα, and FAS), promotes the expression of β-oxidative factors (PPARα and CPT-1), and reduces fat accumulation in the liver and EATs.
Rats on a high sodium diet (3.12% Na+) have more adipose tissue mass than those fed a normal sodium diet (0.5% Na+) [24]. A strong association exists between obesity and urinary Na/K ratio, and a high intake of sodium and a low intake of potassium are positively associated with a high total body fat percentage [25]. Solar salts in Korea, especially SS-S and SS-T, have a lower Na/K ratio than other solar salts, so these specific features of Korean solar salts might have partially contributed to anti-obesity action. The only difference made to the HFD was addition of salt at a concentration of 0.47%, which corresponds to the human dose of 5 grams per day. Oral administration of bamboo salt, which has more minerals than other salt samples, suppresses progression of obesity in vivo, reflected in reduced weight gain, lowered FER, suppressed expression of adipogenic factors, etc [13]. Conversely, it was reported that supplement of dietary sodium with a high-fat diet at a concentration higher than 1% suppresses weight gain by reduction in digestive efficiency, potentially due to suppression of rennin-angiotensin system [26]. Our in vitro research using 3T3-L1 adipocytes revealed that solar salt prepared with new concentrated salt water, instead of using mixture of new and recycled concentrated salt water, significantly suppressed gene expression of adipogenesis (C/EBPα, SREBP-1c) / lipogenesis (LPL, FAS) and promoted lipolysis (PPARα, CPT-1), even in the same salt field (data not shown).
Our future research will examine the differences among salts as well as the total mineral compositions and ratios, and processing methods of salt. Differences in salt fields seem to occur due to different manufacture methods, environmental factors surrounding salt fields, and chemical compositions including minerals and organic phytochemicals, etc. Also, we assume that turbitidy of concentrated salt water in Hae-Ju (temporary storage of concentrated salt water in the salt field) seems to change the patterns of crystallization, mineral composition, taste and functionality of solar salt. Thus, detailed investigation on mechanisms of functionality, as well as manufacturing methods and the active compounds of solar salt are needed in the near future.

Figures and Tables

Fig. 1

Changes in serum concentrations of (A) leptin and (B) insulin by administration of salt samples to diet-induced obese mice.

* Results are presented as means ± SDs (n = 3). a-d Means with the different letters on the bars are significantly different (P < 0.05) by Duncan's multiple range test.
nrp-10-629-g001
Fig. 2

Changes in mRNA expression of obesity-related factors in (A) liver and (B) EAT by administration of salt samples to diet-induced obese mice.

* Results are presented as means ± SDs (n = 3). a-g Means with the different letters on the bars are significantly different (P < 0.05) by Duncan's multiple range test.
nrp-10-629-g002
Table 1

Changes in body weight, food efficiency ratio, and EAT weight after treatment with solar salts

nrp-10-629-i001

* Values are presented as means ± SD (n = 10).

a-d Means with the different letters in each column are significantly different (P < 0.05) by Duncan's multiple range test.

NS Not significant.

1) Food efficiency ratio = 100 × {(weight of week 16) − (weight of week 1)} ÷ (total amount of feed consumed).

2) Normal: chow diet; Control: high-fat diet (HFD; 45% calories from fat); HFD + PS: HFD supplemented with 0.47% of purified salt; HFD + SS-G: HFD supplemented with 0.47% of solar salt from G Co.; HFD + SS-Y: HFD supplemented with 0.47% of solar salt from Y Co.; HFD + SS-T: HFD supplemented with 0.47% of solar salt from T Co.; HFD + SS-S: HFD supplemented with 0.47% of solar salt from S Co.

Table 2

Changes in triacylglycerol (TG) and total cholesterol (TC) induced by the 8-week administration of salt in an HFD

nrp-10-629-i002

* Values are presented as means ± SD (n = 10).

a-g Means with the different letters in each column are significantly different (P < 0.05) by Duncan's multiple range test.

Table 3

Mineral proportions of salt samples determined by ICP-OES

nrp-10-629-i003

* Values are presented as means ± SD (n = 3).

a-e Means with the different letters in each row are significantly different (P < 0.05) by Duncan's multiple range test.

NS Not significant.

1) PS: purified salt; SS-G: Guerande solar salt; SS-Y: solar salt from Y Co.; SS-T: solar salt from T Co.; SS-S1) PS: purified salt; SS-G: Guerande solar salt; SS-Y: solar salt from Y Co.; SS-T: solar salt from T Co.; SS-S: solar salt from S Co.: solar salt from S Co.

Notes

This work was supported by a grant 20130290 to Solar Salt Research Center of Mokpo National University from Ministry of Oceans and Fisheries of Korea.

CONFLICT OF INTEREST The authors declare no potential conflicts of interests.

References

1. Ha JO, Park KY. Comparison of mineral contents and external structure of various salts. J Korean Soc Food Sci Nutr. 1998; 27:413–418.
2. Lee HM, Lee WK, Jin JH, Kim IC. Physicochemical properties and microbial analysis of Korean solar salt and flower of salt. J Korean Soc Food Sci Nutr. 2013; 42:1115–1124.
crossref
3. Lee SM, Chang HC. Growth-inhibitory effect of the solar salt-doenjang on cancer cells, AGS and HT-29. J Korean Soc Food Sci Nutr. 2009; 38:1664–1671.
crossref
4. Park JW, Kim SJ, Kim SH, Kim BH, Kang SG, Nam SH, Jung ST. Determination of mineral and heavy metal contents of various salts. Korean J Food Sci Technol. 2000; 32:1442–1445.
5. Seo JH, Kim HJ, Lee SP. Evaluation of the chemical compositions of solar salts produced in Korea. Korean J Food Preserv. 2012; 19:554–559.
crossref
6. Zhao X, Kim SH, Qi Y, Kim SY, Park KY. Effects of different kinds of salt in the comutagenicity and growth of cancer cells. J Korean Soc Food Sci Nutr. 2012; 41:26–32.
crossref
7. Jung KO, Lee KY, Rhee SK, Park KY. Effects of various kinds of salt on the tumor formation, NK cell activity and lipid peroxidation in Sarcoma-180 cell transplanted mice. J Korean Assoc Cancer Prev. 2002; 7:134–142.
8. Ha JO, Park KY. Comparison of autooxidation rate and comutagenic effect of different kinds of salt. J Korean Assoc Cancer Prev. 1999; 4:44–51.
9. Lee KD, Gao TC, Bang MA, Cho JY, Ham KS. Effects of a mineral-rich solar salt on blood pressure in Dahl salt-sensitive rats. In : Congress of Korean Society of Food Preservation; 2008 Nov 7; Gwangju, Korea. Daegu: The Korean Society of Food Preservation;2008. p. 325–326.
10. Hida K, Wada J, Eguchi J, Zhang H, Baba M, Seida A, Hashimoto I, Okada T, Yasuhara A, Nakatsuka A, Shikata K, Hourai S, Futami J, Watanabe E, Matsuki Y, Hiramatsu R, Akagi S, Makino H, Kanwar YS. Visceral adipose tissue-derived serine protease inhibitor: a unique insulin-sensitizing adipocytokine in obesity. Proc Natl Acad Sci U S A. 2005; 102:10610–10615.
crossref
11. Kunitomi M, Wada J, Takahashi K, Tsuchiyama Y, Mimura Y, Hida K, Miyatake N, Fujii M, Kira S, Shikata K, Maknio H. Relationship between reduced serum IGF-I levels and accumulation of visceral fat in Japanese men. Int J Obes Relat Metab Disord. 2002; 26:361–369.
crossref
12. Mitchell M, Armstrong DT, Robker RL, Norman RJ. Adipokines: implications for female fertility and obesity. Reproduction. 2005; 130:583–597.
crossref
13. Ju J, Song JL, Park KY. Antiobesity effects of bamboo salt in C57BL/6 mice. J Med Food. 2015; 18:706–710.
crossref
14. Qi YC. Effect of bamboo salt on anti-skin aging and antitumor activities transplanted with sarcoma-180 cells in mice [master's thesis]. Busan: Pusan National University;2013.
15. Barnard TW, Crockett MI, Ivaldi JC, Lundberg PL, Yates DA, Levine PA, Sauer DJ. Solid-state detector for ICP-OES. Anal Chem. 1993; 65:1231–1239.
crossref
16. Choi HK, Won EK, Jang YP, Choung SY. Antiobesity effect of Codonopsis lanceolata in high-calorie/high-fat-diet-induced obese rats. Evid Based Complement Alternat Med. 2013; 2013:210297.
17. Horton JD, Bashmakov Y, Shimomura I, Shimano H. Regulation of sterol regulatory element binding proteins in livers of fasted and refed mice. Proc Natl Acad Sci U S A. 1998; 95:5987–5992.
crossref
18. Choi BH, Ahn IS, Kim YH, Park JW, Lee SY, Hyun CK, Do MS. Berberine reduces the expression of adipogenic enzymes and inflammatory molecules of 3T3-L1 adipocyte. Exp Mol Med. 2006; 38:599–605.
crossref
19. Baudrand R, Campino C, Carvajal CA, Olivieri O, Guidi G, Faccini G, Vöhringer PA, Cerda J, Owen G, Kalergis AM, Fardella CE. High sodium intake is associated with increased glucocorticoid production, insulin resistance and metabolic syndrome. Clin Endocrinol (Oxf). 2014; 80:677–684.
crossref
20. Winzell MS, Ahrén B. The high-fat diet-fed mouse: a model for studying mechanisms and treatment of impaired glucose tolerance and type 2 diabetes. Diabetes. 2004; 53:Suppl 3. S215–S219.
21. Gregoire FM, Smas CM, Sul HS. Understanding adipocyte differentiation. Physiol Rev. 1998; 78:783–809.
crossref
22. Shao D, Lazar MA. Peroxisome proliferator activated receptor gamma, CCAAT/enhancer-binding protein alpha, and cell cycle status regulate the commitment to adipocyte differentiation. J Biol Chem. 1997; 272:21473–21478.
crossref
23. Song S, Attia RR, Connaughton S, Niesen MI, Ness GC, Elam MB, Hori RT, Cook GA, Park EA. Peroxisome proliferator activated receptor alpha (PPARα) and PPAR gamma coactivator (PGC-1α) induce carnitine palmitoyltransferase IA (CPT-1A) via independent gene elements. Mol Cell Endocrinol. 2010; 325:54–63.
crossref
24. Jain N, Minhajuddin AT, Neeland IJ, Elsayed EF, Vega GL, Hedayati SS. Association of urinary sodium-to-potassium ratio with obesity in a multiethnic cohort. Am J Clin Nutr. 2014; 99:992–998.
crossref
25. Zhou MS, Nishida Y, Yoneyama H, Chen QH, Kosaka H. Potassium supplementation increases sodium excretion and nitric oxide production in hypertensive Dahl rats. Clin Exp Hypertens. 1999; 21:1397–1411.
crossref
26. Weidemann BJ, Voong S, Morales-Santiago FI, Kahn MZ, Ni J, Littlejohn NK, Claflin KE, Burnett CM, Pearson NA, Lutter ML, Grobe JL. Dietary sodium suppresses digestive efficiency via the renin-angiotensin system. Sci Rep. 2015; 5:11123.
crossref
TOOLS
Similar articles