Journal List > Nutr Res Pract > v.10(6) > 1050856

Kim, Choi, and Yoon: Nutritional quality of lunches consumed by Korean workers: Comparison between institutional and commercial lunches

Abstract

BACKGROUND/OBJECTIVES

The nutritional quality of lunches is an important factor related to workers' health. This study examined the nutritional quality of Korean workers' lunches with a focus on comparing institutional and commercial lunches.

SUBJECTS/METHODS

The data from a 1-day, 24-hour dietary recall from the 5th Korea National Health and Nutrition Examination Survey (2010-2012) were analyzed. A total of 2,192 subjects aged 19 to 64 years, who had consumed lunches served by institutional or commercial food service vendors, were included for analysis. The nutritional quality of the lunches of the institutional lunch group (n=626) and the commercial lunch group (n=1,566) was compared in terms of the number of servings, food groups, nutrient intake, Nutrient Adequacy Ratio (NAR), and Mean Adequacy Ratio (MAR).

RESULTS

The NAR and MAR were significantly higher in the institutional lunches than in the commercial lunches, but more than half of workers in both groups obtained over 65% of their energy from carbohydrate. The average sodium intake from the lunches exceeded the daily intake goal (2,000 mg) in both groups. More than half of workers in both groups presented less than one-third of their respective recommended daily intake of riboflavin and calcium. With the exception of riboflavin, the nutrient intake from lunches accounted for more than 35% of the daily nutrient intake.

CONCLUSIONS

The overall nutritional quality of institutional lunches was higher than that of commercial lunches. However, institutional lunches had room for improvement in terms of nutritional quality.

INTRODUCTION

Non-communicable diseases (NCDs) represent a growing public health problem in countries all around the world. Cancer, heart disease, cerebrovascular disease, and diabetes, which are the main types of NCDs, cause more than 50% of all deaths in Korea [1]. NCDs are not confined to a particular age group and should be managed throughout one's life.
The prevalence of obesity, hypertension, and dyslipidemia has increased sharply among Koreans in their 30s to 50s [2]. More than half of people in this age group in Korea have jobs [3] and spend the longest time at work among the Organization for Economic Cooperation and Development (OECD) countries [4]. Korean workers typically have little time for exercise and few opportunities to learn how to eat healthy [5]. In addition, higher prevalence of eating away from home among the employed compared to the unemployed [6] could be a promoting factor related to chronic disease [78].
A healthy diet can help prevent NCDs. An ecological framework for a person's diet indicates that a healthy diet requires the support from the person's physical environment (e.g. workplace, school) as well as individual effort [9]. Workplaces are effective places for delivering multiple levels of interventions and creating social norms for healthy eating because workplaces can offer easy access to food and information for many adults [10].
Few studies have examined meals at workplaces. Previous studies have largely concentrated on meals consumed away from home in total and have not separated meals at work from other meals away from home. Studies have reported low nutritional quality of meals away from home, higher intakes of energy, fat, sugar, and sodium, as well as lower intake of micronutrients compared to meals at home [111213]. In Korea, the contribution of fat from meals away from home to the total daily fat intake increased from 48.0% in 1998 to 53.2% in 2012. In addition, the sodium intake increased from 47.4% in 1998 to 55.9% in 2012 [14].
Lunch is characterized by the highest proportion of eating out among the three main meals [15], and more than three-quarters of workers reportedly eat institutional or commercial lunches in Korea [16]. One study indicated a contextual difference between workplace meals and restaurants, bars, and cafeterias, as the food served at these eateries is determined by customer demand [17]. In contrast, meals at workplaces, prepared by institutional food service, promote healthier food habits and present better nutritional quality than those at other eating places; workplace meals provide a lower proportion of fat energy and more fiber and micronutrients per unit energy [181920].
In Korea, few studies have focused on workers' nutritional intake from lunches [61521]. To establish a healthy diet environment, a comprehensive overview of food consumed by workers as well as the differences in nutritional quality between lunches prepared by institutional versus commercial food service vendors is necessary. The aim of this study was to examine workers' lunch intake and compare the nutritional quality of institutional and commercial lunches. The present study could provide baseline data for the development of healthy lunch guidelines for workers in Korea.

SUBJECTS AND METHODS

Data source and subjects

This study used the data from the 5th Korea National Health and Nutrition Examination Survey (KNHANES, 2010-2012), a nationwide cross-sectional survey using multistage stratified cluster sampling. This survey was approved by the Institutional Review Board (IRB) of the Centers for Disease Control and Prevention in Korea (2010-02CON-21-C, 2011-02CON-06-C, 2012-01EXP-01-2C).
A total of 6,901 workers, aged 19 to 64 years, having jobs other than farming or fishing were initially selected from 22,931 participants with 1-day, 24-hour dietary recall data. Those reporting an unusual dietary intake on the day of recall (n = 2,247), unrealistic lunch intake (< 166 kcal or > 1,666 kcal) (n = 419), and lunch intake at places other than workplaces or restaurants (n = 1,554) were excluded, resulting in 2,681 subjects. After an additional exclusion of those having reported eating lunch boxes prepared at home (n = 436) or meals served at institutional food service locations other than workplace food service (e.g., school food service, daycare food service, n = 53), 2,192 subjects were included in the final analysis.
Among the 2,192 subjects, “the institutional lunch group” included 626 subjects having eaten lunches prepared by the workplace food service. “The commercial lunch group” included 1,566 subjects having eaten commercially-prepared lunches, including lunch boxes and restaurant meals.

Analysis of menu items eaten at lunch

The menu items frequently consumed at lunch by workers were ranked. Initially, the ranking was generated based on the menu item names specified in the KNHANES dataset. Then the final ranking list was re-generated after combining some menu items into a single menu item with a generic name; for example, steamed rice with millet was combined into steamed rice with mixed grains and soybean paste soup with spinach was combined into soybean paste soup.

Assessment of food group intake from lunch

The amounts of food eaten were calculated and categorized into six major food groups: grains, meat/fish/eggs/legumes, vegetables, fruits, milk/dairy products, and oils/sweets. In addition, the food intake was classified into sub-food groups corresponding to each major food group. The sub-food groups used for analysis were based on the sub-food groups specified in the Dietary Reference Intake for Koreans 2015 (KDRIs 2015) [22], but were modified to include additional sub-food groups reflecting the current interest in a healthy diet [23] (e.g., grains other than white rice and green leafy vegetables).
The number of servings was calculated as the ratio of consumed food amounts to one serving amount of each food group. One serving amount was determined according to that specified in KDRIs 2015 [22]. KDRIs 2015 suggests one serving of each food group as the amount of food providing the following calories: grains, 300 kcal; meats (including meat, fish, eggs and legumes), 100 kcal; vegetables, 15 kcal; fruits, 50 kcal; dairy, 125 kcal; and oils/sweets, 45 kcal [22]. In addition, the percentage of subjects having consumed less than one serving amount of each respective food group was calculated.

Assessment of nutrient intake from lunch

The nutrient intake was assessed regarding energy, macronutrients (protein, fat, carbohydrate), along with the energy percentage from respective macronutrients, vitamins (vitamin A, thiamin, riboflavin, niacin, vitamin C), and minerals (calcium, iron, sodium). The average energy and nutrient intakes were calculated.
The Nutrient Adequacy Ratio (NAR) and Mean Adequacy Ratio (MAR) [24] were calculated for vitamin A, thiamin, riboflavin, niacin, vitamin C, calcium, and iron. The NAR of a given nutrient is the ratio of a subject's intake to the recommended nutrient intake (RNI). The NAR of the selected vitamins and minerals in this study was the ratio of the workers' intake to one-third of the RNI for each sex and age category in KDRIs 2015.
NAR of lunch=Actual nutrient intake at lunch1/3 of the Recommended Nutrient Intakenpr-10-606-e001
The NAR is truncated at one to avoid the potential problem that a nutrient with a high NAR could compensate for those with a low NAR. Thus, a NAR of one indicates that the intake of a nutrient is more than the RNI of a target nutrient, whereas a NAR below one indicates a lower nutrient intake than the RNI of a target nutrient. The MAR was obtained from the mean value of the NARs.
MAR of lunch=NAR of lunch(each truncated at )Number of nutrientsnpr-10-606-e002
In addition, the percentage of subjects having consumed less than one-third of the estimated average requirements (EAR) was calculated for each selected vitamin and mineral.
To examine the contribution of lunch to the daily intake, the daily intake of workers was assessed and the proportions of each nutrient from lunch compared to the daily intake were calculated. For macronutrients, the proportions of subjects consuming deficient, adequate, and excessive amounts were calculated. The acceptable macronutrient distribution ranges (AMDRs) suggested by KDRIs 2015 [22] were used for this determination: 7-20% for protein, 15-30% for fat, and 55-65% for carbohydrate. For protein and micronutrients, nutrient density (nutrient amount per 1,000 kcal) was calculated.

Statistical analysis

All statistical analyses were performed using SPSS (version 22.0; IBM Corp., Armonk, NY, USA). To make valid inferences for the KNHANES V complex multistage sampling design, the complex samples module was used for analysis, except for a calculation of the ranking of frequently consumed menu items. The data results were reported as the weighted %, mean values, and standard errors. The difference between the institutional lunch group and the commercial lunch group was tested for statistical significance using χ2 test or Analysis of Covariance (ANCOVA) with gender, age, occupation, and education level as the covariates based on previous studies [62526]. Vitamins and minerals were also adjusted for energy. The NAR and MAR were tested for statistical significance using ANCOVA with occupation and education level as covariates.

RESULTS

Sociodemographic characteristics of subjects

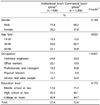
Among the 2,192 workers analyzed for lunch intake in this study, approximately 27% ate institutional lunches while the remaining 73% ate commercial lunches. There were significant differences between the institutional and commercial lunch groups in terms of age and occupation distribution, implying a need for further analyses of these variables (Table 1).

Menu items eaten at lunches

Table 2 lists the menu items frequently included in the lunches eaten by Korean workers. The menu items were listed based on the ranking among the nstitutional and commercial lunches, respectively. Among the institutional lunches, kimchi was ranked at the top, followed by steamed white rice. Kimchi was included in 75% of the institutional lunches. About 70% of the institutional lunches also included steamed white rice while about 22% included steamed rice with various grains. Soups were included in 44% of the institutional lunches. Soybean paste soup was ranked 3 and seaweed soup and soybean sprout soup were ranked 8.
Among the commercial lunches, kimchi and steamed white rice were ranked 1 and 2, respectively, the same as the institutional lunches. On the other hand, the percentage of the commercial lunches including these menu items was much lower than that of institutional lunches. The percentage of the commercial lunches with steamed white rice and steamed rice with various grains (65%) was also lower than that of the institutional lunches (92%). Danmuji, onions, unripened hot peppers, and samjang ranked in the top 15 in the commercial lunches, which was quite different from the case of the institutional lunches. For soups, soybean paste soup and kimchi stew were ranked 7 and 15, respectively. The percentage of the commercial lunches including soups was 17%, which was less than that of the institutional lunches. Seasoned soybean sprouts, seasoned spinach, toasted laver, and stir-fried dried anchovies were often included in both the institutional and commercial lunches.

Food group intake from lunch

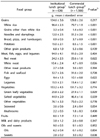
Table 3 shows the analysis results of Korean workers' lunch intake based on one serving amount for each food group. The average number of servings for each food group was not statistically different in the institutional and commercial lunch groups. There were significantly different percentages of workers consuming less than one serving of vegetables between the institutional (8%) and commercial (12%) groups.
Both the institutional and commercial lunch groups consumed about 1.4 servings of grains while about 18% of workers ate less than one serving of grains. The number of servings of meats consumed were 1.46 and 1.41, respectively, and the percentage of workers consuming less than one serving were 40% and 44% in the institutional and commercial lunch groups, respectively.
Table 4 compares the Korean workers' food intake by the food group between the institutional and commercial lunch groups. No significant difference in the intake of all six major food groups was observed between the institutional and commercial lunch groups. In terms of the sub-food groups, however, the institutional lunch group consumed more white rice, grains other than white rice, potatoes, and white meat as well as fewer noodles/dumplings and bread/pizza/hamburgers than the commercial lunch group.
The intake of vegetables was similar between both groups with an average intake of 153 g in the institutional group and 152 g in the commercial group. The average intake of fruits was low in the two groups (9 g and 7 g, respectively). The cumulative vegetable and fruit group intakes in the institutional and commercial groups were 162 g and 159 g, respectively.

Nutrient intake from lunch

Table 5 presents the Korean workers' nutrient intakes in the institutional and commercial lunch groups. The average energy intakes from institutional and commercial lunches were about 717 kcal and 703 kcal, respectively, and the difference was not statistically significant. The mean energy contribution from carbohydrate was about 65% in both groups and reached the upper limit of the AMDR of carbohydrate in KDRIs 2015.
The average intake of micronutrients except for sodium tended to be higher in the institutional lunches than in the commercial lunches, but the only significant difference between the two groups was for vitamin C. The average sodium intakes of the institutional and commercial lunch groups were 2,329 mg and 2,364 mg, respectively, both exceeding the daily sodium intake goal in KDRIs 2015.
The NARs of seven vitamins and minerals were calculated and compared between the two lunch groups (Table 6). The NARs of all selected nutrients in the institutional lunch group were higher than those in the commercial lunch group, and the differences were statistically significant. The NAR of calcium was the lowest number among the NARs of all nutrients in both groups. The MAR was also higher in the institutional lunch group (0.81) than in the commercial lunch group (0.77).
Fig. 1 shows graphically the percentages of Korean workers having consumed deficient amounts (i.e., less than one-third of EAR) of selected micronutrients in the institutional lunch and commercial lunch groups, respectively. More than half of all workers in the institutional lunch group and the commercial lunch group obtained less than one-third of the EARs of calcium and riboflavin from their lunches. The percentages of workers with deficient nutrient intake amounts were statistically higher for vitamin A, riboflavin, niacin, calcium, and iron in the commercial lunch group compared to the institutional lunch group.

Contribution of lunch to daily intake

Table 7 shows the contribution of Korean workers' lunches to the daily intake in each lunch group. The contribution of nutrients obtained from lunch to the daily intake differed depending on the nutrients and did not show significant differences between the two lunch groups. The energy intake from lunch accounted for approximately 35% of the daily energy intake in both groups. Among the nutrients, contribution of riboflavin intake from lunch to the daily intake was the lowest in both the institutional (34%) and commercial (34%) lunch groups. Sodium showed the highest percentage of nutrient intake from lunch to the daily intake: 42% in the institutional lunch group and 44% in the commercial lunch group.
The vitamin C intake, which showed a significant difference at lunch between the institutional and commercial lunch groups, showed no difference in the daily intake. On the other hand, the differences in daily intake of calcium and sodium between the two groups were statistically significant. The energy contribution from daily fat intake was significant lower in the institutional lunch group (19%) than in the commercial lunch group (20%).
The macronutrient intake status was judged by calculating the energy percentage of each macronutrient and comparing the two lunch groups, as shown in Fig. 2.
There was no significant difference in the distribution of energy percentages from each macronutrient at lunch. The daily fat and carbohydrate intakes, however, showed significantly higher proportions of workers with AMDRs in the institutional lunch group than in the commercial lunch group.
A comparison of lunch and daily intake showed that the daily intake had higher proportions of the AMDRs of protein and fat than the lunch. Approximately 41% of institutional lunch workers and 38% of commercial lunch workers consumed less than the AMDR of fat at lunch, indicating deficient fat intake, whereas less than 30% of both groups consumed less than the AMDR of fat in their daily intake. The proportions of workers consuming excessive carbohydrate were more than 50% in the lunch and daily intake.
Table 8 shows the nutrient densities of the protein and micronutrients of Korean workers' lunch and daily intakes according to the lunch groups. The differences in nutrient density between the two groups were statistically significant for protein, thiamin, and niacin at lunch as well as for the daily intakes of calcium and sodium.
The nutrient densities of protein, thiamin, niacin, and iron tended to be higher at lunch than in the daily intake. On the other hand, the nutrient densities of vitamin A, riboflavin, vitamin C, and calcium at lunch were lower than those of the daily intakes in the institutional lunch group.

DISCUSSION

This study examined the nutritional quality of lunches consumed by Korean workers by comparing the lunches eaten at their workplaces with those eaten at commercial places. With the exception of vitamin C, there was no significant difference in the average nutrient intake between the institutional and commercial lunch groups in this study. Other research on lunches eaten by Korean adults reported inconsistent results in terms of energy, protein, and other nutrient intakes between institutional and commercial lunch groups, but all studies reported similar results for fat intake between these two groups: a lower intake of fat in the institutional lunch group than in the commercial lunch group [61521]. One study reported a lower fat energy contribution from institutional lunches (18%) than from commercial lunches (20%) [15]. In the present study, however, the fat energy contribution in the institutional lunch group (18%) was similar to that in the commercial lunch group (19%). In addition, the proportion of workers who consumed less than the AMDR of fat was around 40% in the present study, which was higher than the proportion reported in a previous study with Korean adults aged 19 years or above (33%) [27]. A comparison of the fat energy percentage of commercial foods by meal revealed the fat energy percentage of lunch to be the lowest: breakfast (22%), lunch (20%), and dinner (23%) [15]. Thus, the fat content of lunch does not appear to have been a major nutritional consideration for Korean workers recently.
Although there was no significant difference in the average intake of most nutrients between the two groups in the present study, the average NARs of all selected vitamins and minerals as well as the MAR of institutional lunches were significantly higher than those of the commercial lunches. The proportions of workers with deficient intakes of vitamin A, riboflavin, niacin, calcium, and iron in the institutional lunch group were also lower than those in the commercial lunch group, which indicates the better nutritional quality of institutional lunches compared to commercial lunches. The lower NAR and MAR of commercial lunches showing no difference in the average nutrient intake could be explained by the skewed distribution of nutrient intakes in the commercial lunch group.
The improved nutritional quality in the institutional lunch group could be explained by the more frequent inclusion of Korean traditional style meals in institutional lunches. The menu items most frequently eaten at lunch in this study were kimchi and steamed white rice, which are the key dishes in Korean traditional style meals. The proportions of consumed kimchi and steamed rice were substantially higher in the institutional lunch group (75% and 92%) than in the commercial lunch group (57% and 65%), indicating the greater consumption of Korean traditional style meals in institutional lunches. These results are also supported by differences in the intake of sub-food groups belonging to grains between the institutional and commercial lunch groups. A greater consumption of white rice and grains other than white rice as well as less intake of noodles/dumplings and bread/pizza/hamburgers were found in the institutional lunch group compared to the commercial lunch group. The average number of servings of each food group was similar in the two lunch groups but the commercial lunch group showed a higher percentage of workers that consumed less than one serving of foods from vegetables. Korean traditional style meals with various side dishes are typically balanced with high nutritional quality [28]. Thus, the consumption of lunches based on Korean traditional style meals with various side dishes is recommended to improve the nutritional quality of workers' lunches.
Although the institutional lunch group showed better nutritional quality than the commercial group, more than 50% of workers displayed deficient intakes of riboflavin and calcium as well as excessive intakes of sodium and carbohydrate in the institutional lunch group. The inadequate intakes of riboflavin and calcium as well as the excessive intakes of sodium and carbohydrate in Korean adults have frequently been reported in other studies [2930]. Although the results indicate that institutional lunches contain higher nutritional quality than commercial lunches, the quality of institutional lunches is insufficient to improve the various nutritional problems of workers. Institutional food services should consider these results in menu planning and development.
The NAR of calcium in the two groups was the lowest among the NARs of selected vitamins and minerals in this study, followed by riboflavin. The low intakes of milk and dairy products in institutional (3.8 g) and commercial (2.6 g) lunches could explain this result. The inclusion of milk or dairy products as an ingredient in a dish or dessert at lunch could be a strategy to increase the nutritional quality of calcium and riboflavin in lunches for workers.
The sodium intakes of both groups in this study exceeded the daily sodium intake goal in KDRIs 2015, with no difference between the institutional (2,329 mg) and commercial (2,364 mg) lunch groups. Kimchi and soup, which are major dishes contributing to the dietary sodium intake [31], were listed in the top 15 menu items in the present study. Several studies have suggested strategies to reduce sodium intake, including education of consumers and development of low sodium dishes and foods [323334]. In other countries, governments have developed dietary standards for institutions or cafeterias as a strategy to reduce the sodium intake in workplaces [3536]. To reduce sodium intake, it will be necessary to develop sodium standards for Korean traditional style meals as well as to develop low sodium dishes and foods.
The energy contribution of carbohydrate in both groups of this study reached 65%, which is the upper limit of the AMDR of carbohydrate. More than half of the workers in both groups had excessive carbohydrate intake. The KDRI 2015 changed the upper limit of the AMDR of carbohydrate from 70% to 65%, reflecting the positive relationship of carbohydrate intake with the risk of metabolic syndrome [22]. In addition, the current evidence on healthy diets recommended a greater emphasis on carbohydrate quality [23]. Management of the amounts and quality of carbohydrate in workers' lunches is necessary. Higher amounts of rice with various grains or whole grains to increase carbohydrate quality and less use of side dishes and desserts, including processed grains, such as flour or rice cakes, could be considered in meal planning.
Vegetables and fruits are important food components for a healthy diet [23]. The results of this study indicated a higher intake of vegetables and fruits (162 g in the institutional lunch group and 159 g in the commercial lunch group) than one-third of the amounts (458 g) reported by a previous study search on daily vegetable and fruit consumption among Korean adults [37]. These intakes, however, were less than one-third of the daily goal for vegetable and fruit intake (500 g) recommended by the National Health Plan 2020 [38]. In addition, skipping breakfast can lead to a low intake of vegetables [39]. As a high proportion of Korean adults skip breakfast (approximately 23%) [27], the consumption of around 160 g of vegetables and fruits at lunch may be inadequate to meet the daily vegetable and fruit intake goals. Research has shown that more than 50% of Korean adults do not follow dietary guidelines regarding the intake of vegetables and fruits [3740]. Therefore, intervention through institutional food service could be an effective strategy to satisfy the daily vegetable and fruit intake goals for workers. This strategy was verified by various studies that implemented interventions aimed at increasing the vegetable and fruit consumption through institutional food service [1041]. The results of these studies showed that interventions at lunch improved the workers' daily nutritional profiles as well as the quality of their lunches [1842].
In the results of the present study, the nutrient intake from lunches consumed by Korean workers accounted for more than 35% of the daily nutrient intake except for riboflavin (approximately 34%). This value was higher than that of a previous study, which reported a 30% energy contribution from lunch to the daily intake [4344]. The nutrient densities of protein, thiamin, niacin, and iron tended to be higher at lunch than in the daily intake in both lunch groups. In addition, the percentages of workers with deficient intakes of these nutrients from lunch were less than 30% in both lunch groups. These results indicate that lunch could compensate for the insufficient intakes during other meal times. Nevertheless, the lower nutrient densities of vitamin A, riboflavin, vitamin C, and calcium at lunch compared to the daily intake in the institutional lunch group suggests that the current Korean workers' institutional lunches are insufficient to improve the daily intake.
In conclusion, this investigation of Korean workers' lunches confirmed the better nutritional quality of institutional lunches with higher NARs and MAR as well as lower proportions of workers with deficient nutrient intakes compared to commercial lunches. Institutional lunches, however, contained nutritional problems, such as excessive energy from carbohydrate, excessive sodium, and insufficient riboflavin and calcium. Workplace food service managed by dietitians could provide an effective environment to improve the nutrition and health status of workers. More focus on the nutritional quality of meals served by institutional food service will be needed to manage the nutritional shortfalls of workers' lunches and daily meals.
As the current study assessed the nutritional quality of workers' lunches using one-day dietary recall data, the results might not reflect the subjects' usual dietary intake. In addition, the results of this study should be interpreted with caution because the data only reflects what the subjects ate and not what was served or offered to them at lunches. Further studies regarding the nutritional quality of meals served by workplace food service or commercial food service could provide additional information to make policy decisions or guidelines on healthy lunches for workers.

Figures and Tables

Fig. 1

Proportions of Korean workers with deficient nutrient intake from lunches according to the type of food service

The data were analyzed using the complex sample module.
The values are the percentages of people with nutrient intake less than 1/3 of the estimated average requirement.
1) Workers eating lunches served at workplace food service
2) Workers eating commercially-prepared lunches, including lunch boxes and restaurant meals
** Significantly different between lunch groups at α = 0.01 by χ2 test
*** Significantly different between lunch groups at α = 0.001 by χ2 test
nrp-10-606-g001
Fig. 2

Distritubtion of Korean workers' macronutrient intake status according to the type of food service

The data were analyzed using the complex sample module.
Deficient: < 7% of energy intake from protein, < 15% of energy intake from fat, < 55% of energy intake from carbohydrate
Adequate: 7-20% of energy intake from protein, 15-30% of energy intake from fat, 55-65% of energy intake from carbohydrate
Excessive: > 20% of energy intake from protein, > 30% of energy intake from fat, > 65% of energy intake from carbohydrate
1) Workers eating lunches served at workplace food service
2) Workers eating commercially-prepared lunches, including lunch boxes and restaurant meals
* Significantly different between lunch groups at α = 0.05 by χ2 test
*** Significantly different between lunch groups at α = 0.001 by χ2 test
nrp-10-606-g002
Table 1

Sociodemographic characteristics of the subjects according to the type of food service

nrp-10-606-i001

The data were analyzed using the complex sample module.

1) Workers eating lunches served by their workplace food service

2) Workers eating commercially-prepared lunches, including lunch boxes and restaurant meals

3) By χ2 test

Table 2

Frequent menu items in Korean workers' lunches according to the type of food service

nrp-10-606-i002

1) Workers eating lunches served by their workplace food service

2) Workers eating commercially-prepared lunches, including lunch boxes and restaurant meals

Table 3

Number of servings consumed at lunch by Korean workers and percentages of Korean workers consuming less than one serving for food groups according to the type of food service

nrp-10-606-i003

The data were analyzed using the complex sample module.

The values were adjusted for gender, age, occupation, and education level.

One serving is the amount of foods providing 300 kcal for grains, 100 kcal for meats, 15 kcal for vegetables, 50 kcal for fruits, 125 kcal for dairy, and 45 kcal for oils/sweets.

1) Workers eating lunches served by workplace food service

2) Workers eating commercially-prepared lunches, including lunch boxes and restaurant meals

3) By ANCOVA with gender, age, occupation, and education level as covariates or χ2 test

4) The ratio of consumed food amount to one serving of each food group

5) Includes meat, fish, eggs, and legumes

Table 4

Food group intake of Korean workers' lunches according to the type of food service

nrp-10-606-i004

The data were analyzed using the complex sample module.

The values were adjusted for gender, age, occupation, and education level.

1) Workers eating lunches served by workplace food service

2) Workers eating commercially-prepared lunches, including lunch boxes and restaurant meals

3) By ANCOVA with gender, age, occupation, and education level as covariates

Table 5

Nutrients intake of Korean workers' lunches according to the type of food service

nrp-10-606-i005

The data were analyzed using the complex sample module.

The values were adjusted for gender, age, occupation, and education level.

1) Workers eating lunches served by workplace food service

2) Workers eating commercially-prepared lunches, including lunch boxes and restaurant meals

3) By ANCOVA with gender, age, occupation, and education level as covariates. For vitamins and minerals, by ANCOVA with energy, gender, age, occupation, and education level as covariates.

Table 6

Nutrient Adequacy Ratio and Mean Adequacy Ratio of Korean workers' lunches according to the type of food service

nrp-10-606-i006

The data were analyzed using the complex sample module.

The values were adjusted for occupation and education level.

1) Workers eating lunches served at the workplace food service

2) Workers eating commercially-prepared lunches, including lunch boxes and restaurant meals

3) By ANCOVA with occupation and education level as covariates

NAR, Nutrient Adequacy Ratio; MAR, Mean Adequacy Ratio

Table 7

Contribution of Korean workers' lunch to daily intake according to the type of food service

nrp-10-606-i007

The data were analyzed using the complex sample module.

The values were adjusted for gender, age, occupation, and education level.

1) Workers eating lunches served by workplace food service

2) Workers eating commercially-prepared lunches, including lunch boxes and restaurant meals

3) By ANCOVA with gender, age, occupation, and education level as covariates. For vitamins and minerals, by ANCOVA with energy, gender, age, occupation, and education level as covariates.

Table 8

Nutrient density of Korean workers' lunch and daily intakes according to the type of food service

nrp-10-606-i008

The data were analyzed using the complex sample module.

The values were adjusted for gender, age, occupation, and education level.

1) Workers eating lunches served by workplace food service

2) Workers eating commercially-prepared lunches, including lunch boxes and restaurant meals

3) By ANCOVA with gender, age, occupation, and education level as covariates. For vitamins and minerals, by ANCOVA with energy, gender, age, occupation, and education level as covariates.

Notes

CONFLICT OF INTEREST The authors declare no potential conflicts of interests.

References

1. Statistics Korea. Deaths and death rates by cause [Internet]. Daejeon: Statistics Korea;2015. cited 2016 March 18. Available from: http://kosis.kr/ups/ups_01List.jsp.
2. Ministry of Health and Welfare, Korea Centers for Disease Control and Prevention. Korea Health Statistics 2014: Korea National Health and Nutrition Examination Survey (KNHANES VI-2). Sejong: Korea: Centers for Disease Control and Prevention;2015.
3. Statistics Korea. Annual report of employment: 2014 [Internet]. Daejeon: Statistics Korea;2015. cited 2016 March 18. Available from: http://kosis.kr/ups/ups_01List.jsp.
4. Kim YS. The necessity and significance of reducing working hours [Internet]. Seoul: Lavour and Society Institute;2016. cited 2016 April 16. Available from: http://klsi.org/content/8436.
5. Jang MR, Hong WS. Nutrition service need assessment for industrial employees. J Korean Diet Assoc. 2000; 6:26–32.
6. Chung SJ, Kang SH, Song SM, Ryu SH, Yoon J. Nutritional quality of Korean adults' comsumption of lunch prepared at home, commercial places and institutions: analysis of the data from the 2001 National Health and Nutrition Survey. Korean J Nutr. 2006; 39:841–849.
7. Bezerra IN, Sichieri R. Eating out of home and obesity: a Brazilian nationwide survey. Public Health Nutr. 2009; 12:2037–2043.
crossref
8. Naska A, Orfanos P, Trichopoulou A, May AM, Overvad K, Jakobsen MU, Tjønneland A, Halkjær J, Fagherazzi G, Clavel-Chapelon F, Boutron-Ruault MC, Rohrmann S, Hermann S, Steffen A, Haubrock J, Oikonomou E, Dilis V, Katsoulis M, Sacerdote C, Sieri S, Masala G, Tumino R, Mattiello A, Bueno-de-Mesquita HB, Skeie G, Engeset D, Barricarte A, Rodríguez L, Dorronsoro M, Sánchez MJ, Chirlaque MD, Agudo A, Manjer J, Wirfält E, Hellström V, Shungin D, Khaw KT, Wareham NJ, Spencer EA, Freisling H, Slimani N, Vergnaud AC, Mouw T, Romaguera D, Odysseos A, Peeters PH. Eating out, weight and weight gain. A cross-sectional and prospective analysis in the context of the EPIC-PANACEA study. Int J Obes (Lond). 2011; 35:416–426.
crossref
9. Story M, Kaphingst KM, Robinson-O'Brien R, Glanz K. Creating healthy food and eating environments: policy and environmental approaches. Annu Rev Public Health. 2008; 29:253–272.
crossref
10. Sorensen G, Linnan L, Hunt MK. Worksite-based research and initiatives to increase fruit and vegetable consumption. Prev Med. 2004; 39:Suppl 2. S94–S100.
crossref
11. Lachat C, Nago E, Verstraeten R, Roberfroid D, Van Camp J, Kolsteren P. Eating out of home and its association with dietary intake: a systematic review of the evidence. Obes Rev. 2012; 13:329–346.
crossref
12. Naska A, Katsoulis M, Orfanos P, Lachat C, Gedrich K, Rodrigues SS, Freisling H, Kolsteren P, Engeset D, Lopes C, Elmadfa I, Wendt A, Knüppel S, Turrini A, Tumino R, Ocké MC, Sekula W, Nilsson LM, Key T, Trichopoulou A. HECTOR Consortium. Eating out is different from eating at home among individuals who occasionally eat out. A cross-sectional study among middle-aged adults from eleven European countries. Br J Nutr. 2015; 113:1951–1964.
crossref
13. Guthrie JF, Lin BH, Frazao E. Role of food prepared away from home in the American diet, 1977-78 versus 1994-96: changes and consequences. J Nutr Educ Behav. 2002; 34:140–150.
crossref
14. Kwon YS, Ju SY. Trends in nutrient intakes and consumption while eating-out among Korean adults based on Korea National Health and Nutrition Examination Survey (1998-2012) data. Nutr Res Pract. 2014; 8:670–678.
crossref
15. Kwon YS, Park YH, Choe JS, Yang YK. Investigation of variations in energy, macronutrients and sodium intake based on the places meals are provided: using the Korea National Health and Nutrition Examination Survey (KNHANES, 1998-2009). Nutr Res Pract. 2014; 8:81–93.
crossref
16. Wang H, Lee SR. Well-being orientation, consumer needs for lunch, and lunch behaviors. J Hum Life Sci. 2012; 15:99–119.
17. Vandevijvere S, Lachat C, Kolsteren P, Van Oyen H. Eating out of home in Belgium: current situation and policy implications. Br J Nutr. 2009; 102:921–928.
crossref
18. Roos E, Sarlio-Lähteenkorva S, Lallukka T. Having lunch at a staff canteen is associated with recommended food habits. Public Health Nutr. 2004; 7:53–61.
crossref
19. O'Dwyer NA, Gibney MJ, Burke SJ, McCarthy SN. The influence of eating location on nutrient intakes in Irish adults: implications for developing food-based dietary guidelines. Public Health Nutr. 2005; 8:258–265.
20. Raulio S, Roos E, Prättälä R. School and workplace meals promote healthy food habits. Public Health Nutr. 2010; 13:987–992.
crossref
21. Song YJ. The pattern of eating out among Korean adults from 4th Korea National Health and Nutrition Examination Survey. Public Health Wkly Rep. 2010; 3:597–602.
22. Ministry of Health and Welfare (KR). The Korean Nutrition Society. Dietary Reference Intakes for Koreans 2015. Sejong: Ministry of Health and Welfare;2016.
23. Willett WC, Stampfer MJ. Current evidence on healthy eating. Annu Rev Public Health. 2013; 34:77–95.
crossref
24. Guthrie HA, Scheer JC. Validity of a dietary score for assessing nutrient adequacy. J Am Diet Assoc. 1981; 78:240–245.
crossref
25. Vlismas K, Stavrinos V, Panagiotakos DB. Socio-economic status, dietary habits and health-related outcomes in various parts of the world: a review. Cent Eur J Public Health. 2009; 17:55–63.
crossref
26. Choi MK, Kim JM, Kim JG. A study on the dietary habit and health of office workers in Seoul. Korean J Food Cult. 2003; 18:45–55.
27. Korean Health Industry Development Institute. National Food & Nutrition Statistics: based on 2012 Korea National Health and Nutrition Examination Survey. Cheongju: Korean Health Industry Development Institute;2014.
28. Seo JS, Cho SH. Rice-based traditional meal and prevention of chronic diseases. Food Ind Nut. 2008; 13:27–33.
29. Kim DW, Shim JE, Paik HY, Song WO, Joung H. Nutritional intake of Korean population before and after adjusting for within-individual variations: 2001 Korean National Health and Nutrition Survey Data. Nutr Res Pract. 2011; 5:266–274.
crossref
30. Kim MS, Kweon DC, Bae YJ. Evaluation of nutrient and food intake status, and dietary quality according to abdominal obesity based on waist circumference in Korean adults: based on 2010-2012 Korean National Health and Nutrition Examination Survey. J Nutr Health. 2014; 47:403–415.
crossref
31. Song DY, Park JE, Shim JE, Lee JE. Trends in the major dish groups and food groups contributing to sodium intake in the Korea National Health and Nutrition Examination Survey 1998-2010. Korean J Nutr. 2013; 46:72–85.
crossref
32. Lee YK. A Study on a Scheme to Reduce Sodium Intake. Seoul: Korea Health Promotion Foundation;2006.
33. Shin EK, Lee HJ, Jun SY, Park EJ, Jung YY, Ahn MY, Lee YK. Development and evaluation of nutrition education program for sodium reduction in food service operations. Korean J Community Nutr. 2008; 13:216–227.
34. Lee YN, Kim CI, Shin HH, Nam JW, Lee JY, Kim DH, Lee HJ, Koh EM, Yon MY. Project to Reduce Sodium Intake - Trends of Technics for Reducing Sodium Contents in Processed Foods and Development of Guidelines. Cheongwon: Korea Health Industy Development Institute;2012.
35. National Center for Chronic Disease Prevention and Health Promotion. Division for Heart Disease and Stroke Prevention (US). Under pressure: prevention strategies for sodium reduction in worksites [Internet]. Atlanta(GA): Centers for Chronic Disease Prevention;2012. cited 2016 June 6. Available from: http://www.cdc.gov/salt/pdfs/sodium_reduction_worksites.pdf.
36. Lederer A, Curtis CJ, Silver LD, Angell SY. Toward a healthier city: nutrition standards for New York City government. Am J Prev Med. 2014; 46:423–428.
37. Kwon JH, Shim JE, Park MK, Paik HY. Evaluation of fruits and vegetables intake for prevention of chronic disease in Korean adults aged 30 years and over: using the third Korea National Health and Nutrition Examination Survey(KNHANES III), 2005. Korean J Nutr. 2009; 42:146–157.
crossref
38. Ministry of Health and Welfare (KR). National Health Plan 2020. Seoul: Ministry of Health and Welfare;2011.
39. Min C, Noh H, Kang YS, Sim HJ, Baik HW, Song WO, Yoon J, Park YH, Joung H. Skipping breakfast is associated with diet quality and metabolic syndrome risk factors of adults. Nutr Res Pract. 2011; 5:455–463.
crossref
40. Baek Y, Joung H, Shin S. The association between vegetable intake and marital status in Korean adults aged 30 years and over: based on the 2007~2010 Korea National Health and Nutrition Examination Survey. J Nutr Health. 2015; 48:192–198.
crossref
41. Lassen A, Thorsen AV, Trolle E, Elsig M, Ovesen L. Successful strategies to increase the consumption of fruits and vegetables: results from the Danish '6 a day' Work-site Canteen Model Study. Public Health Nutr. 2004; 7:263–270.
crossref
42. Lachat CK, Verstraeten R, De Meulenaer B, Menten J, Huybregts LF, Van Camp J, Roberfroid D, Kolsteren PW. Availability of free fruits and vegetables at canteen lunch improves lunch and daily nutritional profiles: a randomised controlled trial. Br J Nutr. 2009; 102:1030–1037.
crossref
43. Shim JE, Paik HY, Moon HK, Kim YO. Comparative analysis and evaluation of dietary intakes of Koreans by age groups: (5) meal patterns. J Korean Home Econ Assoc. 2004; 42:169–185.
44. Moon HK, Kim EG. Nutrient and food intake of Koreans by the economic status and meal pattern using 1998 Korean National Health Examination Nutrition Survey. Korean J Nutr. 2004; 37:236–250.
TOOLS
Similar articles