

 PDF
PDF ePub
ePub Citation
 Print
Print


INTRODUCTION
Constipation is a condition that can result from intestinal deformation. Because humans have an upright posture, the effects of gravity can cause this shape deformation [123]. Regular bowel movements are a sign of good intestinal health. Symptoms of constipation include bowel movements occurring less than three times per week; a small amount of feces; difficult and painful bowel movements; and hard, dry feces and not a cool feeling after the bowel movement [4]. Constipation symptoms have been reported to be more common in women, especially in elderly women [56]. About 26% of men and 32% of women aged 65 years and older have constipation symptoms, and the aging population is increasing. The colon extends because of advanced age and dissonance occurs because the partial pressure within the colon decreases its mobility. Therefore, the time to pass through the large intestine varies along with worsening of the constipation by other factors. Laxatives are used as a palliative treatment in senile constipation. However, the use of laxatives can initiate a vicious cycle, i.e., laxative abuse → damage to the colonic nervous system → decrease in bowel movements → colon extension → aggravation of constipation → laxative abuse [78]. The increased use of emollients in constipation cause adverse effects such as colon lethargy. Thus, the development and use of functional foods to mitigate senile constipation with no adverse effects are urgently needed. Probiotics are one of the functional health foods that are closely related to colon health. Oligosaccharides are common probiotics and their effects on bowel health are well known [9]. However, studies of the physiological functionality of a product that contains both lactulose and galactooligosaccharides are insufficient. Furthermore, although the demand for products for use in the elderly is increasing worldwide, product development is still insufficient.
Therefore, this study investigated the functional effect of Dual-Oligo, which contains both lactulose and galactooligosaccharides, for alleviation of constipation symptoms. Additionally, our study suggests the possibility of new functional oligosaccharides for use in senile constipation.
MATERIALS AND METHODS
Animals and reagents
Sprague-Dawley rats (n = 32) with an average weight of 170 g were purchased from Deahan Biolink (Seoul, South Korea) and were maintained in animal facilities at Korea University (Seoul, South Korea) after adaptation for 1 week. Each rat was kept in a specific pathogen-free room at 20–22℃ with a relative humidity of 50–55% under 12 h day/night cycles; a standard maintenance diet (Purina rodent chow) and water were freely provided in a wire bottomed cage (Jeung do Bio & Plant Co., Ltd. Seoul, Korea) for 25 days. All experiments were performed under protocols approved by The Institutional Animal Care and Use Committee in Korea University (KUIACUC-2015-102).
Dual-Oligo samples were provided by Neo Cremar Co., Ltd. (Seoul, Korea). The Dual-Oligo was composed of 51.67% lactulose, 14.22% lactose, 15.8% galactooligosaccharides, 12.32% of a mixture of glucose and galactose, and 5.99% of other ingredients. Loperamide and all chemicals were of reagent grade and were purchased from Sigma-Aldrich (St. Louis, MO, USA).
Experimental animal groups
Animals were randomly divided into four groups, the normal group (normal), control group (control), low concentration of Dual-Oligo (LDO) group, and high concentration of Dual-Oligo (HDO) group. There were 8 animals assigned to each group. The normal group and control group received only water for 36 days. The LDO group received water that contained 10% Dual-Oligo, and the HDO group received water containing 15% Dual-Oligo for 36 days. Constipation was induced with the administration of loperamide in the control, LDO, and HDO groups. The rats were injected subcutaneously with 4 mg/kg of body weight of loperamide in saline solution twice per day at 09:00 and 18:00 for 7 days (tested until 29 to 35 days).
Body weight gain, food intake, and food efficiency ratio
We measured body weight gain and food intake during the experiment prior to inducing constipation (0-28 days) by using loperamide on day 7 of the experiment. After inducing constipation (29-35 days), we measured body weight and food intake every day during the experiment. Food efficiency was calculated by dividing the dietary intake amount during the same period of weight gain during the treatment period.
Number of fecal pellets, weight of fecal pellets, and fecal water content
Number of fecal pellets and wet weight of fecal pellets were measured, and fecal water content of animals were calculated in two parts, the period prior to inducing constipation with loperamide (0–28 days), and the period after inducing constipation (29–35 days). After inducing constipation, fecal samples were collected every day during the collection period (29–35 days). We calculated the changes in fecal pellets, fecal pellet weight, and fecal water content. The water content was determined by drying the fecal pellets at 70℃ for 24 hours in an oven and calculating the difference between the weight before drying and the weight after drying.
Intestinal transit ratio
The movement rate of Dual-Oligo in the intestinal tract was determined by modifying the method of Yu et al. [10] Dual-Oligo was dissolved in drinking water prior to the oral challenge with 1 mL of charcoal meal (8% charcoal). After 30 min, the rat was sacrificed and the intestinal tract was excised. The distance traveled by the charcoal meal from the pylorus was measured and was expressed as a percentage of the total length of the small intestine from the gastropyloric junction to the ileocecal junction, where
T (%) = B / A × 100
T: the intestinal tract ratio of charcoal
A: total length of intestinal tract
B: moving distance of the most distal end portion of the charcoal
Serum lipids
To analyze triglycerides, total cholesterol, and HDL cholesterol content, the rats were anesthetized and blood was collected from the abdominal vein via laparotomy on the last day of the experiment. Serum was collected from the blood by centrifugation and was analyzed using an automated serum analyzer (Dri-chem 3500i, Fujifilm, Tokyo, Japan). Serum triglycerides, total cholesterol, and HDL cholesterol content from Fujifilm's measurements were analyzed using TG-0024, TCHO-0222, and HDL-0233.
Concentration of short-chain fatty acids (SCFAs)
In order to measure the amount of short-chain fatty acids (SCFAs), we collected feces samples. One gram of feces was extracted with 5 mL of methanol in a conical tube and stored at −60℃ until use. The extracted sample was filtered through a 0.45-µm Millipore filter (Millipore, USA). The filtrate was analyzed using a DB-FFAP 123-3253 (50 m × 0.32 mm× 0.50 µM), a flame ionization detector, and an autosampler (HT 300, Toung-Lin Co.) equipped with a GC system gas chromatograph system (YL-6100 GC system, Yong-Lin Co., Korea). The injection amount of the sample (1 µL), inlet and detector temperatures of 200℃ and 240℃, respectively, and analysis conditions were set according to Demigne et al. [11] Contents of acetic acid, propionic acid and butyric acid were evaluated by constructing a calibration curve using the respective standard reagent.
Bifidobacteria counts
Dual-Oligo was used to determine the the growth of bifidobacteria in the contents of the cecum. One gram of cecal contents was homogenized and mixed with 9 mL of sterile pepton water and decimal dilutions. Bifidobacteria were cultured using BS agar (BD Difico), a medium for selection of Bifidobacterium [12]. The diluted sterile solution (200 µL) was smeared onto the culture medium and placed in an incubator at 37℃ for 72 h for anaerobic incubation. After incubation, the colonies were counted. The dilution factor multiplied by the number of bacteria per 1 g of feces was expressed as Log10 (colony forming units [CFU])/g cecal contents.
Alcian Blue-PAS staining of intestinal epithelial cells
The tissue segments of the distal colon was embedded in paraffin and tissue sections (4 µm) were deparaffinized with xylene. After deparaffinization, the tissues were treated with ethanol concentrations of 100, 90, 80, and 70% for 5 minutes. Then, the samples were stained with Alcian blue for 30 minutes and rinsed with water. After rinsing, the tissues were stained with nuclear fast red solution for 30 seconds and re-dehydrated with ethanol concentrations of 70, 80, 90, and 100%. Then, the tissues were dehydrated, washed, and sealed using xylene. Alcian blue-positive intestinal mucosa cells were observed with an optical microscope (ZEISS, Axiovert S100, Germany).
Statistical analysis
All statistical analyses were performed using the Statistical Package for Social Sciences, version 12.0 (SPSS Inc., Chicago, IL, USA). An analysis of variance (ANOVA) was performed, and the differences among samples were determined using Duncan's multiple range tests at a significance level of P < 0.05. All data were at the 95% significance level and are reported as the mean ± SD.
RESULTS
Body weight gain, food intake, and food efficiency ratio in experimental animals
The weight gain, food intake, and food efficiency of each group after inducing constipation are shown in Table 1. After inducing constipation, the food intake of the LDO group (40.28 g/day) was significantly lower than that of the other groups (P < 0.05). However, the food efficient ratio (FER) of the LDO group after inducing constipation was not significantly different from that of the other groups. Body weight gain in the LDO group was also not significantly different from that of the other groups.
Number of fecal pellets, wet weight of fecal pellets, and fecal water content of experimental animals
Results of number of fecal pellets, wet weight of fecal pellets, and fecal water content are shown in Table 2. Fecal pellet number after inducing constipation in the normal and HDO groups (50.60 and 45.80 count/day, respectively) was significantly different from that of the control group (35.67 count/day). Fecal water content of LDO group was different from that of the control and normal groups. However, there was not a significant difference in the weight of fecal pellets between the LDO and HDO groups.
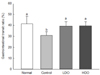
To investigate the role of Dual-Oligo in improvement of intestinal function, intestinal transit ratios were measured using activated carbon. The result is shown in Fig. 1. The intestinal transit ratio of the normal, control, LDO, HDO groups administered only water were 41.18%, 30.59%, 39.14%, and 39.27%, respectively. These results showed that intestinal transit ratio of the LDO and HDO groups were significantly higher than that of the control group.
Triglycerides, total cholesterol, and HDL cholesterol
The effect of Dual-Oligo on triglycerides, total cholesterol, and HDL cholesterol is shown in Table 3. Triglyceride and HDL cholesterol levels were not significantly different among the Dual-Oligo-treated and control groups. Dual-Oligo treatment decreased total cholesterol. Particularly, in the HDO group, the HDL/cholesterol ratio significantly (P < 0.05) increased by 25% compared with the control group. However, significant differences in the HDL/cholesterol ratio were not observed between the LDO and control groups.
The concentration of SCFA and Bifidobacteria counts
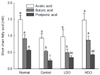
Acetic acid, propionic acid, butyric acid, and total short-chain fatty acids are important on intestinal environment for probiotics; their result is shown in Fig. 2. Acetic acid and butyric acid contents were not significantly different among groups. However, acetic acid and butyric acid contents of the LDO and HDO groups were higher than those of the control group were. Additionally, acetic acid and butyric contents showed a tendency to increase in a Dual-Oligo concentration-dependent manner. Propionic acid and total short-chain fatty acid contents of the LDO and HDO groups were shown to be significantly higher than those of the control group. Therefore, Dual-Oligo is considered useful in improving the colonic environment in rats with induced constipation. It was determined that Dual-Oligo was degraded by intestinal microorganisms as a probiotic and, as a result, short-chain fatty acids such as acetic acid, propionic acid, and butyric acid were generated. Thus, Dual-Oligo can improve immune control, promote the absorption of water and electrolytes, and increase colonic mucosa blood flow in the intestines.
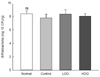
Among mixed ecosystems, Bifidobacterium is known to have beneficial effects of promoting digestion, enhancing the immune system, protein synthesis, and it is also a necessary nutrient and vitamin for the human body [13]. The effect of Dual-Oligo on Bifidobacterium in the cecal contents is shown in Fig. 3. The effect of Dual-Oligo on the proliferation of Bifidobacterium was not significantly different across groups, but the LDO group exhibited increased Bifidobacterium population than the control group, an induced constipation group.
Observation of intestinal epithelial cells
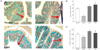
Three complementary elements-probiotics, gut flora, and the mucus layer containing membranes of epithelial cells-are vital in maintaining intestinal health. Corfield reported that mucus secretion and the formation of a slime layer should occur, as various intestinal diseases are related to the lack of mucus [14]. Constipation is known to decrease mucus secretion in the intestinal mucosa. Administration of loperamide decreases the mucus secretion in the colon and bowel movements, which ultimately inhibit the movement of bowel contents. The results from observation of the intestinal epithelial cells are shown in Fig. 4. After staining of crypt cells, the mucus secretion of the loperamide treatment group (control) decreased compared with that of the normal group. However, staining of crypt cells from LDO and HDO group showed increased mucus secretion. These results suggest that Dual-Oligo affected the cell activity of mucus.
In the distal colonic tissue of rats, the percent change of the colonic crypt area decreased in the loperamide-only group compared with the control group; however, it significantly increased in the Dual-Oligo-fed groups (Fig. 4A, P < 0.05). The change in absolute thickness of the distal colon significantly decreased in the control group. Moreover, the absolute thickness of the distal colon was significantly enhanced in the Dual-Oligo-fed groups compared to that in the control group (Fig. 4A, P < 0.05).
DISCUSSION
Our study investigated the effect of Dual-Oligo for alleviating constipation in loperamide-treated rats. Constipation is not a physiological consequence of aging; however, age-related changes, such as increased use of medication, dietary changes, and decreased mobility may contribute to the increased prevalence of constipation in older adults. When the intake of food decreases in advanced age, the intake of fiber may be inadequate to prevent constipation [15]. Serious constipation requires treatment with laxatives. Bulk laxatives, which absorb water from the intestinal lumen and soften the stool, are generally well tolerated, but gas production and bloating may occur. Stimulant laxatives, which increase intestinal mobility and secretion of water into the lumen, are more effective than bulk laxatives, but unwanted effects such as abdominal cramps and, in chronic treatment, the development of gastrointestinal tolerance may occur [16]. Prebiotics, including galactooligosaccharides and lactulose, are used for constipation alleviation.
We developed a new oligosaccharide comprising galactooligosaccharides and lactulose named Dual-Oligo. It has been found to be utilized by bifidobacteria, which can be classified as a beneficial intestinal bacterium. The utilization or influence of Dual-Oligo in humans and animals, however, has not been previously tested. The influence of ingestion of Dual-Oligo on constipation was investigated in loperamide-treated rats.
Food intake is an important factor in evaluating constipation symptoms and therapeutic effects. However, loperamide-induced constipation had several different effects on food intake. In some cases, administration of loperamide resulted in a decrease of food intake and water consumption [17], whereas other studies showed that loperamide treatment does not affect food intake or water consumption [18]. In our study, food intake was not significantly affected in response to loperamide treatment (Table 1). The food conversion ratio was the same as that observed for the control group. Kim et al. [16] and Shimotoyodome et al. [19] have also reported that loperamide does not significantly affect body weight gain. These differences might be attributable to factors such as the taste of herbal medicines and foods used in the studies.
According to Huang et al. [20], the oligosaccharides had a hypolipidemic effect, blood fat value and HDL cholesterol value were changed too. Oligosaccharides samples induced deceasing blood fat values than that of control group and that induced increasing the HDL cholesterol value in blood. The influence of Dual-Oligo on serum lipid levels was studied. Table 3 summarizes the data concerning triglycerides, total cholesterol content, and the HDL/total cholesterol ratio in normal rats and loperamide-treated rats. In particular, the HDL/total cholesterol of the HDO group was 25% higher than that of the control group, which was significant. Our result indicates that stress caused by constipation altered the lipid profile; however, Dual-Oligo may improve the serum lipid profile and relieve constipation.
Loperamide also markedly decreased the water content of feces through inhibition of intestinal fluid secretion. Treatment with Dual-Oligo significantly increased the number of fecal pellets, the wet weight of fecal pellets, and fecal water content in rats with loperamide-induced constipation (Table 2). The action mechanism comprises increasing fecal mass (bulk-forming), stimulating colonic nerves, and lubricating osmotically active substances like lactulose. Lactulose is unchanged when it reaches the intestines. Once in the intestines, bacteria split lactulose into its active components. This increases the action of the intestines and keeps the fluid secretion, so that stools are propelled through and become easier to pass [21]. These results suggest that Dual-Oligo has a superior effect on relieving loperamide-induced constipation in rats.
The results of the staining of crypt cells suggest that Dual-Oligo affects the cell activity of mucus (Fig. 4). Loperamide reduced mucin storage in crypt epithelial cells. This reduction in epithelial mucin is not likely due to the increased mucus release from these cells because both the thickness of the lumenal mucus layer and the amount of lumenal mucus were reduced by loperamide [19]. It is more likely that loperamide reduced mucin synthesis, especially that of sulfomucin, in crypt epithelial cells in the distal colon. With similar alleviation of mucosal damage [22], they demonstrated that the dietary combination of germinated barley foodstuff (GBFY) plus C. butyricum suppressed crypt loss and inflammatory parameters observed in experimental colitis in rats, which might be closely associated with the production of SCFAs. The layer thickness of epithelial tissue and the density of crypt-containing mucin in the rat distal colon declined with loperamide treatment compared with the control group. Crypt regeneration and restoration of the colonic mucosa significantly increased in the Dual-Oligo groups compared with that in the control group (Fig. 4).
According to their report, the addition of probiotics to germinated barley foodstuff might induce excessive production of SCFAs in the colon because of its high fermentability and effective utilization by C. butyricum. Therefore, GBFY supplements ameliorate mucosal damage induced by LPM (Liver plasma membrane) in rats, perhaps in part due to the marked production of SCFAs [1723].
Increase in the production of short-chain fatty acids are known to decrease intestinal pH, which reduces the production of carcinogens [24]. Short-chain fatty acids such as acetic acid, propionic acid, and butyric acid are absorbed quickly in colonic mucosa cells and have been reported to be a major energy source [25]. The productions of SCFAs result in a lower pH environment in the human intestinal tract, which was proposed as a mechanism of action for the effect of bifidobacteria on the intestinal bacteria [26]. As shown in Fig. 2, the concentrations of acetic acid, propionic acid, butyric acid, and total SCFAs in the constipation group significantly decreased in the feces compared to that in the normal group. Interestingly, this parameter in the HDO group increased significantly compared with the control group (P < 0.05). Therefore, in our study, xylo-oligosaccharides might also act as a source of SCFAs in the colon to lower pH values in the intestines of elderly patients.
The indigenous intestinal microflora and their metabolites are thought to play important roles in preserving human health [2728]. Among the human colonic microflora, bifidobacteria are the most common anaerobic bacteria and may exert beneficial effects on their host [2930]. We have already reported that galactooligosaccharides increase indigenous bifidobacteria [31]. In Fig. 3, Dual-Oligo administration showed a tendency to increase bifidobacteria compared with the control group, an induced constipation group.
In conclusion, Dual-Oligo was developed as a functional food that affects gastrointestinal function. This study demonstrated that Dual-Oligo enhanced gastrointestinal transit and alleviated constipation in loperamide-treated rats, with greater fecal excretion and fewer fecal pellets remaining in the colon. Histopathologic evaluation revealed that supplementation with Dual-Oligo increased mucus in the epithelial cells of loperamide-treated rats. Given that treatment with Dual-Oligo is associated with stabilization of the gut mucosal barrier, it is probable that such dietary manipulations could be of benefit in both the protection of the intact intestinal epithelium and the therapy of a disturbed mucosal barrier. Our results demonstrate that Dual-Oligo, as a new oligosaccharide, alleviates the symptoms of loperamide-induced constipation. Because of its easy availability, Dual-Oligo could be recommended as a cost-effective alternative for treatment of constipation.


 XML Download