

 PDF
PDF ePub
ePub Citation
 Print
Print


INTRODUCTION
Children and adolescents require large amounts of nutrients because they are in an active period of physical growth. On the other hand, sufficient amounts of the required nutrients are seldom obtained through just three meals a day. Therefore, proper snacking on healthy foods is needed for nutrition supplementation and proper dietary habits. These habits are established in childhood and adolescence and serve as a foundation for a balanced diet in adulthood. Mothers play a vital role in establishing family dietary habits because their values and attitudes have a great impact on the nutritional status of the entire family, either directly or indirectly [12]. Understanding of the parents for their children's favorite foods has a strong effect in elementary students, who are developing control over their own diet and food choices [3]. The dietary behavior in adolescence is reportedly affected by the mother's diet, family food expenses, allowances, and residential area [45]. Moreover, their food experiences mediated through these factors play a significant role in establishing their diet and food preferences as well as determining their nutritional status throughout their lifetimes [6].
Elementary students frequently cite ice cream and confectionery as the snacks they purchase the most [7], and middle school students report that they consume confectionery, sweetened ice, and bread as snacks [8]. In 2012, the total sugar intake per day in Koreans was 69.6 g from 6-11 years of age and 80.0 g from 12-18 years of age, which was greater than the average total sugar intake of all Koreans (65.3 g). The sugar intake from processed foods was 9.9% (45.2 g) from 6-11 years of age and 10.1% (57.5 g) from 12-18 years of age, which were higher than the WHO recommendation of less than 10% of the daily total energy intake. The main sources of processed foods, which accounted for the most of the sugar intake, were beverages, bread/confectionery/rice cakes, ice cream, and sweetened ice in the order of consumption from both 6-11 and 12-18 years of age [9]. This suggests that the sugar intake obtained from processed foods, which are often purchased and consumed by children and adolescents, should be reduced.
According to a study on higher grade elementary school students by Kim et al.[10], the majority of students responded that they obtained their nutrition knowledge from "their parents". More than 70% of children's diets were found to be dependent on their mothers [1112]. Furthermore, as the mothers' levels of education increased, the middle school students' diets improved [13]. This means that the parents' values and interests have a considerable influence on their children's diets [2]. An inverse correlation between the nutrition knowledge score and the frequency of sugar intake, sugar preferences, and sugar-related diets was reported previously. Furthermore, as the sugar intake increased, the intake frequencies of hamburgers, pizza, ice cream, ramen, and cake increased, whereas intake frequencies of tofu, beans, carrots, and milk decreased. These findings show that nutrition knowledge influences the diet establishment [14]. A prior study on snack purchases by elementary school students by Kang et al.[6] reported that children tended to buy healthy snacks when their mothers' concerns regarding food and nutrition education were higher.
The current study examined the effects of sweet food consumption by mothers, who have a considerable impact on the diets of children and adolescents, on their children's diets and the recognition of sugar reduction, and provides basic data to help establish a desirable policy for sugar reduction.
SUBJECTS AND METHODS
Subject and period
On 18 June, 2014, a questionnaire survey was given to 277 mothers whose children were attending elementary, middle, or high schools in Busan. In this study, the subjects were classified according to their self-perceived sweet dietary habits based on the question "Do you prefer to eat sweet foods?" into a sweet group (n = 91), in which the subjects thought that their diets were sweet, and an unsweet group (n = 186), in which subjects thought that their diets were not sweet. The study was excluded from Institutional Review Board by the Bioethics and Safety Act Enforcement Regulations.
Content and methods
The questionnaire used for this study was developed by revising and complementing previous studies [151617]. The questionnaire consisted of questions on sugar reduction (types of product to feel sweetened, necessity of sugar intake reduction, purchase level, and reduction proportion of the product with reduced sugar, and an effective method for reducing sugar intake), identification of nutrition labeling (health effect of the nutrition labeling identification, level of content identification, beverage purchase after identifying the nutrition labeling, reason for beverage purchase instead of water, and the necessity of nutrition labeling education), nutrition knowledge, snack frequency provided to children, and the nutrition education by mothers. Knowledge of sugar-reduced products, identification of nutrition labeling, choice of snacks by children, purchase of products after identifying the nutrition labeling, and the performance of nutrition education were assessed through a 5-point scale measurement. The nutrition knowledge was assessed using 10 questions, and the results were classified into a "right answer" of 1 point and wrong answer or "I don't know" of 0 points before analyzing the scores. The types of snacks were selected based on the Food Frequency Questionnaire for the 2011 National Health Statistics as well as in previous studies, followed by revision and improvement. With regard to frequency, the intake numbers of times per week were investigated.
Statistical analysis
The SAS statistical package (SAS 9.3, SAS Institute Inc., Cary, NC, USA) was used for statistical analysis, and a χ2-test was used to verify the significance of the data, which was indicated by the frequency and percentage. With regard to scoring data, the mean and deviation were calculated, and a Student's T-test was used to compare the mean of each group. The significance level was P < 0.05 in all analyses.
RESULTS
General characteristics
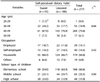
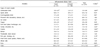
Table 1 lists the general characteristics of the research subjects. With regard to age, 40-49-years-old was the majority and accounted for 67.0% of the "sweet" group and 76.9% of the "unsweet" group. Regarding the mothers' occupation, 60.4% of the "sweet" group and 66.7% of the "unsweet" group were "housewives", and there were no significant differences between the two groups.
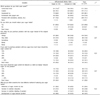
Conception of sugar-reduced products
The product types usually consumed as snacks (carbonated beverages, confectionery, sweetened ice, fermented milk, and processed milk) were presented, and the respondents were asked to choose multiple products they thought were sweet. The results (Table 2) showed that respondents in the "sweet" group chose in the order of increasing sweet taste, sweetened ice (86.8%), confectionery (74.7%), processed milk (73.6%), carbonated beverages (71.4%), fermented milk (53.9%), and none (1.1%), whereas respondents in the "unsweet" group selected sweetened ice (88.7%), carbonated beverages (78.5%), processed milk (75.8%), confectionery (69.4%), processed milk (50.5%), and none (0.5%). Regarding the question about the necessity of sugar intake reduction, 89.0% of respondents in the "sweet" group and 82.8% of respondents in the "unsweet" group answered "It is necessary". Regarding the question about whether they would purchase sugar-reduced products, 84.1% of all respondents (86.8% of the "sweet" group and 82.8% of the "unsweet" group) answered that they "would (always/very often) buy them". Regarding the questions about who would purchase sugar-reduced products and proper sugar reduction rates, 25.2% of respondents in the "sweet" group answered "I don't know", and 22.0% and 19.8% of the respondents in that group answered 20% and 10% sugar reduction, respectively. In the "unsweet" group, 23.1% of respondents preferred 20% sugar reduction, followed by 10% (20.4% of respondents) and 25% or more (20.4% of respondents) sugar reduction; there was no significant difference between the two groups. Regarding the question about how much sugar reduction in the existing products would be required to allow manufacturers to use sugar reduction labeling, 26.3% of the "sweet" group answered "I don't know", followed by 25% or more (18.7% of the "sweet" group) and 10% (17.6% of the "sweet" group). In the "unsweet" group, 25.8% of respondents answered 20% sugar reduction, followed by "I don't know" (19.9% of the "unsweet" group) and 10% (17.2% of the "unsweet" group). There was no significant difference between the groups. Regarding the question about the most effective method for reducing the sugar intake, 34.0% of the "sweet" group answered "lowering sugar content standard", while 34.4% of the "unsweet" group answered "developing sugar reduced products"; there was no significant difference between the groups.
Identification of nutrition labeling, necessity of nutrition education, and nutrition knowledge
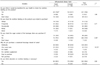
The results of the analysis investigating whether nutrition labeling contributes to good health (Table 3) indicated high positive rates in both groups (75.8% of the "sweet" group and 81.7% of the "unsweet" group answered positively). Regarding the question as to whether sugar content is identified when purchasing beverages, the positive answer rate was significantly lower in the "sweet" group (16.5%) than the "unsweet" group (28.5%) (P < 0.05). Regarding the reason for purchasing beverages instead of water, "habitually" (50.5%) and "like sweet taste" (25.3%) were the main answers in the "sweet" group (P < 0.01). Both groups answered that the necessity of nutrition education about nutrition labeling was important. The mothers' knowledge about sugar was similar in the two groups (Table 4).
Frequency of snacks provided to children
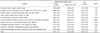
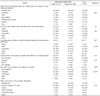
Regarding snack types and frequency of snack provided to children (Table 5), the children's consumption frequencies of carbonated beverages (P < 0.01), fast food (P < 0.001), candy/chocolate (P < 0.05), confectionery (P < 0.01), ramen (P < 0.01), and fried fish paste/hotdogs (P < 0.01) were significantly higher in the "sweet" group.
Children's nutrition education provided by their mothers
Table 6 lists the results of the analysis of children's nutrition education by their mothers. Regarding the education provided by mothers to encourage their children to purchase foods after identifying the nutrition labeling, the rate of the respondents who answered "educate always/educate often" (27.5% of the "sweet" group and 39.3% of the "unsweet" group) as well as the rate of respondents who answered "very frequently/frequently" (45.1% of the "sweet" group and 60.2% of the "unsweet" group) were significantly lower in the "sweet" group than the "unsweet" group (P < 0.01 and P < 0.01 respectively).
DISCUSSION
This study was conducted on the mothers of elementary, middle, and high school students in Busan to research their recognition of sugar reduction, identification of nutrition labeling, provision of snacks, and nutrition education to their children as well as their nutrition knowledge levels. Regarding the question as to which products were sweet, both groups answered that snacks (sweetened ice, carbonated beverages, processed milk, confectionery, and fermented milk) were sweet with a higher rate of 88.1-51.6%. This rate is higher than the results from Yeon et al. [17], who reported the rates of middle school girl respondents who sensed sweet taste in sweetened ice (68.7%), processed milk (68.3%), confectionery (62.3%), carbonated beverages (55.3%), and fermented milk (38.0%). This difference implies that mothers are more careful when choosing snacks than children because they are more interested in health. Regarding the necessity of reducing sugar intake, both groups answered positively, as shown by the higher rates. Regarding the questions about purchasing products with less sugar than existing products, the rates of respondents who answered "will purchase always/will purchase very often" were high in both the "unsweet" group (86.8%) and the "sweet" group (82.8%). Both rates were higher than the results (42.2%) reported by Yeon et al.[17] for middle school girls. Regarding the sugar reduction rate of products that the respondents would purchase, both groups preferred 20% (22.0% of the "sweet" group and 23.1% of the "unsweet" group), except for the answer "I don't know". The number of respondents answering "I don't know" was higher in the sweet group than in the unsweet group (25.2% vs. 16.1%, respectively). Considering the high rate of answering positively to the necessity for sugar intake reduction, the reason for the high rate of answering "I don't know" regarding purchasing reduced-sugar products is probably because there are an insufficient number of reduced-sugar products currently available, so the respondents did not have experience in buying these products. Regarding the question about which the level of sugar reduction is suitable to allow "sugar reduction" labeling on existing products, the "sweet group" answered 25% or more (18.7%) while the "unsweet" group answered 20% (25.8%). On the other hand, the rates of the respondents who answered "I don't know" were high (26.3% of the "sweet" group and 19.9% of the "unsweet" group). According to Food Labeling Standards [18], products with differences of at least 25% in nutrient contents compared to the standard levels of other products can use the terms of "more", "less", "reduced", or "light". In this study, however, the rate of answering 25% was relatively low, whereas a higher rate of respondents answered "developing sugar reduced products" and "lowering sugar content criteria" as effective ways of reducing their sugar intake. The policies of Korea regarding sugar intake restriction are limited to controlling advertisements for energy-dense low-nutrient content foods for children as well as food labeling on foods. This shows that more research into the regulations of "reduction" labeling is needed, and that education and promotion of consumers to increase the awareness of reducing sugar intake is needed to encourage companies to develop sugar-reduced products. In the United States, an excise tax of 1 cent per ounce applied to beverages with added sugar brought about a 25% decrease in consumption on average among parents of 6-12-year-old children. In addition, the policy of preventing fast food advertising aimed at 12-year-old or younger children discouraged parents of 6-12-year-old children from consuming fast food (twice or three times less per week) [19]. These policies aimed at preventing obesity among children and adolescents reportedly had a direct impact on subjects and influenced the food purchases of parents of 6-12-year-old children, resulting in reduction of sugar intake.
In the present study, both groups answered that the identification of nutrition labeling was helpful in maintaining health. On the other hand, the identification rate of sugar content when purchasing beverages was 16.5% in the "sweet" group, which was lower than 28.5% in the "unsweet" group. The main reasons for purchasing beverages instead of water were "habitually" and "like sweet taste" in the "sweet group". Both groups answered that there was a strong need for nutrition labeling education, which highlights the need for practical nutrition education for mothers.
Regarding the results of the survey investigating the snack types and frequency of snacks provided to children per week, consumption frequencies of carbonated beverages, fast food, candy/chocolate, confectionery, ramen, and fried fish paste/hotdogs were significantly higher in the "sweet" group than the "unsweet" group, and the total frequency of providing snacks was significantly higher in the "sweet" group. The results of a prior study on middle school students conducted by Yu et al. [20] reported that the frequencies of consuming confectionery, chocolate/candy, carbonated beverages, hamburger, pizza, and ramen per day were significantly higher in the sugar-preference group than the control group, which is similar to the results of this study in terms of the types of frequently consumed snacks in the "sweet" group except for lower frequency of consumption. These differences are probably because although this study surveyed the types and frequency of snacks provided by mothers, it did not include the number of times students chose snacks themselves, even though the rate of children (always/frequently) choosing their own snacks was as high as 51.8%. Furthermore, excessive intake of confectionery, chocolate/candy, carbonated beverages, hamburger, and pizza can lead to cavities, impaired concentration, and chronic diseases, such as diabetes, and obesity, which are caused by excessive calorie and sugar intake. Eating too much of these unhealthy food types can also bring about an unbalanced diet, which is caused by establishing a preference for strong tastes [2122]. A prior study on healthy adults aged between 20-65- years old conducted by Leung et al.[23] reported that the consumption of carbonated beverages reduced the leukocyte telomere length and stimulated disease development and cell senescence. According to the 2008-2012 Korea National Health and Nutrition Examination survey, adolescents who drank at least one can of carbonated beverage per day are at 2.7 times higher risk of obesity [24].
Regarding education provided by mothers to encourage their children to purchase foods after identifying the nutrition labeling, the rate of answering "educate always/educate often" was significantly lower in the "sweet" group. Compared to the past, children themselves tend to purchase their own snacks [14], and they can easily access their favorite crackers, fast food, and processed foods, which are more often consumed as snacks [25]. This study did not research the types of snacks that children usually eat. On the other hand, in a study by Jung [26] on higher grade elementary school students, the frequently consumed snacks were "confectionery or bread" (42.6%), and the reasons for eating were "delicious" or "habitually" (49.2%) rather than nutrition. This highlights the necessity of establishing good snacking habits and encouraging students to select and consume healthy snacks that do not negatively impact meals. In this study, both groups answered that dietary education for children was important, which is similar to the results by Kim [27]. Regarding whether nutrition education is performed, the rate of answering "very frequently/frequently" was significantly lower in the "sweet" group (45.1%) than in the "unsweet" group (60.2%), which suggests that mothers' diet influenced the nutrition knowledge of their children. As mothers' attitudes toward food influences snack purchases [6], education programs that improve the mothers' diets and promote the nutrition education of children should be developed. In a prior study, sensory education administered to children reduced the refusal to eat new foods and increased the preferences for eating new foods, even though the effect disappeared after 10 months [2829]. Therefore, sensory education should be carried out on a regular basis. A high rate of respondents answered that they received information on nutrition through "advertisements" or "the Internet", which can provide inaccurate or exaggerated information. Therefore, education through correct education channels, such as schools, is required to provide accurate nutrition information. Nutrition knowledge about sugar was high in both groups, but there was a difference in the ways in which the knowledge was put into practice (frequency of providing snacks, identification of nutrition labeling, etc.). In the case of children, higher nutrition knowledge was associated with improved snacking habits [14]. Therefore, proper education is needed to improve the nutrition knowledge and encourage behavioral changes.
Considering these results, mothers in the self-perceived "unsweet" group had a significant tendency to purchase beverages after identifying the nutrition labeling, purchase water rather than sweet beverages, provide unhealthy snacks (carbonated beverages, fast food, candies, chocolate, etc.) to their children less frequently, and provide nutrition education to their children more often compared to mothers in the "sweet" group. This suggests that mothers practicing low-sugar diets, despite their subjective standards, can positively influence their children in terms of decreasing their sugar intake. Regarding how to receive nutrition information, advertisements or the Internet were cited most often by both groups, leading to inaccurate information. Therefore, various educational programs should be developed to provide correct information. Education should help mothers better understand the sugar levels in their diets and emphasize the necessity of sugar reduction, which will help mothers choose healthy snacks for their children and encourage their children to eat less sugar.
 XML Download