

 PDF
PDF ePub
ePub Citation
 Print
Print


INTRODUCTION
A dietary pattern characterized by high-fat is considered a major contributor in the development of obesity, which is an increased risk factor for many diseases, including dyslipidemia, metabolic syndrome, and steatohepatitis [1]. Small intestine and liver play pivotal roles in the regulation of lipid metabolism [1234]. The small intestine is the first interface between body and dietary lipid for its essential role in lipid digestion and absorption and determines the amount and type of lipid entering the body. Enterocytes in the gut can also sense the luminal contents, provoking changes in intestinal metabolism, leading to more systemic effects by sending signaling molecules such as gut hormones to liver, muscle, or brain which can respond to sustain homeostatic control [5]. Liver, as it is a major organ that performs a diverse range of functions necessary for whole-body metabolic homeostasis [5], plays an important role in systemic lipid homeostasis through its ability to take in triacylglycerol (TAG), synthesize and store fatty acid (FA) as TAG and to secrete TAG in the form of very low-density lipoprotein (VLDL) [6]. It has been suggested that changes in the amount as well as composition of dietary fat contribute to the alterations in hepatic lipid metabolism and hepatic lipid accumulation [57].
Korean pine (Pinus koraiensis) nuts have been used in Asia for various dishes. The oil extracted from it, also known as Korean pine nut oil, is the only conifer nut oil rich in pinolenic acid (18:3Δ5,9,12), an unsaturated polymethylene-interrupted fatty acid (UPIFA) with a cis-5 ethylenic bond. Besides the high content of Δ-UPIFA (17.7%), of which pinolenic acid (14.9%) is a major component, the other main FAs of PNO are linoleic acid (18:2Δ9,12, 48.4%) and oleic acid (18:1Δ9, 25.5%) [8].
The effects of PNO on weight control and lipid metabolism have been studied for years. Ferramosca et al. [9] reported that mice fed a PNO-containing diet had lower body weight gain, liver weights, and total serum cholesterol and TAG levels compared with mice fed a diet containing maize oil. Consumption of a diet containing PNO in mice also resulted in lower serum TAG and VLDL-TAG levels compared with mice fed diets containing other oils such as sunflower or linseed oils [10]. Recent studies have focused on the role of PNO in the modulation of obesity. PNO replacement in the diet was effective in lowering body weight gain and liver weight in HFD induced obese mice [11]. In a study by Le et al. [12], enhanced mitochondrial FA oxidative metabolism in skeletal muscle and brown adipose tissue was observed in obese mice with PNO consumption, as demonstrated by higher expression of genes related to FA oxidation such as Ppara, Cpt1, and Acadl.
However, the role of PNO in regulating lipid metabolism in intestine and liver has not been investigated. The aim of this study was to examine the effects of PNO on both intestinal and hepatic lipid metabolism in C57BL/6 mice fed HFD (45% energy from fat). We measured expression of genes related to intestinal FA uptake and channeling, intestinal chylomicron synthesis, hepatic lipid uptake and channeling, hepatic TAG lipolysis and FA oxidation, as well as VLDL assembly by real-time PCR. Based on the results, we suggest a possible role of PNO in preventing excessive lipid uptake by intestine as well as improving hepatic lipid metabolism in HFD-induced obese mice.
MATERIALS AND METHODS
Animals and diets
Five-week-old male C57BL/6N mice were purchased from Central Laboratory Animal Inc. (Seoul, Korea) and fed a SC-control diet for 3 days and then divided into four dietary groups. Control diets contained 10% kcal fat from PNO (PC, n = 11) or SBO (SC, n = 10) and high-fat diets contained 15% kcal fat from lard and 30% kcal fat from PNO or SBO (PHF or SHF, both n = 12). The diets were made by Dyets, Inc. (Bethlehem, Pennsylvania, USA) and PNO was a gift from Dubio Co., Ltd. (Hwaseong-City, GyeongGi-do, Korea). Animals were fed water and experimental diets ad libitum for 12 weeks. The composition of the experimental diets is shown in Table 1, and the fatty acid composition of the experimental diets is shown in Table 2. Mice were housed individually in a specific pathogen-free facility under a controlled temperature (23 ± 3°C), humidity (55 ± 10%), and a light/dark cycle (12 h/12 h). Body weight was measured once a week and food intake was measured 4 times a week. At the end of 12 weeks, the animals were fasted for 12 hours and euthanized with CO2 asphyxiation. Blood was collected by heart puncture and serum was isolated from blood by centrifugation and stored at -80°C for later analysis. Small intestine (duodenum, ileum, and jejunum), liver, and white adipose tissues (epididymal, perirenal-retroperitoneal, and subcutaneous adipose tissues) were dissected out, and liver and adipose tissues were weighed, and tissues were stored at -80°C for later use. All experimental procedures were performed in accordance with the guidelines approved by the Institutional Animal Care and Use Committee of Seoul National University (approval No. SNU-101029-1).
Fatty acid composition of the experimental diets
Total lipids were extracted from the experimental diet using a Folch extraction method [13], and then reconstituted with methanolic NaOH, followed by incubation with BF3 in methanol at 100°C. Hexane was added to generate fatty acid methyl ester (FAME) from lipid, which was further analyzed by gas chromatography (Agilent 7890A, Agilent Technologies, Santa Clara, California, USA) using a DB-Carbowax column (0.32 mm×25 m, 0.2 µm, Agilent Technologies, Santa Clara, California, USA) and flame ionization detector. The sample was injected with a split ratio at 1:10 and helium was used as a carrier gas with 1.5 mL/min constant flow compensation. Injection temperature was raised from 50°C to 220°C at a rate of 15°C/min and maintained for 20 minutes at 220°C.
Serum lipids analysis
TAG and non-esterified fatty acid (NEFA) concentrations were measured using a Cleantech TAG-S kit (Asan pharm Co., Ltd, Seoul, Korea) and SICDIA NEFAZYME Kit (Shin Yang Chemical, Busan, Korea).
Hepatic lipid analysis
The Folch method [13] was also used for extraction of total lipids from the liver tissue and TAG level was measured using a Cleantech TAG-S kit (Asan Pharm Co., Ltd, Seoul, Korea). The hepatic TAG concentration is presented as mg/g tissue.
RNA extraction and cDNA synthesis
Total RNA was extracted from jejunum or liver using TRIzol reagent (Invitrogen, Carlsbad, California, USA) following the manufacturer's instructions. Quantity and quality of isolated RNA were determined using a spectrophotometer (Opitzen 2120UV, Mecasys Co., Ltd, Daejeon, Korea) and by agarose gel electrophoresis using the Gel-Doc XR system (Bio-Rad Laboratories, Inc., Berkeley, California, USA), respectively.
cDNA synthesis was performed using a PrimeScript II 1st strand cDNA synthesis kit (Takara Bio Inc., Otsu, Shiga, Japan) and a thermal Cycler 2720 (Applied Biosystems, Foster, California, USA) was used with the following conditions: 42°C for 50 minutes, 95°C for 5 minutes, and 4°C for 30 minutes.
Real-time polymerase chain reaction (PCR) analysis
Real-time PCR was performed using a StepOne Real-time PCR System (Applied Biosystems, Foster, California, USA) with a SYBR Premix Ex Taq (Takara Bio Inc., Otsu, Shiga, Japan). The PCR program was performed as follows: 95°C for 30 seconds for initial denaturation, 40 cycles of 95°C for 10 seconds for denaturation, and 60°C for 30 seconds for annealing, extension, and reading fluorescence. Calculations were performed using a comparative method (2-ΔΔCT) using housekeeping gene Gapdh (Glyceraldehyde-3-phosphate dehydrogenase) as an endogenous control. Specific primer sequences used in the current study are shown in Table 3 and Table 4.
Statistical analysis
The overall effects of fat amount and oil type, and the interaction between them were examined by Two-way ANOVA, and the individual group comparison was determined by Fisher's LSD multiple comparison test. Statistical analyses were performed using SPSS software version 23 statistical package for Windows (SPSS Inc., Chicago, Illinois, USA). The results were expressed as mean ± SEM and significance was defined as P < 0.05.
RESULTS
Body weight, weight gain, white adipose tissue weight, and liver weight
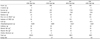
As shown in Table 5, body weight (P < 0.05), weight gain (P < 0.05), and amount of white adipose tissue (WAT) (P < 0.05) were significantly higher in HFD fed mice compared with mice fed a control diet. The replacement of SBO with PNO had a significant effect on weight gain and WAT weight, and PNO-fed groups had significantly lower weight gain (P < 0.05) and amount of WAT (P < 0.05) than SBO-fed groups. The PHF group showed significantly lower body weight gain (15.9% lower, P < 0.05) and WAT amount (19.9% lower, P < 0.05) than the SHF group. Lower WAT amount in the PC group compared with the SC group (29.7% lower, P < 0.05) was also observed. PNO-fed mice had significantly lower liver weight compared to SBO-fed mice (P < 0.05), and the PHF group had significantly lower liver weight than the SHF group (12%, P < 0.05). No differences in liver-tobody weight ratio were observed between SHF and PHF groups.
Serum and liver lipid concentrations
Overall, serum NEFA concentration was significantly higher in PNO-fed mice compared with SBO-fed mice (P < 0.05), whereas serum TAG concentration was not affected by either fat amount or oil type. HFD groups tended to have higher liver TAG concentration (P = 0.09). No significant difference was detected in liver TAG level regardless of oil type (Table 6).
Expression of genes involved in intestinal fatty acid uptake and channeling
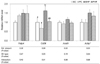
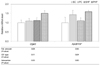
To examine the effect of PNO replacement in diet on intestinal lipid absorption, the expression of genes related to fatty acid absorption, Cd36 and Fatp4, and the genes involved in fatty acid channeling within enterocyte, Acsl5 and Acbp, were measured (Fig. 1). Overall, the mRNA levels of Cd36 were significantly higher in HFD-fed mice (P < 0.05) but significantly lower in PNO-fed mice (P < 0.05). The PHF group showed a tendency of lower Cd36 mRNA level than the SHF group (0.64-fold, P = 0.06). Feeding HFD resulted in a significantly higher Acbp gene expression (P < 0.05), but no statistical difference was observed regarding different oil type. The mRNA levels of Fatp4 and Acsl5 were not influenced by amount of fat and type of oil.
Expression of genes involved in intestinal chylomicron assembly and secretion
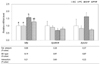
To determine whether the effect of PNO on weight gain reduction was associated with changes in chylomicron secretion, we measured the expression of genes involved in intestinal chylomicron assembly and secretion. The mRNA level of Mtp, an enzyme involved in chylomicron synthesis and secretion, was significantly upregulated in HFD-fed mice (P < 0.05). The PHF group tended to have a lower Mtp mRNA level than the SHF group (0.81-fold, P = 0.08). The structural components of gene expression of chylomicron, ApoB48 and ApoA4, which also facilitate intestinal lipoprotein production, were measured. Although the results of ANOVA didn't show a significant difference in the mRNA levels of ApoA4, overall tendency of lower expression was observed in PNO-fed mice compared with SBO fed mice (P = 0.07). In individual group comparisons, significantly lower mRNA levels of ApoA4 were observed in the PHF group than in the SHF group (0.44-fold, P < 0.05). Neither fat amount nor oil type influenced mRNA levels of ApoB48 (Fig. 2).
Expression of genes involved in hepatic lipid uptake and channeling
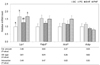
The mRNA levels of chylomicron remnant receptor Lrp1 and FA uptake protein Fatp5 were measured to determine the influence of PNO on hepatic lipid uptake. PNO consumption led to significantly higher Lrp1 gene expression compared with the SBO-fed groups (P < 0.05). Mice in PC group had significantly higher Lrp1 mRNA level compared to mice in the SC group (1.7-fold, P < 0.05). The mRNA levels of Fatp5 were significantly higher in PNO-fed mice compared with SBO-fed mice (P < 0.05). These results may indicate that PNO could accelerate plasma chylomicron and FA clearance. However, no differences in mRNA levels of Acsl1 and Acbp, which are involved in hepatic FA channeling, were observed in terms of either fat amount or oil type factors (Fig. 3).
Expression of genes involved in hepatic TAG lipolysis and fatty acid oxidation
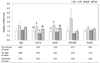
The expression of hepatic genes involved in TAG lipolysis and FA oxidation was assessed to determine whether PNO could prevent liver lipid accumulation against HFD consumption as well as increased hepatic lipid uptake. Atgl plays a key role in TAG hydrolysis [6]. In the current study, HFD did not have a significant effect on mRNA level of Atgl, whereas PNO consumption groups tended to show a higher mRNA level of Atgl (P = 0.08).
In measurement of mitochondrial FA oxidation related genes Cpt1a, Acadl, Ehhadh and Acaa1, PNO-fed mice had higher Cpt1a mRNA levels compared with SBO-fed mice (P = 0.05). The mRNA levels of Acadl were also significantly higher in PNO-fed mice compared with SBO fed mice (P < 0.05). Mice in the PC group had significantly higher Acadl mRNA levels compared to mice in the SC group (1.2-fold, P < 0.05). The mRNA levels of Acaa1 and Ehhadh were not significantly affected by the different dietary treatments (Fig. 4).
Expression of genes involved in hepatic TAG synthesis and VLDL assembly
TAG synthesis and TAG containing VLDL secretions are pivotal factors affecting lipid accumulation in liver. As shown in Fig. 5, compared to SBO-fed mice, PNO-fed mice had significantly higher mRNA levels of ApoB100 which is involved in VLDL assembly and secretion (P < 0.05). However, gene expression of Dgat2, an enzyme catalyzing the final step in TAG biosynthesis, was not influenced by different dietary treatments.
DISCUSSION
The current study showed that the replacement of SBO with PNO in the control diet or in HFD resulted in lower body weight gain and a lower amount of WAT. PNO replacement in the diet might function in suppression of excessive intestinal lipid absorption by down-regulating intestinal FA uptake related genes as well as to improve hepatic lipid metabolism by up-regulating genes related to TAG lipolysis, FA oxidation, and VLDL secretion in both control diet and HFD fed mice.
HFD induced body weight gain is associated with excessive intestinal lipid absorption [14] and increased lipoprotein production [15]. In this study, the expression of the key gene involved in intestinal FA uptake Cd36 was significantly higher in the HFD groups compared to the control groups, however, its expression was also significantly lower in the PNO-fed groups when compared to the SBO-fed groups. These results suggest that PNO replacement may prevent excessive lipid absorption from intestine.
After uptake by enterocytes, dietary sources of lipid are used for the biosynthesis of neutral fats [16], which are transported into the endoplasmic reticulum (ER) by MTP and packaged as chylomicron with ApoB48 and ApoA4 [1517]. ApoA4 and ApoB48 are the structural apolipoproteins of chylomicron, and the induction of ApoA4 expression observed in HFD-fed mice might also facilitate intestinal absorption as well as lipoprotein production [1819]. In the current study, HFD groups had significantly higher mRNA level of Mtp, whereas the PNO consumption group showed a tendency of suppression toward this overexpression. In addition, mRNA level of ApoA4 was significantly lower in the PHF group compared with the SHF group. These results indicate that PNO consumption may inhibit overproduction of chylomicron by intestine in HFD fed mice.
Collectively, in intestine, PNO replacement inhibited the overexpression of genes related to intestinal FA uptake, chylomicron assembly, and secretion, particularly in HFD fed mice. The results suggest that PNO consumption could lower intestinal lipid absorption, chylomicron excretion, and finally result in less weight gain. Because chylomicrons are responsible for the transportation of most dietary lipids from the intestinal tract into circulation [20], the inhibition of chylomicron secretion with PNO replacement further suggests that PNO consumption may reduce lipid flux to the circulation, liver, muscle, or other lipid accumulation tissue.
Chylomicron leaves intestinal lumen, transfers dietary lipid firstly to adipose tissue or other extrahepatic tissues [21], and delivers the remaining lipids in the form of chylomicron remnants which can be cleared from plasma by liver via LRP1 [2223]. Impaired clearance of chylomicron remnants is a risk factor for development of cardiovascular disease [24] whereas this hepatic clearance can be down-regulated by HFD [20]. In the current study, mRNA levels of hepatic chylomicron remnant uptake receptor Lrp1 were significantly higher in PNO-fed mice. This result indicated that PNO replacement in the diet could accelerate the removal of chylomicron remnant from the circulation by liver.
Dietary fatty acid can enter the liver in two ways: through the uptake of chylomicron remnant derived from intestine, or through overflow of a plasma free FA pool [25]. We then measured the mRNA levels of genes related to hepatic FA uptake. According to some reports elevated plasma free FA concentration could activate hepatic fatty acid uptake to reduce free FA levels [2627]. In this study, higher serum NEFA level was observed with PNO consumption group and liver FA uptake related gene Fatp5 mRNA level was significantly higher in PNO-fed groups. Worthy of note, the majority of plasma NEFA is derived from lipolysis of TAG activities in WAT [2829]. Therefore the higher serum NEFA level detected in the PNO-fed group may result from the enhanced lipolysis in WAT with PNO consumption. From this point of view, additional studies may be required to determine the influence of dietary PNO replacement on lipid metabolism and deposition in adipose tissue.
Accumulation of lipid in liver occurs when the amount of TAG from chylomicron remnant taken from plasma and de novo lipogenesis overwhelms the amount of TAG used for lipolysis and FA oxidation and for excretion with VLDL [5]. In the current study, despite increased uptake of hepatic NEFA and TAG uptake in the PNO-fed group, liver TAG concentration remained similar between the SBO and PNO groups. Therefore the potential mechanisms accounting for management of excessive lipid influx associated with PNO consumption in liver became our main interest. ATGL, in addition to its direct effect on catalyzing the initial step of TAG hydrolysis, has an influence on regulation of FA oxidation without affecting VLDL secretion [30]. CPT1A catalyzes the rate-limiting step, shuttling FA across the mitochondrial membrane for FA oxidation. ACADL, EHHADH, and ACAA1 are three beta-oxidation marker enzymes [3132]. In the current study, higher gene expression of Atgl, Cpt1a, and Acadl observed in PNO-fed groups suggested that PNO might contribute to activation of TAG lipolysis as well as the mitochondrial FA oxidative pathway in liver.
Expression of genes related to TAG synthesis and secretion as VLDL was also determined. Liver-specific DGAT2 catalyzes the terminal step in TAG synthesis [33] and ApoB100, a structural protein on VLDL, is involved in VLDL assembly and secretion in liver [34]. In the current study, PNO consumption had no influence on Dgat2 mRNA level. However, mRNA level of ApoB100 was significantly higher in PNO-fed groups which indicates that PNO replacement could enhance the incorporation of TAG into VLDL for secretion from liver, enabling recycling of lipid for further uptake by extrahepatic tissue.
Together, PNO replacement in the diet resulted in higher plasma NEFA and chylomicron remnant clearance by liver which might relieve plasma lipid burden, but at the same time, it could cause lipid accumulation in liver. However, the higher expression of genes involved in hepatic TAG lipolysis, FA oxidation, and VLDL production observed in PNO-fed groups indicate that PNO consumption may increase hepatic lipid metabolism to accommodate the excessive hepatic lipid influx, which might prevent progressive accumulation of lipid in liver.
Although PNO replacement resulted in less chylomicron secretion from intestine as well as elevated hepatic chylomicron remnant clearance by liver, there were still no significant differences in serum TAG concentrations between consumption of two different dietary oils. It is generally accepted that plasma TAG has two different carriers, one is chylomicron from intestine, and another is VLDL, which is mainly assembled and secreted by liver [35]. Plasma TAG concentrations are determined by the balance between production of chylomicron-TAG and VLDLTAG [36]. Under normal conditions, chylomicron remnants could be rapidly removed from the circulation by liver [37], and during the postprandial period, VLDLs contribute more than 90% of TAG rich lipoproteins [35]. Therefore, although PNO consumption suppressed excessive chylomicron secretion from intestine and enhanced chylomicron remnant clearance from circulation, serum TAG concentration might have remained similar between the two different oil groups because of elevated VLDL secretion from liver in PNO-fed groups.
In conclusion, this study provided some evidence of the disparities in various intestinal and hepatic metabolic pathways between PNO and SBO diet fed mice at the transcriptional level. PNO replacement might suppress excessive lipid absorption and chylomicron secretion into body circulation from intestine as well as enhance hepatic lipid metabolism in both control diet and HFD fed mice. No significant interaction between oil type and fat amount was observed in the results, which could indicate that the effects of PNO on body weight change or intestinal and hepatic lipid metabolism are independent of fat amount in the diet. The results may also indicate PNO as a potential dietary strategy for preventing metabolic dysregulation of lipids in intestine and liver observed with obesity.


 XML Download