

 PDF
PDF ePub
ePub Citation
 Print
Print


INTRODUCTION
High sodium intake is an important environmental factor eliciting hypertension and cardiovascular events. Many trials and epidemiological studies have shown reductions in blood pressure (BP) and cardiovascular events in response to reduced sodium intake [1]. Thus, decreasing dietary sodium intake is important to reducing BP and cardiovascular disease.
Increased arterial stiffness is an important marker of the risk of cardiovascular disease and an independent predictor of all-cause and cardiovascular mortality [2345]. Stiffening of the aorta increases aortic pulse wave velocity (PWV). Early return of reflected waves to the heart leads to increased left ventricular afterload, reduced diastolic coronary flow, and damage to important organs [67]. PWV is highly influenced by BP, as elevated BP is an independent predictor of future increases in PWV. [8] Studies have suggested that increased arterial stiffness is linked to the development of hypertension [910].
Despite numerous investigations of the causal link between high sodium intake and hypertension, few studies have evaluated the effects of high sodium intake on arterial stiffness using the varied responses to high sodium intake. A high sodium diet in hypertensive individuals produces a significant elevation in PWV [11]. However, studies have shown a different PWV response to sodium intake in normotensive individuals [1213]. The BP response to high sodium intake is not uniform. Individuals with sodium sensitivity (SS) have a dramatic response to dietary sodium changes, whereas individuals with sodium resistance (SR) have no response. We hypothesized that the various PWV responses to sodium intake may be influenced by SS.
We measured heart-femoral PWV (hfPWV) after subjects consumed high and low sodium diets and determined SS based on changes in 24-hr ambulatory BP to evaluate the influence of sodium intake on arterial stiffness depending on the status of hypertension and SS.
SUBJECTS AND METHODS
Subject
The study design has been described elsewhere [14,15,16]. Briefly, 108 volunteers were screened and seven dropped out. Among the remaining 101 volunteers (mean age 46.0 ± 16.6 years, range 18-65 years), 31 were hypertensive and 70 were normotensive. Participants with stage 2 and 3 hypertension (BP ≥ 160/100 mmHg), secondary hypertension, angina pectoris, myocardial infarction, congestive cardiac failure, stroke, diabetes mellitus, or chronic kidney disease (defined: estimated glomerular filtration rate by the Modification of Diet in Renal Disease equation < 60 mL/min/1.73 m2) were excluded.
Study design
Participants were asked to maintain their usual dietary pattern and physical activity and discontinue medications that affected BP or urinary electrolyte excretion, such as anti-hypertensive medications, beginning 2 weeks before hospitalization. During the 2 weeks of hospitalization, a low-sodium dietary approach to stop hypertension (DASH) diet [LSD; 100 mM (5.8 g) NaCl/day] was provided during the first 7 days, and a high-sodium DASH diet [HSD; 300 mM (17.5 g) NaCl/day] was given during the next 7 days. All three meals were prepared by trained dietitians in the hospital kitchen. Dietary compliance was checked by two trained nutritionists and found to be 99.8%. The 24-hour ambulatory blood pressure was measured on the last day of each diet period using an automated, non-invasive oscillometric device (P6 Pressurometer; Del Mar Reynolds, Irvine, CA, USA) attached to the left upper arm. An increase of more than 4 mmHg (P < 0.05) in the 24-hour ambulatory mean arterial pressure in response to the high salt diet was defined as sodium sensitive, while any change less than this was considered sodium resistant [14]. Hypertension was defined as a systolic blood pressure (SBP) ≥ 140 mmHg or a diastolic blood pressure (DBP) ≥ 90 mmHg at the office, a previous diagnosis of hypertension, or the current use of antihypertensive medications [17].
Measurement of pulse wave velocity
Heart-femoral PWV (hfPWV) was measured using an automated device (VP-2000, Colin Co. Ltd., Komaki, Japan) after removing the 24-hour ambulatory BP monitoring device. This device and the measurement method have been described in detail elsewhere [1819]. The subjects were allowed to rest in a supine position for 15 min prior to the measurements, which were performed in a quiet controlled room (22 ± 1℃). Systolic and diastolic BP and mean arterial pressure (MAP) of both arms were obtained simultaneously during measurement of the hfPWV. The study protocol and informed consent form were approved by the Institutional Review Board of Dongguk University Ilsan Hospital (IRB No. 2008-1-9), and written informed consent was obtained from all participants.
Statistical analysis
All statistical tests were two-sided, and the level of significance was set to 0.05. Continuous variables were expressed as the means ± standard deviation, and categorical variables were described by numbers and percentages in parentheses. Pearson's chi-square test or the independent t-test were performed to analyze the categorical data or continuous data, as appropriate, to compare baseline records of the groups.
The difference in hfPWV values at each time point and changes in hfPWV between groups (SS vs. SR, hypertensives vs. normotensives) were compared by analysis of covariance (ANCOVA) method with adjustment for age, gender, body mass index (BMI), and MAP obtained simultaneously during the measurement of hfPWV, fasting blood glucose, and total cholesterol. Within subject changes were identified by one-way repeated-measures ANOVA with adjustment for changes in MAP [20]. During subgroup analysis, individuals were divided according to the presence of hypertension and SS (hypertensives with SS, hypertensives with SR, normotensives with SS and normotensives with SR).
Comparative changes in hfPWV across three time points among four subgroups were identified using one-way repeated ANOVA for each group and two-way repeated ANOVA for all groups, and a mixed effect model for repeated measurements under control of a time-varying covariate (MAP) and time-invariant covariates (age, sex, BMI, fasting blood glucose, and total cholesterol) while applying an unstructured covariance structure. All analyses were conducted using an alpha error of 0.05 and SPSS ver. 20 (SPSS, Chicago, IL, USA) or SAS version 9.3 (SAS Institute Inc., Cary, NC, USA).
RESULTS
Characteristics of participants
The baseline demographic and clinical characteristics of the study population are shown in Table 1 and elsewhere. [141516] The mean age of the SS group was higher than that of the SR group. The MAP value in the SS group was higher than that in the SR group; however, the BMI and heart rate did not differ between groups. Hypertensive individuals were older than normotensive individuals. The BMI and MAP values of hypertensive individuals were higher than those of normotensive individuals. There were no participants with proteinuria identified by the urine dipstick test.
Comparison of PWV after each diet period: SS vs SR, and hypertensives vs normotensives
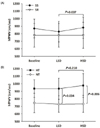
The hfPWV were higher in the SS group than the SR group after 7 days of the HSD, but no difference was observed after 7 days of the LSD. However, the difference was not significant after adjustment for age, gender, BMI, heart rate, MAP, fasting blood glucose, and total cholesterol (ANCOVA P > 0.05, Fig. 1 A). Hypertensive individuals had higher hfPWV values than normotensive individuals after 7 days of the LSD and HSD upon adjusted analysis (ANCOVA P = 0.034 and 0.006, respectively; Fig. 1 B). The least squares mean difference was 46.9 cm/sec (95% CI 3.5-90.3) after LSD and 77.7 cm/sec (95% CI 23.4-132.1) after HSD.
Change of PWV after HSD from LSD: SS vs SR, and hypertensives vs normotensives
When the study population was divided into SS and SR, individuals with SS had a higher hfPWV value after 7 days of the HSD than after 7 days of the LSD upon both unadjusted analysis (paired t-test P = 0.001) and adjusted analysis including MAP as a covariate (one-way repeated-measures ANOVA P = 0.037). These findings indicated that MAP independent elevation of hfPWV occurred in response to the HSD (Fig. 1 A). Individuals with SR showed no change in hfPWV after switching to the HSD from the LSD (paired t-test P = 0.966 and one-way repeatedmeasures ANOVA adjusted with change of MAP P = 0.891).
When the study population was divided into hypertensive and normotensive individuals, those with hypertension showed a higher hfPWV after 7 days of the HSD than after 7 days of the LSD upon unadjusted analysis (paired t-test P = 0.046), but not during analysis including MAP as a covariate (one-way repeated-measures ANOVA adjusted with change of MAP P = 0.210, Fig. 1 B). Individuals with normotension, there was no change in hfPWV after HSD from LSD (paired t-test P = 0.695 and one-way repeated-measures ANOVA adjusted with change of MAP P = 0.991).
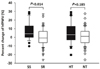
The percent changes in hfPWV after 7 days of the HSD from that after 7 days of the LSD [(hfPWV after HSD-hfPWV after LSD/hfPWV after LSD) × 100] were compared (Fig. 2). Individuals with SS had a significantly higher percent change than those with SR (ANCOVA, least squares mean difference 6.1 cm/sec, 95% CI 1.3-11.0, P = 0.014). Although hypertensive individuals tended to have a higher percent change in hfPWV than normotensive individuals, this difference was not statistically significant (ANCOVA, P = 0.185).
Change of PWV: subgroup analysis
Upon subgroup analysis by dividing individuals according to the presence of hypertension and SS, only individuals with hypertension and SS showed significantly higher hfPWV after HSD compared to LSD in the analysis using the mixed effect model for repeated measurement under control of time-varying and time-invariant covariates (Table 2).
DISCUSSION
In the present study, there was significant elevation of hfPWV after HSD from LSD in individuals with SS, but not in individuals with SR. Further analysis including time varying effects revealed significant elevation of hfPWV in individuals with hypertension and SS, but not in individuals without hypertension or SS.
Several studies demonstrated the effects of high sodium intake on vascular reactivity in individuals with hypertension [112122]. Liu et al. [23] showed a greater change in symmetric ambulatory arterial stiffness index in sodium sensitive individuals . However, this is the first study to compare the effects of SS in individuals with hypertension to those without hypertension on aortic stiffness in response to high sodium intake.
Gates et al. [21] showed rapid improvement in carotid artery compliance in older adults (> 50 year of age) with stage 1 hypertension in response to sodium intake restriction. A high correlation was observed between changes in BP and carotid artery compliance, and the effect of sodium restriction on lowering BP was explained to be exerted by improved large artery compliance [21]. Todd et al. [11] evaluated changes in vascular reactivity in response to different amounts of sodium intake in hypertensive individuals . A moderate correlation was found between changes in PWV and BP (r = 0.52), and their results suggested that dietary sodium loading may increase PWV via both BP independent and dependent effects. The absence of a BP-dependent elevation in vascular reactivity can be explained by the mixed study population of hypertensive individuals with SS or SR. Approximately half of the hypertensive individuals had SS [142425], and those with SR might cancel out the elevation of aortic stiffness in individuals with SS. Furthermore, their study did not exclude the mixed effects of the study population because they included prehypertensive and hypertensive individuals taking antihypertensive medications.
In normotensive individuals, the vascular reactivity response to sodium intake was various. Normotensive individuals with low sodium intake had a lower PWV than normotensive individuals with normal sodium intake in a study by Avolio et al. [12]. Dickinson et al. [26] showed improved endothelial-dependent vasodilation by reducing sodium intake. However, in a study by Todd et al. [13], no increase in aortic PWV was observed in normotensive individuals after dietary sodium loading. The various responses of normotensive individuals may have been caused by the study populations. Individuals with stage 1 hypertension were included in the studies of Avolio et al. [12] and Dickinson et al. [26], although the authors defined them as normotensive individuals .
Increase in arterial stiffness is caused by various mechanisms, such as progressive elastic fiber degeneration [27], recruitment of inelastic collagen fibers and increase of arterial wall smooth muscle mass [28], endothelial dysfunction [29], and etc. An endothelial dysfunction is a suggestive mechanism of the increase in arterial stiffness due to high sodium intake. Shortterm high sodium intake in animal and human studies induced endothelial dysfunction without elevation of BP [3031].
The limitation of our study is that we didn't show the long-term effect of high sodium intake on changes of arterial stiffness. No prospective studies have evaluated the long-term effect of high sodium intake on arterial stiffness, until now. If we consider the results of Avolio et al. [12], a chronic effect of high sodium intake could be expected . In that study, the intervention duration was from 8 months to 5 years. Although baseline PWV data were not provided to enable a comparison to PWV after the intervention, a lower PWV in the intervention group compared to that in the control group suggests a long-term effect of sodium intake on arterial stiffness. In our investigation, the study population was small. Power analysis revealed that the approximate fhPWV values of the four groups were 900, 800, 900, and 750 with a standard deviation of 140, and the resulting effect size was calculated to be 0.46. Power analysis suggested that a sample size of 14 subjects per groups resulted in a power of 0.81 with an alpha level of 0.05. Although the sample size was adequate except for the group with normotension and SS, the results of our study need to be evaluated in a larger population. In terms of dietary intervention, all participants were given a 2 week course of DASH diet as a background diet without a wash-out period. The DASH diet can reduce BP within 2 weeks [32]; thus, the order of diet was not randomized because it was expected that elevation of blood pressure by the HSD would be lower when the LSD was followed by the HSD rather than when the order was the HDS followed by the LSD. However, it is not certain if the results of the present study will be reproduced if the DASH diet is not used as a background diet and the order of the diet is the HSD followed by the LSD.
In conclusion, high sodium intake elevated hfPWV in hypertensive individuals with SS. Our results suggest that increased aortic stiffness due to high sodium intake may contribute to enhance cardiovascular risk beyond the BP elevation in hypertensive individuals with SS.

 XML Download