

 PDF
PDF ePub
ePub Citation
 Print
Print


INTRODUCTION
The incidence of obesity is increasing in South Korea and worldwide. According to the 2010 Korean National Examination Health and Nutrition Survey, one of three adults was obese (body mass index [BMI] > 25 kg/m2) [1]. Among adult men with obesity, 42.3%, 41.2%, 36.8%, and 37.8% were in their thirties, forties, fifties, and sixties, indicating that obesity prevalence peaked in their thirties and forties. Among adult women, the prevalence of low weight was high in their twenties, whereas that of obesity increased to 19.0%, 26.7%, 33.8%, and 43.3% in their thirties, fifties, fifties, and sixties, respectively, indicating that obesity prevalence peaked among menopausal women in their fifties and sixties [2]. With increasing age, body composition changes in such a way that the number of cells in muscles and internal organs decrease, while fat structure and body fluid outside fat cells do not change, which increases the fat-to-body weight ratio and further increases the incidence of obesity [13].
Obesity is not a simple problem of overweight. It is a direct risk factor of diseases and mortality from diseases such as diabetes, hypertension, cardiovascular disease (CVD), and some malignant tumors, which are caused by hyperinsulinemia due to increased insulin resistance [4]. Complications related to obesity are reportedly closely related to the amount of body fat, and the risk and occurrence of diseases vary according to body fat distribution [567]. The amount of visceral adipose tissue (VAT) is more closely related to the risk of atherosclerosis and insulin resistance than the amount of subcutaneous adipose tissue. That is, the amount of VAT is directly related to the occurrence of hyperlipidemia, hypertension, and metabolic syndrome, which are known as direct, independent risk factors of CVD [8910]. In particular, the incidence of abdominal obesity in South Korea is high compared to that in Western countries [11].
The development of obesity can be explained by the imbalance between energy intake and consumption [12]. Obesity is caused by excessive diet, low physical activity, and low resting energy expenditure (REE), which result in energy imbalance and play important roles in the occurrence of obesity [13]. Interests on REE have increased since the 2011 Korean National Examination Health and Nutrition Survey reported that physical activities of Korean adults had decreased since 2005 [14]. REE is known to account for 60-75% of the total energy consumption, making it the most important factor of energy consumption and in the prevention and treatment of obesity [15]. Calorie intake restriction, reduced body fat, increased lean body mass, and increased REE are important for the treatment of obesity. In addition, the suggested treatment methods of obesity were diet, exercise, drugs, and surgery.
Recently, quercetin therapy has attracted attention for its efficacy in the improvement of hyperlipidemia, and the prevention and improvement of obesity complications. Quercetin, which is extracted from vegetables such as apple and onion, has been known to be a flavonoid substance with bioactive activities [16]. Especially, quercetin therapy was reported to be effective in the improvement of hyperlipidemia, reduction of fasting blood glucose (FBS) level, prevention of CVD and cancer, and heavy metal detoxification and antibiosis [1718]. Onion is considered as a good source of quercetin, as it contains 300 mg of the substance. Onion peels contain a higher density of quercetin than the onion core. Supplementation with quercetinrich onion peel extract reportedly significantly lowered oral glucose tolerance [19] and, combined with the rich dietary fiber in onion peels, was reported to be effective in the improvement of blood lipid levels [17].
According to the positive effects of quercetin-rich onion peel extract in the body, intake of onion extract containing quercetin can be considered as helpful in reducing weight in obese adults or inducing changes in body composition that result in improvement of blood lipid and glucose levels. Although many studies suggest that intake of quercetin-rich onion is effective in the improvement of lipid metabolism, and prevention and improvement of CVD [2021], no studies have been conducted about the relationship between body fat composition in obese subjects and REE.
Therefore, this study aimed to study weight reduction, changes in body composition and REE, respiratory quotient (RQ), dietary intake, and metabolic parameters in obese adults by the intake of quercetin-rich onion peel extract.
MATERIALS AND METHODS
Subjects
This was a 12-week, randomized, double-blind, placebo-controlled study. The study was conducted from March 2013 to November 2013. We recruited subjects using posters and flyers. The target subjects were adults aged 19 to 60 years whose BMIs were > 23 kg/m2 or who were deemed to have abdominal obesity according to an abdominal girth > 90 cm in men and > 85 cm in women. Among these subjects, those who understood fully the objective, contents, and characteristics of the specimen, and agreed to participate in the study by signing the informed consent form were included as study subjects. Subjects who had hypertension (diastolic blood pressures (DBP) > 60 mm Hg or systolic blood pressures (SBP) > 100 mm Hg), were taking diuretics, had FBS levels > 126 mg/dL or random blood glucose levels > 200 mg/dL, or were taking oral hypoglycemic agents or insulin were excluded from this study. Subjects with heart, kidney, liver, thyroid gland, cerebrovascular, gall bladder, or gastric intestinal diseases; gout; or depression or other psychological diseases were excluded from this study. Moreover, subjects who were taking drugs that can affect the results of this study, such as diet pills, antidepressants, appetite suppressants, anti-contraceptives, and steroids, and those who participated in commercial obesity management programs or had been dieting to lose weight within 30 days before the beginning date of this study were excluded from this study.
Experimental design
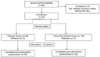
Eighty subjects applied for enrollment in this study, and two subjects who were taking diet pills were excluded from the study (Fig. 1). Seventy-eight subjects were enrolled, and six subjects withdrew during intervention periods citing the reasons of moving house and offensive smell of capsules; some withdrew without citing any reason. We completed post-intervention assessment of 72 subjects, of whom, 36 were assigned to a placebo control group (controls) and another 36 were assigned to an onion peel extract (OPE) group. Capsules of onion peel extract containing 50 mg of quercetin were provided to the patients in the OPE group two times a day for 12 weeks (100mg quercetin/d, 50mg quercetin bid) [22]. As placebo, the controls were provided with capsules of the same shape as those given to the OPE group but containing lactose mixture instead of OPE. The effects were compared between the two groups. This study was conducted after the approval of the institutional review board of Kyung Hee Medical Center (KMC IRB 1304-03-C1).
OPE preparation
The onions used for the OPE in this study were acquired from Changnyung between August and September 2012, and passed through an OPE powder manufacturing process [22]. Analyses of total phenol, total flavonoid, and quercetin contents yielded the following values: 681.7, 372.0, and 286.0 mg/g, respectively. One capsule contained 170 mg of OPE containing 50 mg of quercetin.
Anthropometric measurement
For all the subjects, anthropometric measurements were conducted four times, at baseline, and the fourth, eighth, and 12th week. And, we presented data at baseline and last (12th week). Each variable was measured twice, and measurements were averaged and recorded up to the tenth digit. BMI was calculated by measuring height and weight, and then dividing the weight by the square of the height. Waist and hip circumferences were measured while the subjects were standing at ease with arms open wide. All the values were measured by a single trained registered dietitian.
Dietary intake assessment
To determine food intake, food diaries were distributed to the subjects, where the subjects recorded their diets at baseline, and the fourth, eighth, and 12th week, as well as two weekdays' and one weekend's diet. During the distribution of the food diaries, correct eye measurement, materials, and food recipes were explained to the subjects. Based on the food diaries, the trained RD collected information regarding the correct amount of food intake through a one-to-one interview. Food intake was measured by using a food model, and measuring cups and spoons. The amount of food intake was analyzed by using Computer Aided Nutritional Analysis for Professionals (CAN-Pro Ver 4.0, Korean Society of Nutrition).
Measurement of body composition
For each study subject, the percentage and amount of body fat were measured twice, at the first (baseline) and last visits (12th week). The percentage and amount of fat in the arm, leg, trunk, and whole body were measured by using dual-energy X-ray absorptiometry (LUNAR Prodigy; General Electric Co., Madison, WI, USA).
Measurement of REE and RQ
REE and RQ were measured for all the subjects by using a ventilated hood connected to a gas analyzer system (TrueOne 2400; Parvo Medics, Sandy, Utah, USA) with the indirect calorimetric method. The subjects were prohibited intakes of alcohol from the previous day and food from at least 4 hours prior. To measure at a stable status, the subject was allowed 10 to 15 minutes' rest, and measurements were performed with the subject in the supine position. After the gas analyzer tube and canopy were connected, as the face and upper arms of the subject were covered with the canopy, the subject warmed up by relaxed breathing for 5 minutes. When the breathing of the subject became stable, measurement was conducted for 20 to 25 minutes.
Blood metabolic profiles
The subjects underwent blood testing at the first and last (after 12 weeks) visits. FBS, triglyceride (TG), total cholesterol (TC), high-density lipoprotein (HDL)-cholesterol (HDL-C), and low-density lipoprotein (LDL)-cholesterol (LDL-C) levels were measured by using an absorptiometry using kit (Bayers, Tarrytown, NY, USA). Fasting insulin level was measured by using a Coat-A-Count Insulin kit (Diagnostic products Co., Los Angeles, CA, USA), and leptin level was measured by using a human leptin radioimmunoassay kit (Linco Research, St Louis, MO, USA).
Statistical analysis
All the data in this study were analyzed with the Statistical Analysis System version 9.1. Continuous variables were presented as mean and SD values, and categorical variables were presented as frequencies and percentages. The measured values such as the anthropometric measurements, food intakes, and metabolic profiles from the experimental and control groups before and after the intake experiment of onion peel extract were analyzed by performing a paired t test. The difference between the intake and control groups was analyzed by performing a t test. In addition, categorical data were compared using the chi-square test. All statistical results were verified with the significance level set at P < 0.05.
RESULTS
Demographic characteristics
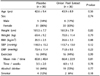
The baseline characteristics of subjects are presented in Table 1. There were no significant differences in demographics between the control and OPE groups. In the control group, 5 men and 31 women participated; and in the OPE group, 6 men and 30 women participated.
Dietary intake assessment
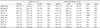
The changes in food intake are summarized in Table 2. In the control group, the amounts of calories, carbohydrate, protein, and fat intakes were increased, but the differences were not significant. The ratio between carbohydrate, protein, and fat changed, though not significantly, from 58:15:27 to 61:15:24. The amount of fiber intake decreased, also not significantly, from 19.79 ± 16.58 to 17.60 ± 7.18 g. In the OPE group, the amounts of calorie, carbohydrate, protein, and fat intakes were not significant. The ratio between carbohydrate, protein, and fat changed from 60:16:24 to 58:16:26, which was not significant. The amount of fiber intake only slightly changed from 20.1 ± 6.9 to 20.4 ± 6.7 g.
Changes in anthropometric measurement and body composition
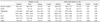
Changes in body measurements after the 12-week, randomized, double-blind, placebo-controlled study are presented in Table 3. While the control group did not show significant differences in weight and BMI, the OPE within the group showed significant decreases in weight from 70.0 ± 11.4 to 69.2 ± 11.4 kg (P = 0.02) and BMI from 26.6 ± 3.3 to 26.3 ± 3.2 kg/m2 (P = 0.03). Waist and hip circumferences showed significant changes in both groups. The waist circumference of the control group decreased from 90.2 ± 6.5 to 89.5 ± 6.4 cm, whereas that of the OPE group decreased by 2 cm from 91.9 ± 7.6 to 89.9 ± 7.7 cm. The hip circumference of the control group decreased from 100.7 ± 5.2 to 99.9 ± 4.6 cm, whereas that of the OPE group decreased by 1.3 cm from 101.1 ± 5.9 cm before the experiment to 99.9 ± 6.3 cm after the experiment. In addition, the skinfold thickness in the control group decreased significantly by 2.2 mm from 33.2 ± 5.5 to 31.1 ± 5.6 mm (P < 0.001), whereas that in the OPE group decreased significantly by 3.2 mm from 34.1 ± 7.1 to 30.9 ± 6.4 mm (P < 0.001).
The control group did not show any significant differences in the percentages of fat in the arm, leg, trunk, and whole body, and the amount of total body fat by DXA. Although the OPE group did not show significant differences in the percentages of fat in trunk and leg, they showed significant decreases in the percentages of fat in the arm by 0.7% from 36.1% ± 8.8% to 35.5%± 5.5% (P = 0.03), and total body fat by 0.6% from 38.2% ± 6.5% to 37.6%± 6.4% (P = 0.02).
REE and RQ
The changes in REE and RQ are presented in Table 4. The changes in the RQ values in the control group were not significant, but those in the OPE group increased significantly from 0.7 ± 0.1 to 0.8 ± 0.1 (P = 0.02). The REE values in the control group increased significantly by 85.8 kcal from 1,444.1 ± 217.0 to 1,524.5 ± 217.3 kcal (P = 0.003), whereas those in the OPE group increased significantly by 85.0 kcal from 1,417.2 ± 253.8 to 1,498.9 ± 261.4 kcal (P = 0.006).
The REE values in the control group adjusted by weight increased significantly from 20.9 ± 2.1 to 22.2 ± 2.0 kcal/kg (P = 0.008), whereas those in the OPE group increased significantly from 20.3 ± 2.8 to 21.7 ± 1.9 kcal/kg (P = 0.004). The REE values in the control group adjusted by free fat mass increased significantly from 35.3 ± 4.5 to 37.7 ± 3.2 kcal/kg (P = 0.002), whereas those of the OPE group increased significantly from 34.7 ± 5.2 to 36.8 ± 3.2 kcal/kg (P = 0.02).
Metabolic profile
The changes in blood metabolic profiles are summarized in Table 5. From before to after the experiment, the FBS levels in the control group increased significantly from 95.3 ± 9.4 to 98.7 ± 9.9 mg/dL (P = 0.04), whereas those in the OPE group increased significantly from 95.9 ± 8.8 to 99.2 ± 11.3 mg/dL (P = 0.04), which are all within the normal range. The blood insulin level in both groups did not show any significant change.
For blood lipids, both groups did not show any significant differences in TC, LDL-C, and HDL-C levels. Whereas the TG level in the control group increased significantly from 113.4 ± 46.3 to 132.5 ± 60.0 mg/dL (P = 0.03), that in the OPE group decreased, though not significantly. Blood leptin level decreased significantly in both groups, from 14.9 ± 8.0 to 11.6 ± 5.7 mg/dL in the control group (P = 0.001), and from 15.7 ± 10.9 to 11.4 ± 6.7 mg/dL in the OPE group (P = 0.002). The decrease in the OPE group was -4.2 ± 7.6 mg/dL, greater than that in the control group, which was -3.6 ± 5.2 mg/dL.
DISCUSSION
Clinical trials were performed in this 12-week, randomized, double-blind, placebo-controlled study. The control group consisted of 36 subjects; and the OPE group, 36 subjects. For 12 weeks, the subjects in the OPE group were given daily OPE capsules containing 100 mg of quercetin. After 12 weeks, the effects on weight, body composition, REE, RQ, dietary intake, and blood metabolic profiles in the overweight and obese adults were examined.
After 12 weeks of taking the OPE capsules, the overweight and obese adults showed significant decreases in weight; BMI; waist, hip, and thigh circumferences; and skinfold thickness. The DXA measurements of body composition showed significant decreases in the percentage of body fat, particularly in the percentage of fat in the arm. Kang et al. [23] reported that 8 weeks' intake of an onion drink containing quercetin had antiobesity effects in obese rats. Moreover, Yang et al. [24] reported that 10 female university students who took onion extract for 12 weeks showed decreased weight, percentage of body fat, BMI, and waist circumference, which corresponds to the results of this study. Compared with the study by Yang et al., where the decrease in BMI was 0.59 kg/m2, this study found a decrease in BMI of 0.3 kg/m2, indicating a lower decrease. Waist circumference decreased by 0.8 and 2.66 cm, and percentage of body fat decreased by 0.6% and 0.93% in this study and in the study of Yang et al., respectively. The mean BMI in this study was 26.5 kg/m2, which is regarded as lower than the weight decrease in morbidly obese female adults. In addition, Lee et al. [25] reported that female university students who took onion extract for 4 weeks did not show any changes in BMI and body fat composition. This was considered to be due to the shorter experiment period of their study than that of this study.
As the result of taking powdered OPE containing 100 mg of quercetin for 12 weeks, REE increased in both the control and OPE groups. In RQ, only the OPE group showed a significant increase. The mean REE in all the subjects in this study was 1,430 kcal. In comparison with the study on REE in normal-weight and obese adults [15], in which the REE in the normal-weight group was 1,458 kcal and that in the obese group was 1,553.8 kcal, this study yielded a similar result as that in the normal-weight group in the previous study. REE decreases after several days of fasting; and if fasting treatment limiting food calories continues, weight reduction cannot be continued due to the decrease. In obese people, the overall REE is known to be high owing to increased BMI [26], so as free fat mass. However, REE per unit weight decreases owing to the increase in the percentage of fat per unit weight. Similarly, in this study, after adjustment for the decreases in weight and body fat, the REE showed a significant increase.
REE reportedly has the highest correlation with free fat mass [27]. However, in this study, although free fat mass did not significantly change, REE increased with the decreases in weight and BMI. Kim et al. [28], in their energy expenditure research with obese middle-aged women, reported no significant differences in REE/FFM between the obese and normal-weight group, which corresponds with this study. Because REE increased despite the absence of a significant change in free fat mass and despite the significant decreases in weight and percentage of body fat in this study, the role and mechanism of the effect of quercetin therapy on REE need to be studied further.
The correlation between RQ and weight reportedly increased as fat oxidation decreased; that is, as RQ increases, weight decreases [29]. RQ is the ratio between the volume of oxygen used in the oxidation of nutrition and carbon dioxide, which is known to be 0.7, 0.8, and 0.95-1.0 in the oxidation of fat, protein, and carbohydrate, respectively. A RQ value < 0.8 indicates a lack of energy intake, and a RQ value < 0.7 indicates a low-carbohydrate diet or starved state. In this study, whereas RQ in the control group did not significantly change, the RQ in the OPE group increased significantly from 0.7 to 0.8, which is estimated to indicate some relationship with metabolic flexibility to glucose [30].
In the 2011 National Health and Nutrition Survey [14], the mean calorie intake of adults was 2,043 kcal, whereas that in this study was lower at 1,610 kcal. This result is thought to be due to the greater number of women than men among our subjects. Carbohydrate intake was reported to be 329.9 g in the aforementioned survey, whereas that in this study was lower at 235.5 g. The mean protein intake was reported to be 75.1 g in the survey, whereas that in this study was 61.14 g. For lipid intake, the National Health and Nutrition Survey reported 43.2 g, whereas this study reported 44.23 g. Comparing the intakes of carbohydrate, protein, and lipid, the ratio in the Korean National Health and Nutrition Survey was 65.8:14.6:19.6, whereas that in this study was 59.0:15.5:25.5. The low intake of carbohydrate and high intake of lipid correspond with the study that obese people prefer high-fat food and animal protein [3132].
The OPE group showed an increased FBS level and a decreased blood leptin level. TC and LDL-C levels reportedly decreased when adults with hypercholesterolemia took onion extract for 10 weeks [33], and intake of food containing 0.1% quercetin was reportedly effective in reducing TG and free fatty acid levels in animals [34]. In addition, a previous study reported that feeding an onion concentrate to rats decreased the TG level of the rats, and the decrease was greater when the concentration was higher [35]. In this research, the TG density was decreased by the intake of quercetin, which is not the case for the control group. However, blood glucose level tended to increase, which is thought to be due to the normal blood glucose levels of the subjects at baseline, thus the insignificant increase after the experiment.
Quercetin is known to have a suppressive effect on hyperlipidemia due to its antioxidant effect [36], which is thought to be a mechanism related to the inhibition of the blood lipid effect of the intake of onion extract. In addition, quercetin protects LDL-C from oxidative damage, which is effective in preventing DNA damage induced by hydrogen peroxide in human lymphocytes [37]. Blood leptin level, which is positively correlated with the amount of body fat, decreased by approximately 26% in this study. A similar result was obtained in the study that reported that the level of leptin could be affected by weight loss from dietary intervention or exercise [38]. However, according to the study on weight loss by 12 weeks of aerobic exercise among middle-aged women, the leptin level of the subjects decreased by approximately 50% [39]. A study in which subjects received both nutritional education and exercise reported that the leptin level decreased by about threefold [40]. The leptin level did not decrease further because only OPE was provided in this study.
This study has some limitations. First, men and women were not separately observed when analyzing changes in parameters. Second, we do not know the mechanism underlying significant changes in waist circumference and REE in the placebo group. Third, we cannot explain why the percentage of arm fat in the OPE group significantly decreased among the multiple body fat regions.
The results of this study indicate that 12-week supplementary intake of OPE showed significant effects on decreasing body weight and percentage of body fat in overweight and obese adults. However, further study is necessary on the anti-obesity effects of long-term intake of OPE and its related mechanism.


 XML Download