

 PDF
PDF ePub
ePub Citation
 Print
Print


Introduction
Iron deficiency is the most common nutritional deficiency in the world. Because iron requirements increase during growth and development, iron deficiency such anemia is typically seen in infants, growing children, and pregnant women. Iron is lost in the blood each month during the menstrual cycle, especially in young women (McGuire et al., 2007).
Research shows, moreover, that health in adolescence may have an effect on the prevention of some adult disease, as well as on mental and emotional stabilization of adolescents (Lifshitz et al., 1993). While iron deficiency has been called the most prevalent nutritional problem worldwide, it may occur across all ages and living standards (Dallman et al., 1993). Girls whose intakes of iron or folate equaled or exceeded the Recommended Dietary Allowance (RDA) had significantly higher mena hemoglobin values (Mousa et al., 2003). Especially, the starting age of menstruation affected prevalence of anemia. According to the National Health and Nutrition Survey (Korea Ministry of Health and Welfare, 2005), daily iron intake of girls (13-19 years old) was 11.2 mg, which is 77.4% of the Korea Recommended Dietary Allowance (RDA). Therefore, it may be pointed out as a nutritional problem in the period of adolescence having high iron demand. It has been reported that although there has been some improvement in middle school students' body sizes and qualities of dietary life, their iron nutrition is insufficient. It also has been reported that the lower the living standard and the taller the height in middle school students and the more the nutrient intake and the heavier the weight in middle school girls, the higher the risk of their poor iron nutrition (Hong & Hwang, 2003). A study carried out by Hong et al. (2001) with high school girls showed that the intake rate of heme and nonheme iron were 29.6% and 70.4%. Dietary choice is an extremely complex behavior: multiple factors likely influence behavioral changes. Previous research has been limited, however, to studies that focused on a few correlations (Birch & Fisher, 1998; Zive, 1998) and have demonstrated that psycho-social influences, such as self-efficacy and family/peer influences can have an impact on increasing fruit and vegetable intake and decreasing dietary fat intake among children and adolescents (Cullen et al., 1998; Cullen et al., 2001; Granner et al., 2004). Of particular concern were the high percentage of youth who reported using unhealthful weight-control behaviors such as skipping meals, fasting, using food substitutes, or smoking more cigarettes were reported by more than half (57%) of the girls and by one third (33%) of the boys. An additional 12% of girls and 5% of boys reported extremely unhealthful behaviors such as use of diet pills, laxatives, diuretics, or vomiting (Dianne et al., 2004). It is essential to determine the potential implications of different weight-control behaviors on dietary intake in youth. Also many studies have shown that rates of depression increase in early adolescence (Cuijpers & Smit, 2004; Fergusson et al., 2005; Haavisto, 2004; Jaffee et al., 2002; Wilcox & Anthony, 2004).
This research targeted middle school girls in Ulsan City to investigate the differences in iron status, clinical symptoms and physical characteristics between the normal and anemia girls' groups, and to analyze their correlations. This research is to be utilized as basic data to prevent anemia and to develop a nutritional intervention program.
Subjects and Methods
Subjects
This study was carried out with 237 subjects in the middle school second grade girls in the Ulsan metropolitan area. The standard value defined as iron deficiency anemia in this study was less than a level of 12g/dl of hemoglobin for 15-year old girl students, in accordance with NHANES (Nation Health and Nutrition Examination Survey III).
Physical characteristics and menstruation status
The height and weight were measured with automatic instruments (Fanoces model:Fa-95, Korea) and body mass index (BMI) was calculated weight (kg)/height (m2). The menstruation status data such as menarche age, duration and amount was collected by questionnaire.
Measurement of iron status
Hemoglobin, serum iron, total iron binding capacity (TIBC) and serum ferritin were measured. The hemoglobin was measured with Coulter Counter (Steks, USA). Serum iron and TIBC were measured with Automatic Chemistry Analyzer (Hitachi 7600, Japan). Serum ferritin concentration was measured with a Chemiluminescence's Immunoassay (CLIA) Analyzer (ACS 180, Bayer Diagnostics Co., USA).
Clinical symptoms relating anemia
Eleven items complemented on the basis of clinical symptoms investigated from the previous study were used (Hong et al., 2001). Each items had four scales: 'never', 'seldom', 'sometimes', and 'often'. These variables were measured by 1, 2, 3 and 4 point Likert type scales.
Statistical analysis
All data collected were statistically analyzed, using a SPSS 12.0 package. For each variable, the values of average and standard deviation were measured. The differences of physical characteristics, hematological indices and symptoms between normal and anemic groups were analyzed by t-test. The differences of menstruation status of the two groups were analyzed by one-way analysis of variance (ANOVA). The correlation between hematological indices, clinical symptoms and physical characteristics were identified for significance by measuring with Pearson's Correlation Coefficient.
Results
Physical characteristics
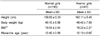
Table 1 shows the anthropometric characteristics and menarche age between the normal and anemic girls. They were divided with two classifications by hemoglobin (<12g/dl) of hematological indices.
The heights and weights of the normal girls were 158.83 ± 5.33 cm, 49.10 ± 6.98 kg respectively and BMI (kg/m2) was 19.54 ± 2.44. And the heights and weights of the anemic girls were 160.11 ± 5.45 cm, 49.42 ± 7.59 kg respectively and BMI (kg/m2) was 19.22 ± 2.27. The anthropometric data between the normal and anemic group was no difference significantly. Choi et al. (1997) reported that the average height of middle school girls was 156.8 cm, which is lower than the height of this study, and their average weight was 49.6 kg which is slightly lower than that measured in this study. The menarche age of the anemic group was 12.13 ± 0.92 years, which is significantly low compared with normal group (12.42 ± 0.88 years).
Table 2 shows the duration and amount of menstruation of the two groups. The most frequency of menstruation duration was 6-7 days and the menstruation amount was moderate for the two groups. There is no difference significantly between the two groups.
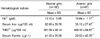
Iron status
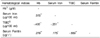
Table 3 shows the iron status parameters of the normal girls and anemic girls. The hemoglobin concentration of the normal girls averaged 13.10 ± 0.66 g/dl, and the anemic girls averaged 10.84 ± 1.17 g/dl. The hemoglobin of the anemic girls was significantly (p<0.001) low compared with the normal girls. The serum iron of the anemic girls averaged 35.15 ± 27.47 µg/100 ml, which is significantly low compared with the normal girls (82.66 ± 39.78 µg/100 ml). The TIBC of the anemic girls was 449.30 ± 64.87 µg/100 ml and of the normal girls was 381.09 ± 48.14 µg/100 ml. The TIBC of the anemic group was significantly higher than that of the normal group. The serum ferritin of the normal girls averaged 41.03 ± 29.56 µg/ℓ, and the anemic girls averaged 20.53 ± 42.29 µg/ℓ which is significantly low compared with normal girls.
Clinical symptoms of the subjects
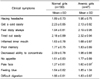
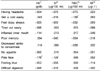
Table 4 showed the clinical symptoms of the subjects. The symptom of 'Get a cold easily' (2.23 ± 0.85) was the highest, followed by 'Tired out easily' (2.18 ± 0.89), 'Decreased ability to concentrate' (2.09 ± 0.78), 'Having headache' (1.89 ± 0.73) by the normal girls. And the anemic girls show 'Tired out easily' (2.32 ± 0.94) was the highest, followed by 'Feel dizzy always', 'Get a cold easily', 'Having a headache'. Meanwhile, the research of Hong and Hwang (2003) revealed that the symptoms of 'Decreased ability to concentrate', 'Tired out easily', 'Be dizzy usually', 'Get a cold easily' were frequent symptoms in urban middle school girls which were different symptoms than the results of this research. The symptom of 'Pale face' of anemic girls (1.60 ± 0.97) was significantly higher than the normal girls (1.27 ± 0.61).
Correlation coefficients between hematological indices
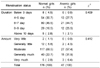
Table 5 shows the correlation coefficients between hematological indices of iron status. The hemoglobin was positively correlated with serum iron (r = 0.515), serum ferritin (r = 0.279) and negatively correlated with TIBC (r = -0.435). The serum iron was positively correlated with serum ferritin (r = 0.175) and negatively correlated with TIBC (r = -0.251). The TIBC was negatively correlated with serum ferritin (r = -0.559).
Correlation coefficients between hematological indices and symptoms
Table 6 shows the correlation between iron parameter and clinical symptoms related to anemia. The hemoglobin and the serum iron were negatively correlated with 'Pale face'. The TIBC was negatively correlated with 'Get a cold easily' (r = -0.138). This research revealed that the hematological indices were correlated with symptoms. Therefore, it is required to provide nutritional education to prevent anemia and iron deficiency and to develop a proper nutrition policy. In case of serious nutritional status for iron deficiency and anemia, there is a need for iron supplementation for promoting nutrition as well as a balanced diet.
Correlation coefficients between hematological indices and physical characteristics
Table 7 shows the correlation between iron parameter and physical characteristics. The Hb was negatively correlated with duration of menstruation (r = -0.157) and amount of menstruation (r = -0.167). The TIBC was positively correlated with body weight (r = 0.143) and amount of menstruation (r = 0.202). And the TIBC was negatively correlated with menarche age (r = -0.201). Serum ferritin was negatively correlated with the amount of menstruation (r = -0.192).
Discussion
The purpose of this study was designed to investigate the iron status, clinical symptom and physical characteristics between normal and anemic groups of second grade middle school girls in the Ulsan metropolitan area. It was carried out with 237 subjects (normal girls 160, anemic girls 47). They were evaluated with a questionnaire and measurement of hematological indices.
BMI (kg/m2) of the normal girls and the anemic girls were 19.54 ± 2.44 and 19.22 ± 2.27, respectively. The menarche age of the anemic group was 12.13 ± 0.92 years, which is significantly low compared with the normal group (12.42 ± 0.88 years). That means blood loss from menstruation can caused iron deficiency or anemia (McGuire & Kathy, 2007). Adolescents, and in particular adolescent girls, are at high risk for the development of a variety of nutritional disorders, including iron deficiency, owing, in part, to the physiological demands of growth. The concomitant occurrence of menarche and subsequent regular menstruation surrounding the growth spurt can challenge adeolescent girls to maintain positive iron (Deegan et al., 2005). If the menarch age is low, they need to take care of dietary intakes of nutrients, especially iron and protein. This result is consistent with Hong et al. (2001). The use of any of the relevant biochemical or hematologic measurements in isolation has the disadvantage of low specificity and sensitivity for iron deficiency. Generally, the presence of two or more abnormal values measuring iron status is indicative of impaired iron status. The combined use of serum ferritin with other measures provides increased accuracy in detecting the stage of iron deficiency and offsets the inadequacies of each measurement used in isolation (Deegan et al., 2005).
The hemoglobin concentration of the anemic girls was 10.84 ± 1.17 g/dl and the serum iron of the anemic girls represent 35.15 ± 27.47 µg/100ml. The hemoglobin of the anemic girls was significantly (p<0.001) low compared with the normal girls. The TIBC of the anemic girls showed significantly high to 449.30 ± 64.87 µg/100ml. The serum ferritin value of the anemic girls was 20.53 ± 42.29 µg/ℓ, it represent significantly lower than that of the normal girls. Iron deficiency, assessed by low serum ferritin levels, is common among female adolescents, affecting 25% to 39% of females aged 10-19 years (Deegan et al., 2005). Especially, the starting age of menstruation affected prevalence of anemia. According to the National Health and Nutrition Survey (Korea Ministry of Health & Welfare 2005), daily iron intake of girls (13-19 years old) was below the RDA. It is reasonable to assume that iron was a significant contributor to the anemia and probable iron deficiency of these school girls (Mousa et al., 2003).
The symptoms of 'pale face' of the anemic girls were higher than the normal girls. The hemoglobin and serum iron were negatively correlated with 'pale face'. The TIBC was negatively correlated with 'get a cold easily'. The menarche age was negatively correlated with TIBC, but body weight was positively correlated with TIBC. The duration and amount of menstruation was negatively correlated with hemoglobin. And the amount of menstruation was negatively correlated with serum ferritin and positively correlated with TIBC. This result revealed that longer duration and more amount of menstruation, the lower iron status and earlier menarche age, the lower iron status. Accordingly, sufficient dietary iron intake is needed for preventing iron deficiency and anemia.
In this study, iron status of the middle school girls was correlated with body weight and menstruation status. The results of this study show that when the iron status was low, the clinical symptom occurred higher. This research is to be utilized as basic data to prevent anemia and to develop a nutritional intervention program. Therefore, it is necessary to have nutritional education and publicity for the recognition of the problems with their nutritional status for iron and its subsequent improvement. In case of serious nutritional status for iron, there is a need for iron supplementation for promoting nutrition as well as a balanced diet.

 XML Download