

 PDF
PDF ePub
ePub Citation
 Print
Print


Introduction
Underreporting of dietary intake has been a frequently recognized problem in nutrition research using the self-reported dietary assessment methodology. The doubly labeled water (DLW) technique is the most widely accepted method to validate reported energy intake (Goris et al., 2000). However, high cost and technical difficulties of DLW made its use less feasible in large sample dietary surveys. Goldberg suggested that reported energy intake could be used to evaluate reported energy intake against presumed energy requirement. Reported energy intake (EI) is expressed as multiples of the estimated basal metabolic rate (BMR) (Lichtman et al., 1992), and the ratio of EI to BMR (EI/BMR) would indicate relative energy reporting status. For example, individuals reporting a lower EI/BMR would report relatively lower energy intake compared to their energy requirements. The WHO defined EI/BMR ratio of 1.55 as a sedentary level of energy expenditure and 1.27 as the 'minimum survival requirement' (Prentice et al., 1986).
Many studies have been done to assess various factors associated with lower EI/BMR ratio. Among them, obesity has been the consistently reported risk factor for dietary underreporting (Goris et al., 2000). Overweight individuals tend to underreport their dietary intake by about 20-50% depending on the population studied and assessment methods used (FAO/WHO/UNO, 1985; Goldberg et al., 1991; Kretsch et al., 1999; Livingstone & Black, 2003). However, many important aspects of underreporting patterns by the level of obesity have not been fully assessed yet, especially the types of nutrient and food that are likely to be underreported and health-related characteristics of individuals who underreport dietary intake.
In this study, we examined the underreporting patterns using the EI/BMR by the level of obesity in the Healthy Women Study (HWS), a community-based longitudinal study (Pennsylvania, USA) to understand the changes in cardiovascular risk factors in healthy premenopausal women as they go through menopause. We were particularly interested in the following questions; 1) if obesity measured by body mass index (BMI) is related to the relative underreporting of energy intake, 2) if the relative energy reporting status is associated with cardiovascular risk factors, and macronutrient and specific food group intake, and 3) if the underreporting pattern is different by the level of obesity.
Subjects and Methods
Study participants included 538 healthy premenopausal women from the HWS. The study eligibility criteria included the following: age 42-50 years; menstrual bleeding within the last 3 months; diastolic blood pressure less than 100 mmHg; no medication use known to influence cardiovascular risk factors (e.g., estrogen, insulin, lipid-lowering drugs, thyroid, anti-hypertensive, and psychotropic medication). Details of the HWS study had been reported previously (Matthews et al., 1989; Sutton-Tyrrell et al., 2002).
Data from the baseline examination were used, which included dietary intake, anthropometry, and cardiovascular risk factors.
Nutrient and food group intake
Dietary intake was evaluated by the one-day 24-hour dietary recall and a semi-quantitative food frequency questionnaire (FFQ). The dietary recall interview was done by a trained nutritionist using three-dimensional models of food portions in a clinical setting. Nutrient intake was calculated using a computerized nutrient database, which was a compilation of nutrient data mainly from the U.S. Department of Agriculture, Revised Handbook No.8 (Human Nutrition Information Service, 1976-87), and the Multiple Risk Factor Intervention Trial (MRFIT) data (Dolecek et al., 1997). Keys score was calculated from dietary intake of cholesterol, saturated fat and polyunsaturated fat as a composite indicator of fat intake. Higher score indicates higher projected changes in serum cholesterol (mg/dl) (Keys & Parlin, 1966).
The semi-quantitative FFQ was originally developed for the MRFIT as a qualitative measure of fat intake. The interviewer asked the participants about weekly consumption frequency of items from 22 food groups. There were four response categories: "never", "1-3 times per month", "1-3 times per week", and "4 or more times per week."
Relative energy reporting status (EI/BMR)
In a weight-stable person, the reported EI should be equal to total energy expenditure which mainly consists of BMR (60%) and energy for physical activity (30%) (Horton, 1983). BMR was calculated with the equation made by Schofield and adopted in the 1985 FAO/WHO/UNU reports (Voss et al., 1998).
BMR (kcal) = (8.7* wt in kilogram) - (25* ht in meter) + 865
Most of the inter-individual variance arising from differences in physical characteristics (weight, height, and age) is automatically removed by the use of BMR as the denominator. EI/BMR could be considered as a measure of relative energy reporting status after adjusting for the physical activity level (Schofield, 1985).
Body mass index
Height was recorded to the nearest 0.5 centimeter, and weight was recorded to the nearest 0.1 kilogram using a balance beam scale. Body Mass Index (BMI) was computed as body weight divided by height squared and stratified into 2 groups: normal weight group (BMI<25 kg/m2) and overweight group (BMI≥25kg/m2).
Cardiovascular risk factors
Fasting blood was drawn to measure insulin, glucose, and serum lipids. Blood pressure was measured. A questionnaire was used to assess alcohol consumption and smoking status. Physical activity, expressed as kilocalories expended per week, was measured using the Paffenbarger Physical Activity Questionnaire (Paffenbarger and Wing, 1978).
Statistical analysis
Student t-test was used to compare EI/BMR between the two BMI groups. Then, analyses were conducted separately for normal weight and overweight groups. The EI/BMR ratio was categorized by the tertile groups. The associations between the baseline cardiovascular risk factors and the tertiles of EI/BMR were examined using analysis of variance (ANOVA) and chi-square test. Multivariate regression was used to examine the associations between EI/BMR and macronutrient intake expressed as both absolute nutrients intake and nutrients density (percentage of total energy intake) after controlling for age, BMI, physical activity, and smoking status. The association between the food group intake and the EI/BMR was compared by chi-square test.
To examine if the underreporting pattern is different by the level of obesity, we made cross product terms of the EI/BMR ratio and BMI categories and examined their significance in the multivariate regression models.
All statistical analyses were conducted using the SPSS 11.5 statistical packages, and statistical significance was set at p<0.05. All p values were 2-tailed.
Results
Table 1 shows general characteristics and reported energy intake of the study participants by the level of obesity. About 36% (196 women) of the study population was either overweight (BMI≥25 kg/m2, 25.1%) or obese (BMI≥30 kg/m2, 11.3%). Normal weight women are more likely to be a white, a college graduate and physically active than overweight women. Mean reported EI and estimated BMR (mean ± SD) of the study population were 1757 ± 621 kcal and 1402 ± 113 kcal, respectively. Mean EI/BMR (mean ± SD) was 1.26 ± 0.45. While the estimated BMR was greater among overweight women than that of normal weight women, the reported EI was not significantly different by the level of BMI, which resulted in a significantly lower EI/BMR in overweight women.
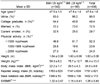
Table 2 shows baseline cardiovascular risk factors by BMI category-specific tertiles of the EI/BMR ratio. The proportion of college graduates increased from the lowest to the highest tertile of the EI/BMR in both BMI groups. A non-significant increasing trend was seen for cholesterol and LDL cholesterol across EI/BMR tertiles. The lowest tertile groups of the EI/BMR ratio in both normal weight and overweight groups reported the lowest total energy intake (table 3) while having the highest BMI and not being less physically active.
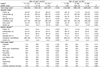
The associations of EI/BMR with macronutrient and food group intake are presented in Table 3. Total energy intake increased by the EI/BMR tertiles. Accordingly, all macronutrient intakes and Keys score increased (all p<0.001 except Keys score). The macronutrient composition of the diets varied by relative energy reporting status. The increasing trend of nutrient density for fat and saturated fat and the decreasing trend of carbohydrate and protein were more prominent in the overweight group. Normal weight women in the higher tertiles of EI/BMR were more likely to report consuming ≥ 4 times/wk of sugar/candy, cream and red meat groups than the lower tertile groups. This pattern was also observed in the overweight women group, but did not reach statistical significance. The consumption of other food groups like vegetables, fruit, poultry/fish, and whole grain foods were reported similarly across the EI/BMR tertiles.
There was no significant interaction between EI/BMR and BMI categories on macronutrient and specific food group intake (data not shown).
Discussion
The findings of this study showed the selective underreporting of nutrient and food group intake by relative energy reporting status in healthy premenopausal women; furthermore, this pattern was not modified by the level of obesity.
The consumption of sugar, cream, baked goods, and red meat groups, which are generally considered unhealthy or fattening, were reported significantly differently across the EI/BMR tertiles. This relationship was observed in both normal weight and overweight women. Although we were not able to directly compare such reporting patterns with actual dietary intake, this pattern may be in part due to participants' disinclinations to report socially undesirable foods. Indeed, HWS participants were relatively well educated, highly-motivated and might have been more conscious of health issues than the general population. These results suggest that measurement and evaluation of dietary intake in a free living population is complex. Selective underreporting may occur when relatively well validated dietary methodologies are used to estimate total energy intake (Black et al., 1991). Therefore, simple adjustment of total energy intake as used in Stallone et al. (Stallone et al., 1997) might be limited to completely correct the bias in self-reported nutrient and food group intakes.
Another issue related to the effect of BMI-related underreporting lies on understanding of the relationship between dietary intake and diseases. The selective reporting bias might weaken the associations of specific nutrient intake with diseases. Prentice (Prentice, 1996) suggested the possible role of BMI-related underreporting of fat intake on the observed null association between fat intake and breast cancer in case-control and cohort study. McCrory, et al. also demonstrated the relationships of low fiber intake and high fat intake with the degree of obesity could be underestimated by dietary underreporting (McCrory, 2002). Underreporting might also affect the mediatory variables in dietary intervention studies aiming at modifying nutrient composition of diets (for example, reducing fat intake). This issue is currently being evaluated in the Women Health Initiative (Anderson et al., 2003).
In this study, 28% of women reported their EI less than their estimated BMR (data not shown). This pattern has been also reported in other large population based epidemiologic studies such as the British Whitehall Study (Stallone et al., 1997) and the Ontario Healthy Study (Pomerleau et al., 1999). Our mean EI/BMR ratio of 1.26 is very similar to that of middle aged women (30-59 years old) from the Third National Health and Nutrition Examination Survey (1988-1991) (Kant et al. 2002). These universal findings of dietary underrerporting suggest more efforts are needed to elucidate the nature of dietary underreporting.
Because underreporting might exist at all the levels of the EI/BMR, we used the tertiles of EI/BMR instead of using pre-established the Goldberg Cutoff Value to identify relatively low energy reporters. The Goldberg Cutoff may be limited by low sensitivity to identify inaccurate intake reports (Black, 2000) and be only able to identify extremely inaccurate reporting (McCrory, 2002).
Interestingly, the lowest tertile of the EI/BMR ratio in normal weight and overweight groups had lower total cholesterol and LDL cholesterol, which was consistent with reported lower saturated fat and Keys score. This finding may indicate the lower reported fat intake of the lowest tertile group was partly caused by the dietary restriction of fat and saturated fat intake.
Our study has limitations. One-day 24-hour dietary recall is limited to reflect an individual's usual intake and to provide information on day-to-day within-individual variation in dietary intake. It has been estimated that dietary intake measurements are required for between 7 and 32 days to correctly assess an individual's energy intake with 90% confidence (Marr, 1986; Nelson, 1989). Therefore, some respondents classified in the lowest tertile group may have reported accurate intakes for the day while some in the highest tertile group might have underreported their intake. However, we were unable to ascertain to what extent the reported dietary intake were biased or valid. Also, due to the relatively small sample size and homogenous characteristics of the study population, the distribution and range of BMI and EI/BMR were limited to fully examine the effects of the BMI levels on underreporting patterns.
In conclusion, our study showed that underreporting is related to BMI even in normal weight women, the relative energy reporting status is associated with cardiovascular risk factors, macro-nutrients and foods group intake, and the underreporting pattern is not modified by weight status. Caution should be taken into account to assess the consequences of underreporting patterns in self-reported dietary intake in both normal weight and overweight women. More efforts should be given to improve dietary assessment methods.

 XML Download