

 PDF
PDF ePub
ePub Citation
 Print
Print


Introduction
Excessive weight in childhood is a serious public health problem because of its costly health consequences later in life and increasing prevalence in Korea. In two decades in Korea, the prevalence of obesity in 6-11 year olds has increased by 4 times in girls and nearly 6 times in boys (Kang & Hong, 1997). In boys, the obesity rate of elementary school children, aged 10-14, was highest (17.9%), followed by 13.9% in aged 15-19. In girls, the obesity rate (13.5%) was highest among middle and high school students, aged 15-19, showing a trend of increasing obesity rates when getting older (Ministry of Health and Welfare, 2006).
Child obesity is significantly related to adult obesity and early development of chronic disease (Zwiauer et al., 1992). Obese children also suffer from a lower-esteem that affects their school performance and their peer relationships, leading to long-term psychological effects (Tershakovec et al., 1994). Lifestyle factors associated with obesity include eating habits, physical activities, and sedentary life styles. Studies have shown that the likelihood of obesity in children is 12% higher for each hour of TV viewing, and 10% lower for each hour of moderate to vigorous physical activity (Crooks, 2000; Hernandez, 1997). Snacking is considered an important factor for being obese in children (Cross, 1994; Heald, 1992; Jahns, 2001; Jimenz-cruz, 2002; Lytle, 2000). The average size of snacks and energy per snack has remained relatively constant in children while the number of snacking occasions increased significantly as their age increased (Cross, 1994; Jahns, 2001).
For a balanced diet for healthy children, especially for aged 11-12, Dietary References Intakes for Koreans (KDRIs) food guides recommend 3 servings of grains, 2 servings of milk/milk products, 4 servings of meat and beans, 2 servings of fruits, 5 servings of vegetables, and 4 servings of fats and sweets (Korean Nutrition Society, 2005). Munoz et al. (1997) reported that only 1% of the surveyed US children meet 100% of the dietary guidelines of American children. Neumark-Sztainer et al. (2002) reported that the percentages of youth consuming the recommended amounts of fruits and vegetables were about 45% for fruits and 16% for vegetables.
Because daily serving numbers of each food group in children had not been specified in Korea until 2005, studies regarding compliance of the KDRIs food group were limited. The Park et al. (2005) showed that only 18.2% of the subjects consumed all five food groups, and about 10% of the subjects consumed only three food groups of grains, vegetables, and fruits. Lim (2001) reported 41.5% preschoolers did not consume any fruits a day and 45% only took one kind of dairy products.
The purpose of this study was to identify eating and physical activity patterns associated with obesity among school children in Seoul, Korea. Specifically, the aim of this study is to compare the obese children's food group intakes with the new KDRIs food guides for children, aged 11-12. This study will also determine the obesity-related factors in this area of children. In doing so, the study seeks to identify high-risk groups, and further studies will be conducted on developing effective solutions through school policies and interventions as well as recommendations for family practices that would help to reverse the problem.
Subjects and Methods
This is a cross-sectional study of 799 school children in Seoul, Korea. The study was conducted in 2005 and included eight elementary schools in Seoul and its surrounding areas. Fifth and sixth grade children at selected elementary schools were invited to participate in this study. The dietitian sent a survey form describing the project and a questionnaire to each family prior to data collection. The questionnaire included child demographics, family history of chronic diseases, such as obesity, diabetes, high blood pressure, and heart diseases, eating habits, and life style. The questions for the family history of chronic diseases included 5 items, one of the questions was: "Has any one in the family including your child's extended family ever had diabetes? If yes, write the relationship between the child and the person who has the history of diabetes." The food group intakes of the subjects were assessed with a revised questionnaire which was previously used in other research (Ha et al., 2005). The questionnaire for food group intake included the following items: grains (carbohydrates rich food), meats, beans, and eggs (protein rich food), dairy products, fruits, and vegetables. Questions consisted of the definition of the food group, food sources, serving size, and frequency. Categories for each answer were divided into subgroups according to the KDRIs food guidelines for Korean children: less than and equal to, or more than standard number of servings for each food group. For the assessment of snacking habits, 4 questions were asked, and one of sample questions was: "In general, does your child eat foods such as sweet snacks, candy bars, ice cream or drinks, soft drinks, etc.; Write the number of servings per day, (or week) and the kinds of snacks." The reported numbers of snack servings (high fat snacks or high sugar snacks) were divided into 3 categories, everyday, 4-6 times per week, and 1-3 times per week. Parents were asked to report how many minutes, or hours per day or per week, their children spent playing, exercising and watching television or using computer games. The measurement of daily hours/minutes of physical activity were divided into 3 subgroups: less than 1 hour, 1-2 hour, and more than 2 hours.
The obesity index (%) was calculated with the formulas as below. Standard body weight is the 50th percentile value of same age, sex, and height according to the 1998 Korean growth standard (KOR). Children with an obesity index value of equal to or greater than 20 were classified as obese (Korean Society of Pediatrics, 1999).
Statistical analysis
Of the 850 children that participated, 799 cases for which there was complete information were included in the statistical analysis. The statistical package program of SPSS PC+ was used for all of our statistical analysis. Standard quality checks were performed in 10% of the cases. Frequency distributions and cross tabulations were used to evaluate and edit the data. All variables were categorized using cut-off points based on percentiles or standard definitions. The t-tests were used for the continuous variables, and chi-square or Fisher's exact tests were used for the categorical variables. The crude odds ratio was used as a measure of association (Rosner, 2000).
Results
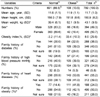
Our subjects were divided into 2 groups: the normal and the obese, according to the obesity index (%) (Table 1). The total numbers of subjects were 799, with 49.3 (%) male and 50.7 (%) female. The distribution of age and sex in two groups were similar. The mean age of the subjects was 11years (0.6), ranged 11-12 years. The Mean Obesity index (%) of the normal and the obese were -3.2% (11.4) and 33.4% (10.3) respectively (p<0.05). The percentages of normal and obese children were 86.5% (691) and 13.5% (108) respectively. Ten percent of females and 16.8% of males among all children were obese (p<0.05). Of the family histories of chronic diseases surveyed, significantly the higher family history of obesity in the obese group, compared to normal children (41.8% in the obese vs 14.4% in the normal (p<0.05)) was reported. Obese children had 32% of family histories of diabetes and 21% of high blood pressure. But those values were not statistically different with the percentage of the normal's family histories.
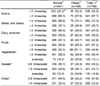
In Table 2, similar trends in eating frequencies in grains, meats and beans, fruits, and dairy products were found between normal and obese children. Almost two-thirds of obese children in the study (67.7%) consumed more than 3 grain servings per day, recommended KDRIs food guide. Only one-third (26.9%) of obese childrens consumed recommended daily servings of meat and bean groups. In reported fruit intakes, 56.9% of obese child met recommended daily servings of fruits. A slightly higher percentage of obese children (62%) consumed more daily recommended servings of dairy products than the normal (55%) without significant differences.
The eating practices in vegetables (p<0.05) and snacks (p<0.05) were somewhat different between normal and obese children. A greater percentage of normal children (58%) met KDRIs guidelines of vegetables, 5 servings a day, than obese children (38.9%) (p<0.05). More obese children reported eating both high fat- and high sugar-snacks every day than did normal children (sweets: 30.6% vs 10.4% (p<0.05), chips: 30.6% vs 12.0% (p<0.05)). Among obese children, 35.1% of obese children reported eating sweet snacks 3 times per week, with 30.6% eating every day and 34.3% eating less than 3 times per week. About 38% of the obese children reported eating high fat snacks 3 times per week, 30.6%, everyday and 35.2%, less than three times per week.
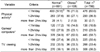
According to the Health Guideline for school children, children are recommended to have at least 60 minutes of physical activity daily and to have limitation of inactive forms of play (Corbin Pangrazi, 1998a). Table 3, 71% of the obese and 57.6% of the normal reported exercising less than 1 hour per day at home, and those values were statistically different (p<0.05). About 1/3 of the obese (27%) had physical activities at home for 1-2 hours per day and only 1.9% for more than 2 hours per day. Sixty two percent (62%) of obese children played games for more than 2 hours per day, compared with 55% of the normal (p<0.05). Only 14.8% of the obese reported playing computers (computer games) less than 1 hour per day and 23% for 1-2 hour/day. There was no significant difference in daily hours of TV viewing between the normal and the obese. Only 33% of the obese reported watching television less than 1 hour per day, 33% for 1-2 hour/day, and 33% for more than 2 hours/day.
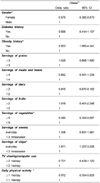
Table 4 includes the results of the association between various factors and obesity. Gender was shown to be significantly associated with the probability of obesity. Girls showed less likelihood of being obese with statistical significance (odds ratio, 0.575, CI (0.380, 0.870), p<0.05). A family history of obesity almost doubled the likelihood of obesity in children (odds ratio, 2.653, CI (1.660, 4.241), p<0.05). The number of servings of grains, meats and beans, dairy products, and fruits, according to KDRIs guidelines, had no protective effect on obesity in children. Eating 5 or more vegetable servings per day showed protective association with obesity (odds ratio, 0.460, CI (0.304, 0.697), p<0.05). Eating high fat snacks, such as chips, everyday increased double likely to be obese than eating less than 3 times per week (odds ratio, 1.91, CI (1.207, 3.2051), p<0.05). Exercising one or more hours per day significantly decreased likelihood of being obese (odds ratio, 0.572, CI (0.354, 0.0.925), p<0.05).
Discussion
In this study, the obesity rate of children was 13.5%, and the value is not yet as high as the obesity rate in American children (Ha et al., 2005). However, the problem is the rapidly increasing obesity rate in Korean school children, as was already reported in other studies (Kang & Hong, 1997; Lee et al., 1999; You et al., 1997). The factors that are associated with obesity in this study included snacking, vegetable consumption, daily hours of physical activity and computer games/computer usage. Eating improper servings of vegetables or eating too much of fatty or sugary snacks are significantly associated with the development of obesity (Lee et al., 2000; Lee et al., 2002). The snacking prevalence and the daily intakes from snack in children has increased over the decade, thus leading to poor nutrition status and increased adiposity in children (Jahns et al., 2001, Niclas et al., 2001).
More hours of physical activity and less hours of computer usage was found to be decreased the likelihood of being obese in this study (Table 3 & Table 4). These results were consistent with other studies showing positive correlation between physical inactivity and obesity in children (Andersen, 1998; Crespo, 2001; Epstein, 2001; Lowry, 2002). Data from the National Health and Nutrition Examination Survey (NHANES) III revealed that children who had physical inactivity 4 or more hours each day were most likely to be obese (Andersen, 1998). Lee et al. (2000) suggested that television viewing contributes to the development of overweight among children by reducing opportunities to engage in physical activity and increasing opportunities for snacking.
In this study, girls had less likelihood of being obese than boys (odds ratio, 0.64, CI (0.43, 0.93), p<0.05, Table 4). Some studies reported gender differences in obesity. Neumark-Sztainer et al. (2002) reported the significant differences in nutrient and food intake patterns between girls and boys. Lee et al. (2002) reported that the male subjects exercised more frequently and longer than the females. This sex difference indicates the needs of different obesity interventions, such as different diet therapy and exercise regimens.
Family history of obesity increased the probability of having obesity in children (Table 4). Our findings are also concurrent with other studies indicating the genetic effect of obesity (Bouchard, 1989; Stunkard, 1990; You, 1997). However, we admitted that the findings of the family history of chronic diseases are somewhat predictable because unexpected lower prevalence of the family history of heart diseases reported by the subjects and their parents. This may be due to the fact that they are not well aware of health conditions or the characteristics chronic diseases.
Food intakes or nutritional status can be assessed in many different ways. The common assessment is to get 24-hour food records from the subjects and calculate them as nutrient intakes. Food group intakes have also been accepted for rapid and convenient dietary assessment methods. Variety of food, such as DVS (Dietary Variety Score) or DDS (Dietary Diversity Score), has been used as an index of dietary quality or dietary intake (Um et al., 2006).
The KDRIs (Dietary References Intakes for Koreans) food guides include daily serving numbers of food group according to recommended daily calorie-intakes. For example, children aged 11-12, should have 3 servings of grains, 4 meats and beans, 2 dairy products, 2 fruits, 5 vegetables, and 4 fats and oils. To follow the daily serving numbers and one serving size is important to maintain good health of children.
This study applied food group intakes as an assessment tool for identifying eating patterns in children. This study was based on self-reports and a single report. Thus the interpretation of the results of this study may be restricted. However, this is the first study to determine the compliance of newly established KDRIs food guides in children. This study also strongly reported that a large percentage of obese children in this area had inappropriate eating patterns and physical activities, and thus more studies regarding this area is warranted. For using KDRIs food group intakes as dietary assessment methods, two things are still needed to solve; ignorance about the KDRIs food guides, which is still prevalent both in children and their parents, and proper one serving sizes for children and preschoolers.
In conclusion, inadequate servings of vegetables and frequent snacking habits contributed on increasing obesity rate in this area of children. Another factors associated with obesity were the family history of obesity, gender, and physical activity, suggesting that careful monitoring of eating habits and nutrition education of KDRIs and food guides are needed.
 XML Download