

 PDF
PDF ePub
ePub Citation
 Print
Print


Abstract
The aims of this study were to estimate daily intake of macrominerals from beverages, liquid teas, and liquid coffees and to evaluate their potential health risks for Korean children and adolescents (1-to 19 years old). Assessment of dietary intake was conducted using the actual level of sodium, calcium, phosphorus, potassium, and magnesium in non-alcoholic beverages and (207 beverages, 19 liquid teas, and 24 liquid coffees) the food consumption amount drawn from "The Fourth Korea National Health and Nutrition Examination Survey (2007-2009)". To estimate the dietary intake of non-alcoholic beverages, 6,082 children and adolescents (Scenario I) were compared with 1,704 non-alcoholic beverage consumption subjects among them (Scenario II). Calculation of the estimated daily intake of macrominerals was based on point estimates and probabilistic estimates. The values of probabilistic macromineral intake, which is a Monte-Carlo approach considering probabilistic density functions of variables, were presented using the probabilistic model. The level of safety for macrominerals was evaluated by comparison with population nutrient intake goal (Goal, 2.0 g/day) for sodium, tolerable upper intake level (UL) for calcium (2,500 mg/day) and phosphorus (3,000-3,500 mg/day) set by the Korean Nutrition Society (Dietary Reference Intakes for Koreans, KDRI). For total children and adolescents (Scenario I), mean daily intake of sodium, calcium, phosphorus, potassium, and magnesium estimated by probabilistic estimates using Monte Carlo simulation was, respectively, 7.93, 10.92, 6.73, 23.41, and 1.11, and 95th percentile daily intake of those was, respectively, 28.02, 44.86, 27.43, 98.14, and 3.87 mg/day. For consumers-only (Scenario II), mean daily intake of sodium, calcium, phosphorus, potassium, and magnesium estimated by probabilistic estimates using Monte Carlo simulation was, respectively, 19.10, 25.77, 15.83, 56.56, and 2.86 mg/day, and 95th percentile daily intake of those was, respectively, 62.67, 101.95, 62.09, 227.92, and 8.67 mg/day. For Scenarios I·II, sodium, calcium, and phosphorus did not have a mean an 95th percentile intake that met or exceeded the 5% of Goal and UL.
Figures and Tables
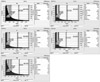

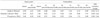
Table 4
Probability density functions fitted by Crystal Ball®fitting program using the data of nutrients and food additives content in non-alcoholic beverages
![]()

References
1. Statistics Korea. Korea Statistical Information Service (KOSIS), press release (2009-08-09). 2009. Daejeon: Statistics Korea;Available from: http://kosis.kr/abroad/abroad_01List.jsp?parentId=D.
2. Boulton TJ, Magarey AM, Cockington RA. Tracking of serum lipids and dietary energy, fat and calcium intake from 1 to 15 years. Acta Paediatr. 1995; 84(9):1050–1055.

3. Lee JM, Park HJ, Park SM. A survey on eating behaviors of preschool children for development snack. Korean J Food Cult. 2003; 18(2):151–159.
4. Choi YS, Chang N, Joung H, Cho SH, Park HK. A study on the guideline amounts of sugar, sodium and fats in processed foods met to children's taste. Korean J Nutr. 2008; 41(6):561–572.
5. World Health Organization. Diet, nutrition and the prevention of chronic diseases: report of a joint FAO/WHO Expert Consultation. WHO Technical Report Series 916. 2003. Geneva: World Health Organization.
6. Korea Centers for Disease Control and Prevention, Ministry of Health and Welfare. The Third Korea National Health and Nutrition Examination Survey (KNHANES III), 2005 -Nutrition Survery-. 2006. Cheongwon: Korea Centers for Disease Control and Prevention.
7. Food Standards Agency. Salt and health. 2003. London: Food Standards Agency.
8. Institute of Medicine. Dietary reference intakes for water, potassium, sodium, chloride, and sulfate. 2004. Washington, D.C.: National Academies Press.
9. Kang BS, Park MS, Cho YS, Lee JW. Beverage consumption and related factors among adolescents in the Chungnam urban area. Korean J Community Nutr. 2006; 11(4):469–478.
10. Song MJ, An EM, Shon HS, Kim SB, Cha YS. A study on the status of beverage consumption of the middle school students in Jeonju. Korean J Community Nutr. 2005; 10(2):174–182.
11. Breslau NA, McGuire JL, Zerwekh JE, Pak CY. The role of dietary sodium on renal excretion and intestinal absorption of calcium and on vitamin D metabolism. J Clin Endocrinol Metab. 1982; 55(2):369–373.
12. Avioli LV. Shils ME, Young VR, editors. Calcium and phosphorus. Modern Nutrition in Health and Disease. 1988. 7th edition. Philadelphia: Lea & Febiger;p. 142–158.
13. Kim SH, Choi BY. Ca and P balance in Korean female adolescents. Korean J Nutr. 2001; 34(4):433–439.
14. Jeong HK, Kim JY, Lee HS, Kim JY. The effect of dietary calcium and phosphate levels on calcium and bone metabolism in rats. Korean J Nutr. 1997; 30(7):813–824.
15. Institute of Medicine. Dietary reference intakes for calcium, phosphorus, magnesium, vitamin D, and fluoride. 1997. Washington, D.C.: National Academies Press.
16. The Korean Nutrition Society. Dietary reference intakes for Koreans. 2010. 1st revision. Seoul: The Korean Nutrition Society.
17. Renwick AG. Needs and methods for priority setting for estimating the intake of food additives. Food Addit Contam. 1996; 13(4):467–475.
18. Nutriscan Limited, Trinity College. An evaluation of the methodologies for the estimation of intakes of food additives and contaminants in the European community. 1992. Dublin: Nutriscan Limited.
19. Codex Alimentarius Commission. Guidelines for simple evaluation of food additive intake. 1989. Rome: Food and Agriculture Organization.
20. Yoon HJ, Lee MG, Lee CH, Lee JO, Lee CW. Assessment of maximum use levels and estimation of theoretical maximum daily intake for 9 food additives in Korea by the Budget Method. J Food Hyg Saf. 1999; 14(2):186–194.
21. Yoon HJ, Park HK, Lee CH, Park SK, Park JS, Kim SH, Lee JO, Lee CW. Assessment of estimated daily intake for preservatives by maximum permitted level and national food disappearance data. J Food Hyg Saf. 2000; 15(3):179–185.
22. World Health Organization. Principles and methods for the risk assessment of chemicals in food: a joint publication of FAO and WHO. Dietary exposure assessment of chemicals in food. 2009. Geneva: World Health Organization;Environmental Health Criteria 240, Chapter 6.
23. Korea Centers for Disease Control and Prevention, Ministry of Health and Welfare. The Fourth Korea National Health and Nutrition Examination Survey (KNHANES IV-3). 2009. Cheongwon: Korea Centers for Disease Control and Prevention.
24. Kim SD, Moon HK, Park JS, Yang HR, Yi YJ, Han EJ, Lee YC, Shin GY, Kim JH, Chae YZ. The content of macrominerals in beverages, liquid teas, and liquid coffees. J Korean Soc Food Sci Nutr. 2012; 41(8):1134–1143.
25. Kim SD, Yun ES, Chang MS, Park YA, Jung SO, Kim DG, Kim YC, Chae YZ, Kim MY. Survey of daily caffeine intakes from children's beverage consumption and the effectiveness of nutrition education. J Korean Soc Food Sci Nutr. 2009; 38(6):709–720.
26. Kang MH, Yoon KS. Elementary school students' amounts of sugar, sodium, and fats exposure through intake of processed food. J Korean Soc Food Sci Nutr. 2009; 38(1):52–61.
27. The Korean Nutrition Society. Dietary reference intakes for Koreans. 2010. 1st revision. Seoul: The Korean Nutrition Society.
28. Vaskonen T. Dietary minerals and modification of cardiovascular risk factors. J Nutr Biochem. 2003; 14(9):492–506.
29. Maurice ES, Vernon RY. Shils ME, Young VR, editors. Nutrition and diet in hypertension. Modern Nutrition in Health and Disease. 1988. 7th edition. Philadelphia: Lea & Febiger;p. 1272.
30. Choi MK, Lee WY, Park JD. Relation among mineral (Ca, P, Fe, Na, K, Zn) intakes, blood pressure, and blood lipids in Korean adults. Korean J Nutr. 2005; 38(10):827–835.
31. Stamler J, Cirillo M. Dietary salt and renal stone disease. Lancet. 1997; 349(9050):506–507.
32. Morris RC, Sebastian A. Laragh JH, Brenner BM, editors. Potassium-responsive hypertension. Hypertension: Pathophysiology, Diagnosis, and Management. 1995. 2nd edition. New York: Raven Press.
33. Korea Centers for Disease Control and Prevention, Ministry of Health and Welfare. The Fourth Korea National Health and Nutrition Examination Survey (KNHANES IV-1). 2007. Cheongwon: Korea Centers for Disease Control and Prevention.
 XML Download