

 PDF
PDF ePub
ePub Citation
 Print
Print


Abstract
The purpose of this study was to investigate consumption of health functional food (HFF) and dietary habits, nutrient intake, and dietary quality by HFF consumption in college students. The subjects of this study included 283 college students (179 males and 104 females) in Incheon metropolitan city. The cross-sectional study was conducted using self-reported questionnaires, including kinds of HFF consumed, motivation for purchase, reason for consumption, effect after consumption, reason for no consumption, and dietary habits. A three-day recall method was used for dietary assessment. Dietary qualities were assessed using nutrient adequacy ratio (NAR), mean adequacy ratio (MAR), and nutrient density (ND) values. The percentage of HFF consumption was 40.2% in males and 50.0% in females. The main kinds of HFF consumed by males were vitamins and minerals, red ginseng, protein, and omega-3 fatty acid, in that order. HFF consumed by females were vitamins and minerals, red ginseng, omega-3 fatty acid, and individually approved functional ingredients, in that order. The main motivation for purchase of HFF was recommendation of family and relatives (males 76.4% and females 78.8%). The main reason for consumption of HFF was health promotion (males 67.7% and females 63.5%) and the main reason for no consumption of HFF was not having a health problem (males 49.5% and females 46.2%). The dietary habit score for ‛eat the milk or dairy product everyday’ (p < 0.05) in females was significantly higher in HFF consumers, compared to HFF non-consumers. In males, the ND of vitamin B1 (p < 0.05) in HFF consumers was significantly higher compared to HFF non-consumers. In females, HFF consumers showed a significantly higher ND of vitamin B2 (p < 0.05) and Ca (p < 0.01), compared to HFF non-consumers. Regardless of HFF consumption, the NAR of vitamin C, folic acid, and Ca was less than 0.7. These results suggest the need for nutrition education for college students in order to improve dietary habits and for balanced nutritional status, and to provide correct information on HFF.
Go to : 
REFERENCES
1). Korea Health Statistics 2010: Korea National Health and Nutrition Examination Survey (KNHANES V-1). Cheongwon: Korea Centers for Disease Control and Prevention;2010. [cited 2012 Nov 19]. Available from. http://knhanes.cdc.go.kr/.
2). Heo KO, Lee EH, Kim SW, Kim KJ, Cha KO. Consumer’s trend and market. Paju: Kyomun Publishing Co.;2006. p. 77–89.
3). Korea Food & Drug Administration. Information for health functional food. Cheongwon: Korea Food & Drug Administration;2012. [cited 2012 Nov 19]. Available from. http://www.foodnara.go.kr/hfoodi.
4). Nutrition Business Journal. NBJ’s supplement business report. New York, NY: Penton Media, Inc.;2012.
5). Korea Health Industry Development Institute. Weekly health industry trend. Cheongwon: Korea Health Industry Development Institute;2011.
6). Korea Centers for Disease Control and Prevention, Ministry of Health and Welfare. The 4th Korea National Health and Nutrition Examination Survey. Cheongwon: Korea Centers for Disease Control and Prevention;2008.
7). Jung KH. Research direction for functional foods safety. J Food Hyg Saf. 2010; 25(4):410–417.
8). Kim BR. A study on nutrition knowledge, dietary habits, health-related life style and health condition of college students in Chun-cheon. J Korean Soc Food Sci Nutr. 2006; 35(9):1215–1223.
9). Lee YN, Lee JS, Ko YM, Woo JS, Kim BH, Choi H. Study on the food habits of college students by residences. Korean J Community Nutr. 1996; 1(2):189–200.
10). Heo SY, Cheon HM. Interest in the appearances, cosmetic surgery and skin care practice by the high school and college students. J Beauty Trichology. 2008; 4(2):183–190.
11). Kim SH. A study on the use of health functional foods and its related influencing factors of university students in Korea. Korean J Food Cult. 2010; 25(2):150–159.
12). Jin YH, You KH. A study on the eating habit and eating out behavior of the university students in the Gyeonggi area. Korean J Community Nutr. 2010; 15(5):687–693.
13). Kim SH, Han JH, Kim WY. Health functional food use and related variables among the middle-aged in Korea. Korean J Nutr. 2010; 43(3):294–303.

14). Kim SH. A survey on the use of and significant variables for health functional foods among Korean elderly. Korean J Food Cult. 2011; 26(1):30–38.
15). Lee MY, Kim JS, Lee JH, Cheong SH, Chang KJ. A study on usage of dietary supplements and related factors in college students attending web class via internet. Korean J Nutr. 2001; 34(8):946–955.
16). Kwak JO, Lee CH, You HE, Sung HI, Chang KJ. Regional differences in dietary supplement use and related factors among college students participating in nutritional education programs via the internet. Korean J Community Nutr. 2002; 7(5):639–653.
17). Lee HS, So YH. The effects of diet performance on physical self-worth in college student’s. J Sport Leis Stud. 2005; 25:715–727.
18). Bailey RL, Gahche JJ, Lentino CV, Dwyer JT, Engel JS, Thomas PR, Betz JM, Sempos CT, Picciano MF. Dietary supplement use in the United States, 2003-2006. J Nutr. 2011; 141(2):261–266.
19). Chang HS, Kim MR. Effect of social-economic factors and related factors of health and lifestyle on health foods intakes among the middle aged in the Jeonbuk region. Korean J Community Nutr. 2001; 6(4):617–627.
20). Kim YS, Kim KJ, Kim EJ. Effects of taking protein supplements on the body structure and muscular function in weight training. J Sport Leis Stud. 2001; 16:281–296.
21). Kim JS, Jung DS, Park DH. A survey of ergogenic acid supplementation in elite bodybuilder. Korean J Sport Sci. 2012; 23(1):155–166.
22). Kim YS, Park JY. The analysis on appearance management of male college students: focused on management of hair, skin, cosmetic surgery, fashion and body shape. Korean J Hum Ecol. 2009; 18(1):259–273.
23). Yoon GA, Hwang HJ. Effect of dietary protein and calcium levels on calcium metabolism of the rat. J Korean Soc Food Sci Nutr. 2005; 34(2):176–180.
24). Byrd-Bredbenner C, Wardlaw GM. Wardlaw’s perspectives in nutrition. 8th edition.Boston, MA: McGraw-Hill;2009.
25). Chung HK, Lee HY. Consumption of health functional foods according to age group in some regions of Korea. J Korean Diet Assoc. 2011; 17(2):190–205.
26). Yoo YJ, Hong WS, Youn SJ, Choi YS. The experience of health food usage for adults in Seoul. Korean J Soc Food Cookery Sci. 2002; 18(2):136–146.
27). Yeo JH, Kim EY. University students’ health habits and relevant factors. J Korean Acad Soc Nurs Educ. 2010; 16(2):283–291.
28). Jang HB, Lee HY, Han YH, Song J, Kim KN, Hyun T. Changes in food and nutrient intakes of college students between 1999 and 2009. Korean J Community Nutr. 2011; 16(3):324–336.
29). Park SH. Comparing the nutrient intake, quality of diet, eating habit scores and dietary behaviors of university students in Iksan, according to their type of residence. Korean J Community Nutr. 2003; 8(6):876–888.
30). Ko MS. The comparison in daily intake of nutrients and dietary habits of college students in Busan. Korean J Community Nutr. 2007; 12(3):259–271.
31). U.S. Food and Drug Administration. Food standards: amendment of standards of identity for enriched grain products to require addition of folic acid. Fed Regist. 1996; 61(44):8761–8797.
32). Honein MA, Paulozzi LJ, Mathews TJ, Erickson JD, Wong LY. Impact of folic acid fortification of the US food supply on the occurrence of neural tube defects. JAMA. 2001; 285(23):2981–2986.
33). Berry RJ, Li Z, Erickson JD, Li S, Moore CA, Wang H, Mulinare J, Zhao P, Wong LY, Gindler J, Hong SX, Correa A. Prevention of neural-tube defects with folic acid in China. China-U.S. collaborative project for neural tube defect prevention. N Engl J Med. 1999; 341(20):1485–1490.
34). de Walle HE, de Jong-van den Berg LT, Cornel MC. Periconcep-tional folic acid intake in the northern Netherlands. Lancet. 1999; 353(9159):1187.
35). The Korean Nutrition Society. Dietary reference intakes for Koreans. Seoul: The Korean Nutrition Society;2010.
36). Péneau S, Dauchet L, Vergnaud AC, Estaquio C, Kesse-Guyot E, Bertrais S, Latino-Martel P, Hercberg S, Galan P. Relationship between iron status and dietary fruit and vegetables based on their vitamin C and fiber content. Am J Clin Nutr. 2008; 87(5):1298–1305.
37). Kim SM, Kim JR. A study on the nutritional iron status of adults in Taegu city. J Korean Soc Food Sci Nutr. 1998; 27(1):191–199.
38). Kim KN, Kang HS, Song MN. Dietary behavior and calcium intake of college students. Korean J Hum Ecol. 2000; 9(3):395–403.
39). Lim HJ. A study on the physical activity, food habit and nutrient intakes of adults in Pusan. Korean J Community Nutr. 2010; 15(4):460–474.
40). Mangano KM, Walsh SJ, Insogna KL, Kenny AM, Kerstetter JE. Calcium intake in the United States from dietary and supplemental sources across adult age groups: new estimates from the National Health and Nutrition Examination Survey 2003-2006. J Am Diet Assoc. 2011; 111(5):687–695.
41). Moon JS, Won KC. The diagnosis and treatment of osteoporosis. Yeungnam Univ J Med. 2008; 25(1):19–30.
42). Li K, Kaaks R, Linseisen J, Rohrmann S. Associations of dietary calcium intake and calcium supplementation with myocardial infarction and stroke risk and overall cardiovascular mortality in the Heidelberg cohort of the European Prospective Investigation into Cancer and Nutrition study (EPIC-Heidelberg). Heart. 2012; 98(12):920–925.
43). Lee JH, Lee YS. Effect of excess calcium and iron supplement on bone loss, nephrocalcinosis and renal function in osteoporotic model rats. Korean J Nutr. 2000; 33(2):147–157.
Go to :
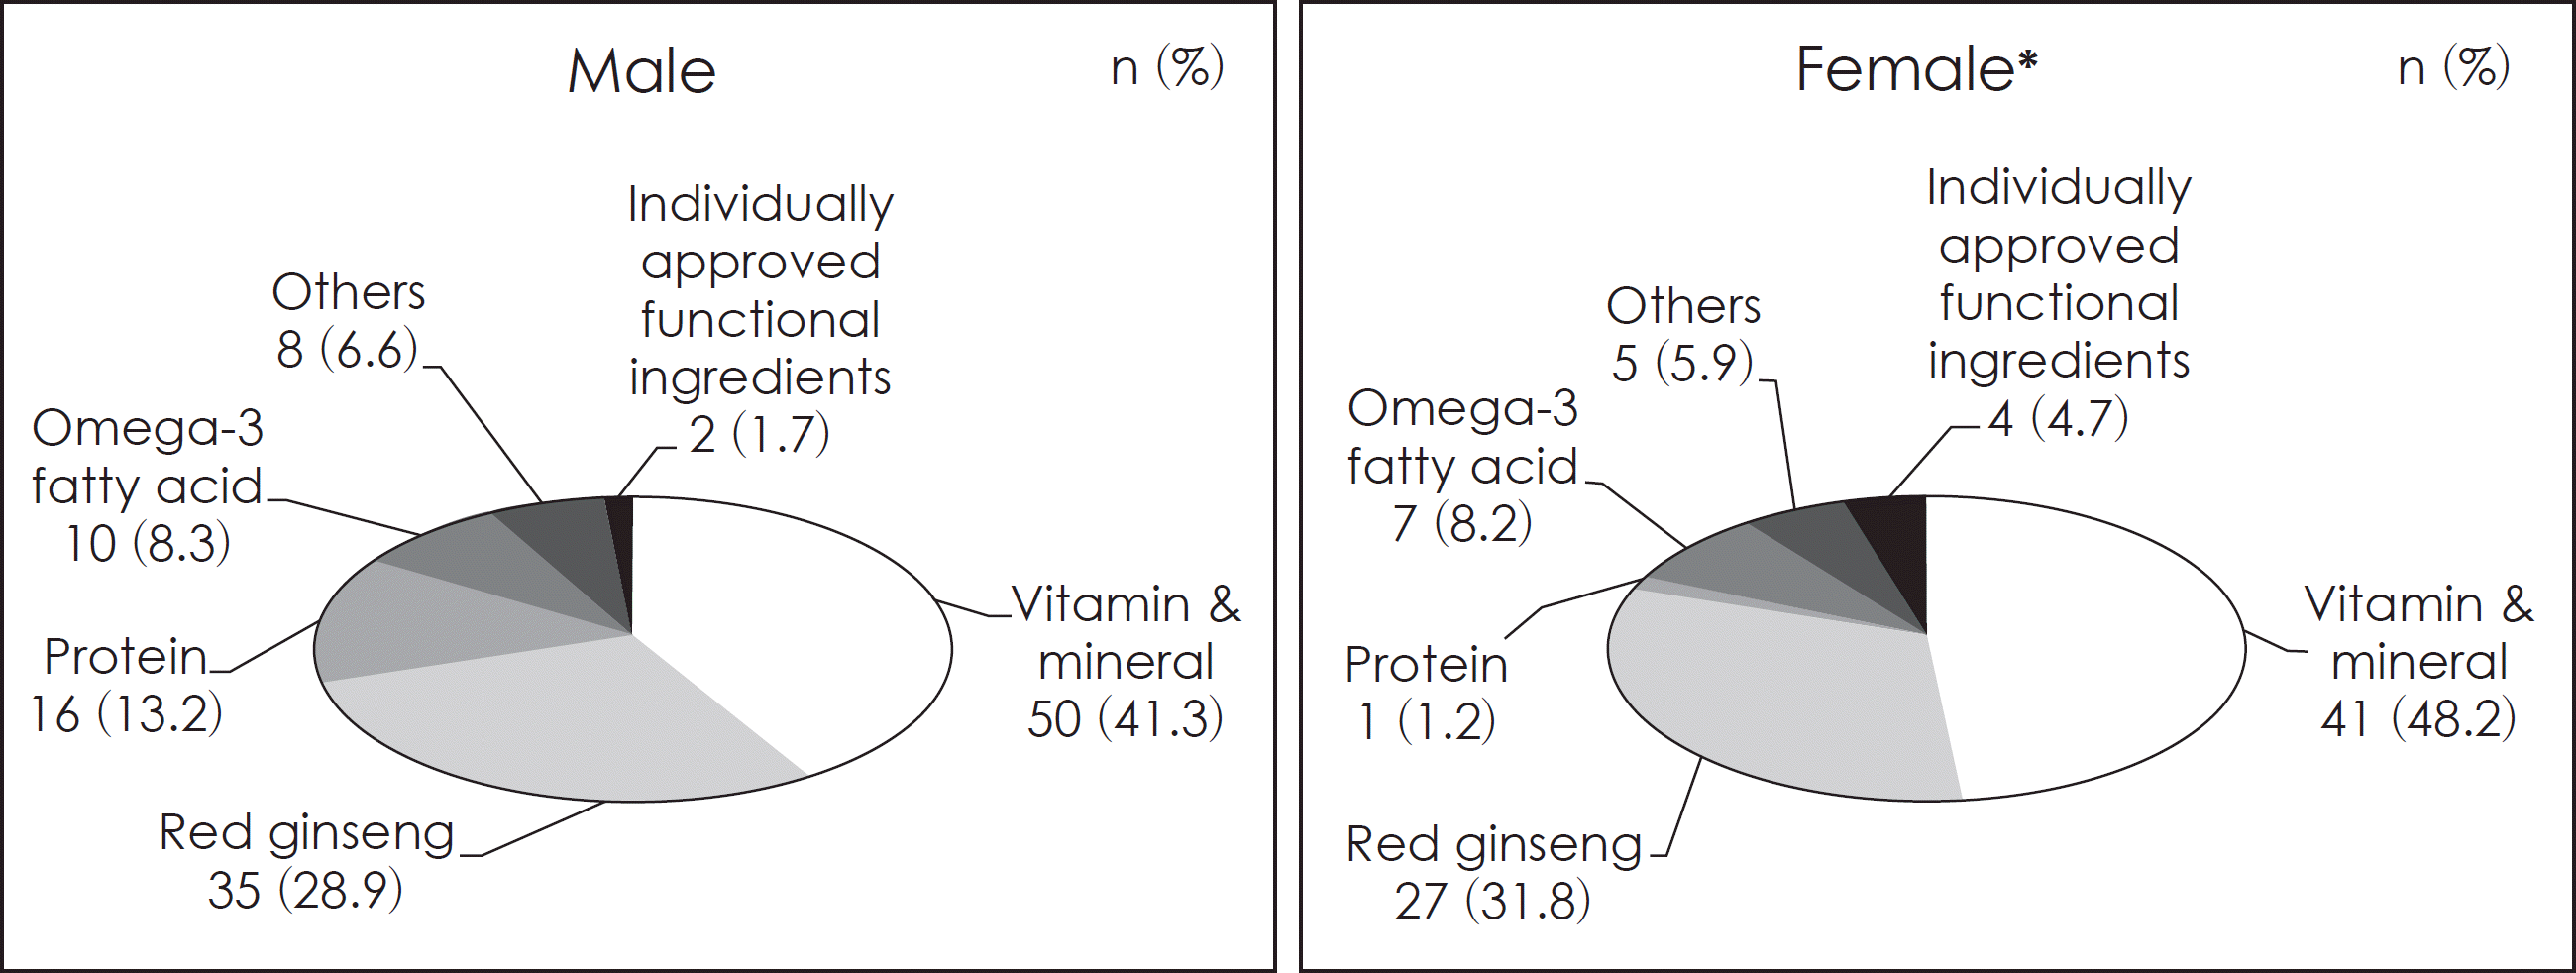 | Fig. 1.Kinds of health functional food consumed by the subjects. ∗: Superscripts are significantly different between gender by chi-square test (∗: p < 0.05). |
Table 1.
General characteristics and health-related lifestyle of the subjects
| Variables | Male (n = 179) | Female (n = 104) | t-value or χ 2-value |
|---|---|---|---|
| Age (years) | 22.9 ± 2.0 1) | 21.1 ± 1.9 | 07.432∗∗∗2) |
| Type of residence | |||
| Living with family | 101 (56.4)2) | 76 (73.1) | 07.798∗ |
| Preparation of own meals | 052 (29.1) | 19 (18.3) | |
| Dormitory or etc. | 026 (14.5) | 09 (08.7) | |
| Pocket money (1,000 won/month) | |||
| < 200 | 041 (22.9) | 22 (21.2) | 00.119 |
| 200-400 | 109 (60.9) | 65 (62.5) | |
| ≥400 | 029 (16.2) | 17 (16.3) | |
| Eating out (times/week) | |||
| ≤1 | 037 (20.7) | 21 (20.2) | 00.015 |
| 2-4 | 102 (57.0) | 60 (57.7) | |
| ≥5 | 040 (22.1) | 23 (22.1) | |
| Frequency of exercise (times/week) | |||
| None | 002 (23.5) | 04 (61.5) | 41.179∗∗∗ |
| 1-2 | 084 (46.9) | 25 (24.0) | |
| ≥3 | 053 (29.6) | 15 (14.4) | |
| Frequency of alcohol drinking (times/week) | |||
| None | 005 (19.6) | 41 (39.4) | 00.173∗∗ |
| ≤1 | 090 (50.3) | 43 (41.3) | |
| 2-4 | 051 (28.5) | 16 (17.0) | |
| ≥5 | 003 (01.7) | 03 (02.9) |
Table 2.
Anthropometric parameters of the subjects
| Variables | Male (n = 179) | Female (n = 104) | t-value or χ 2-value |
|---|---|---|---|
| Height (cm) | 174.7 ± 6.4 1) | 160.8 ± 4.6 | -19.53∗∗∗2) |
| Weight (kg) | 071.5 ± 10.4 | 053.9 ± 6.4 | -15.61∗∗∗ |
| Percent body fat (%) | 018.9 ± 11.0 | 027.9 ± 4.5 | 0-7.88∗∗∗ |
| BMI 2) (kg/m | 023.4 ± 03.5 | 020.9 ± 2.2 | -06.75∗∗∗ |
| Underweight | 06 (03.4) | 009 (08.7) | |
| Normal | 84 (46.9) | 078 (75.0) | -35.165∗∗∗ |
| Overweight | 41 (22.9) | 013 (12.5) | |
| Obesity | 48 (26.8) | 004 (03.8) |
Table 3.
Motivation for purchase, reason for consumption and effect after consumption of functional food purchase
| Variables | Male (n = 72) | Female (n = 52) |
|---|---|---|
| Motivation for health functional food purchase NS1) | ||
| Recommendation of family or relatives | 55 (76.4) 2) | 41 (78.8) |
| Advertise (TV, internet, newspaper, magazine and etc.) | 10 (13.9) | 05 (09.6) |
| Recommendation of expert such as doctors and pharmacist or salespeople | 02 (02.8) | 03 (05.8) |
| Others | 05 (06.9) | 03 (05.8) |
| Reason for consumption | ||
| Health promotion | 48 (66.7) | 33 (63.5) |
| Disease treatment or prevention | 08 (11.1) | 07 (13.5) |
| Weight or beauty management | 08 (11.1) | 07 (13.5) |
| Others | 08 (11.1) | 05 (09.5) |
| Effect after consumption | ||
| Very effective | 06 (08.3) | 02 (03.8) |
| Effective | 35 (48.6) | 26 (50.0) |
| Little effective | 08 (11.1) | 09 (17.3) |
| Not sure | 23 (31.9) | 15 (28.8) |
Table 4.
Reason for no consumption of health functional food
| Variables | Male (n = 107) | Female (n = 52) |
|---|---|---|
| Have no health problem NS1) | 53 (49.5) 2) | 24 (46.2) |
| Doubt on effectiveness | 23 (21.5) | 09 (17.3) |
| Enough healthy dietary habbits | 15 (14.0) | 12 (23.1) |
| Expensive price | 06 (05.6) | 03 (05.8) |
| Others | 10 (09.4) | 04 (07.7) |
Table 5.
Dietary habit scores of the subjects
| Variables | Male | Female | ||||
|---|---|---|---|---|---|---|
| Consumers (n = 72) | Non consumers (n = 107) | Total (n = 179) | Consumers (n = 52) | Non consumers (n = 52) | Total (n = 104) | |
| Eat breakfast regularly | 03.4 ± 1.3 1) | 3.4 ± 1.2 | 03.4 ± 1.3 | 03.6 ± 1.3 | 03.3 ± 1.2 | 03.4 ± 1.3 |
| Eat meals at regular times | 03.2 ± 1.1 | 3.2 ± 1.1 | 03.2 ± 1.1 | 02.8 ± 0.9 | 03.0 ± 1.1 | 03.0 ± 1.1 |
| Take enough time to have meals | 02.5 ± 1.1 | 2.6 ± 1.1 | 02.6 ± 1.1 | 02.8 ± 1.0 | 03.3 ± 1.1∗ | 03.0 ± 1.2 |
| Have meals with diverse foods | 03.4 ± 0.9 | 3.5 ± 0.9 | 03.4 ± 0.9 | 03.1 ± 1.0 | 03.2 ± 0.8 | 03.2 ± 0.9 |
| Eat adequate amount of meals | 02.8 ± 0.9 | 2.9 ± 1.1 | 02.9 ± 1.0 | 02.7 ± 1.0 | 02.8 ± 1.0 | 02.8 ± 1.0 |
| Not eat salty foods | 03.0 ± 1.1 | 2.9 ± 1.0 | 02.9 ± 1.0 | 02.7 ± 1.0 | 03.1 ± 1.1 | 02.9 ± 1.1 |
| Eat foods such as meat, fish, eggs, and beans more than two times a day | 03.4 ± 1.1 | 3.5 ± 0.9 | 03.4 ± 1.0 | 03.2 ± 1.0 | 03.0 ± 1.1 | 03.1 ± 1.0 |
| Avoide eating foods containing oil more than two times a day | 03.4 ± 1.0 | 3.5 ± 1.0 | 03.5 ± 1.0 | 03.4 ± 1.1 | 03.6 ± 0.9 | 03.5 ± 1.0 |
| Eat dairy product (milk, yogurt, etc) everyday | 03.3 ± 1.2 | 3.2 ± 1.3 | 03.2 ± 1.2 | 03.1 ± 1.1 | 02.5 ± 1.1∗∗ | 02.8 ± 1.1 |
| Eat greenish yellow vegetable everday | 03.0 ± 1.0 | 3.0 ± 1.1 | 03.0 ± 1.0 | 02.9 ± 1.0 | 02.9 ± 1.1 | 02.9 ± 1.0 |
| Eat fruits everyday | 02.8 ± 1.2 | 2.5 ± 1.1 | 02.6 ± 1.1 | 02.9 ± 1.1 | 02.6 ± 1.1 | 02.8 ± 1.1 |
| Eat natural foods mostly | 02.9 ± 0.8 | 2.9 ± 0.7 | 02.9 ± 0.8 | 02.6 ± 1.0 | 02.9 ± 0.9 | 02.8 ± 1.0 |
| Purchase processed foods after identifying nutrition labels | 02.2 ± 1.2 | 2.2 ± 1.1 | 02.2 ± 1.1 | 02.9 ± 1.2 | 02.6 ± 1.3 | 02.8 ± 1.3 |
| Apply nutrition knowledge to daily life | 03.1 ± 1.1 | 2.9 ± 0.9 | 02.9 ± 1.0 | 02.9 ± 1.0 | 02.8 ± 1.1 | 02.9 ± 1.0 |
| Total score | 42.5 ± 7.6 | 1.9 ± 6.0 | 42.2 ± 6.7 | 41.9 ± 7.3 | 41.7 ± 7.5 | 41.8 ± 7.4 |
Table 6.
Daily nutrient intakes of the subjects
| Variables | Male | Female | ||||
|---|---|---|---|---|---|---|
| Consumers (n = 72) | Non consumers (n = 107) | Total (n = 179) | Consumers (n = 52) | Non consumers (n = 52) | Total (n = 104) | |
| Energy (kcal) | 1917.2 ± 399.31) | 1907.1 ± 399.3 | 1911.1 ± 419.3 | 1568.8 ± 336.2 | 1586.4 ± 342.1 | 1577.6 ± 337.6 |
| %EER | 73.7 ± 15.4 | 73.4 ± 16.7 | 73.5 ± 16.1 | 74.7 ± 16.0 | 75.5 ± 16.3 | 75.1 ± 16.1 |
| Protein (g) | 82.6 ± 33.3 | 79.5 ± 25.2 | 80.7 ± 28.7 | 62.1 ± 6.6 | 65.4 ± 24.6 | 63.7 ± 21.0 |
| %RI | 150.1 ± 60.6 | 144.5 ± 45.7 | 146.8 ± 52.1 | 124.1 ± 33.2 | 130.7 ± 49.3 | 127.4 ± 41.9 |
| Vit A (µgR.E) | 673.6 ± 241.4 | 683.1 ± 323.5 | 679.3 ± 292.5 | 637.3 ± 225.3 | 633.1 ± 251.8 | 635.2 ± 237.8 |
| %RI | 89.8 ± 32.2 | 91.1 ± 43.1 | 90.6 ± 39.0 | 98.0 ± 34.7 | 97.4 ± 38.7 | 97.7 ± 36.6 |
| Vit B1 (mg) | 1.5 ± 0.5 | 1.4 ± 0.5 | 1.4 ± 0.5 | 1.1 ± 0.3 | 1.1 ± 0.4 | 1.1 ± 0.4 |
| %RI | 122.8 ± 38.1 | 114.2 ± 37.8 | 117.6 ± 38.1 | 96.1 ± 31.1 | 98.3 ± 35.9 | 97.2 ± 33.4 |
| Vit B2 (mg) | 1.2 ± 0.4 | 1.2 ± 0.4 | 1.2 ± 0.4 | 1.1 ± 0.4 | 1.0 ± 0.3∗ | 1.0 ± 0.3 |
| %RI | 82.1 ± 24.4 | 79.9 ± 24.1 | 80.8 ± 24.2 | 91.0 ± 31.6 | 80.0 ± 24.4 | 85.5 ± 28.6 |
| Niacin (mg) | 18.0 ± 5.8 | 17.5 ± 4.8 | 17.7 ± 5.2 | 14.3 ± 4.6 | 14.7 ± 4.9 | 14.5 ± 4.7 |
| %RI | 112.3 ± 36.5 | 109.6 ± 30.0 | 110.7 ± 32.7 | 102.0 ± 32.6 | 104.6 ± 34.8 | 103.3 ± 33.6 |
| Folic acid | 206.1 ± 67.5 | 197.0 ± 69.7 | 200.7 ± 68.8 | 188.4 ± 64.8 | 172.5 ± 56.2 | 180.4 ± 61.0 |
| (µgDFE) | ||||||
| %RI | 51.5 ± 16.9 | 49.2 ± 17.4 | 50.2 ± 17.2 | 47.1 ± 16.2 | 43.1 ± 14.1 | 45.1 ± 15.3 |
| Vit C (mg) | 75.2 ± 39.9 | 74.3 ± 57.3 | 74.7 ± 50.9 | 67.0 ± 32.3 | 63.3 ± 34.8 | 65.2 ± 33.4 |
| %RI | 75.2 ± 39.9 | 74.3 ± 57.3 | 74.7 ± 50.9 | 67.0 ± 32.3 | 63.3 ± 34.8 | 65.2 ± 33.4 |
| Ca (mg) | 464.2 ± 166.4 | 480.0 ± 212.9 | 473.7 ± 195.2 | 447.8 ± 151.9 | 385.3 ± 120.5∗ | 416.5 ± 140.0 |
| %RI | 61.9 ± 22.2 | 64.0 ± 28.4 | 63.2 ± 26.0 | 68.9 ± 23.4 | 59.3 ± 18.5 | 64.1 ± 21.5 |
| P (mg) | 1002.7 ± 260.7 | 1014.3 ± 277.3 | 1009.6 ± 270.0 | 847.0 ± 213.6 | 818.6 ± 214.3 | 832.8 ± 213.4 |
| %RI | 143.2 ± 37.2 | 144.9 ± 39.6 | 144.2 ± 38.6 | 121.0 ± 30.5 | 116.9 ± 30.6 | 119.0 ± 30.5 |
| Fe (mg) | 12.9 ± 5.0 | 12.8 ± 3.9 | 12.8 ± 4.3 | 10.9 ± 2.8 | 10.7 ± 3.5 | 10.8 ± 3.2 |
| %RI | 128.7 ± 49.5 | 127.6 ± 38.6 | 128.1 ± 43.2 | 78.2 ± 20.3 | 76.6 ± 25.0 | 77.4 ± 22.7 |
Table 7.
Nutrient adequacy ratio (NAR) and Mean nutrient adequacy ratio (MAR) of the subjects
| Variables | Male | Female | ||||
|---|---|---|---|---|---|---|
| Consumers (n = 72) | Non consumers (n = 107) | Total (n = 179) | Consumers (n = 52) | Non consumers (n = 52) | Total (n = 104) | |
| NAR | ||||||
| Protein | 0.99 ± 0.051) | 0.98 ± 0.06 | 0.98 ± 0.06 | 0.97 ± 0.07 | 0.97 ± 0.06 | 0.97 ± 0.07 |
| Vit A | 0.81 ± 0.20 | 0.80 ± 0.20 | 0.81 ± 0.20 | 0.86 ± 0.18 | 0.84 ± 0.19 | 0.85 ± 0.19 |
| Vit B1 | 0.94 ± 0.11 | 0.92 ± 0.14 | 0.93 ± 0.13 | 0.85 ± 0.16 | 0.85 ± 0.18 | 0.85 ± 0.17 |
| Vit B2 | 0.78 ± 0.18 | 0.77 ± 0.19 | 0.78 ± 0.19 | 0.83 ± 0.18 | 0.77 ± 0.17 | 0.80 ± 0.18 |
| Niacin | 0.92 ± 0.12 | 0.93 ± 0.12 | 0.92 ± 0.12 | 0.88 ± 0.15 | 0.89 ± 0.14 | 0.88 ± 0.15 |
| Folic acid | 0.51 ± 0.17 | 0.49 ± 0.17 | 0.50 ± 0.17 | 0.47 ± 0.16 | 0.43 ± 0.14 | 0.45 ± 0.15 |
| Vit C | 0.68 ± 0.25 | 0.63 ± 0.26 | 0.65 ± 0.26 | 0.63 ± 0.24 | 0.58 ± 0.25 | 0.61 ± 0.25 |
| Ca | 0.62 ± 0.22 | 0.62 ± 0.23 | 0.62 ± 0.23 | 0.67 ± 0.20 | 0.59 ± 0.17∗ | 0.63 ± 0.19 |
| P | 0.99 ± 0.05 | 0.98 ± 0.07 | 0.98 ± 0.06 | 0.96 ± 0.09 | 0.96 ± 0.06 | 0.96 ± 0.08 |
| Fe | 0.95 ± 0.10 | 0.95 ± 0.11 | 0.95 ± 0.11 | 0.76 ± 0.17 | 0.73 ± 0.18 | 0.75 ± 0.18 |
| MAR | 0.81 ± 0.10 | 0.81 ± 0.12 | 0.81 ± 0.11 | 0.79 ± 0.12 | 0.76 ± 0.10 | 0.78 ± 0.11 |
Table 8.
Nutrient density (ND) of the subjects
| Variables | Male | Female | ||||
|---|---|---|---|---|---|---|
| Consumers (n = 72) | Non consumers (n = 107) | Total (n = 179) | Consumers (n = 52) | Non consumers (n = 52) | Total (n = 104) | |
| Protein (g/1,000 kcal) | 42.5 ± 11.8 1) | 41.4 ± 7.1 | 41.9 ± 9.3 | 39.5 ± 5.8 | 41.3 ± 14.7 | 40.4 ± 11.1 |
| Vit A (µgR.E/1,000 kcal) | 355.0 ± 118.9 | 359.6 ± 148.7 | 357.7 ± 137.2 | 410.9 ± 143.1 | 398.1 ± 123.2 | 404.5 ± 133.0 |
| Vit B1 (mg/1,000 kcal) | 0.8 ± 0.2 | 0.7 ± 0.2∗ | 0.7 ± 0.2 | 0.7 ± 0.2 | 0.7 ± 0.2 | 0.7 ± 0.2 |
| Vit B2 (mg/1,000 kcal) | 0.6 ± 0.1 | 0.6 ± 0.1 | 0.6 ± 0.1 | 0.7 ± 0.2 | 0.6 ± 0.1∗∗ | 0.7 ± 0.2 |
| Niacin (mg/1,000 kcal) | 9.3 ± 2.0 | 9.3 ± 1.8 | 9.3 ± 1.9 | 9.1 ± 2.1 | 9.2 ± 1.9 | 9.1 ± 2.0 |
| Vit B6 (mg/1,000 kcal) | 1.0 ± 0.2 | 1.0 ± 0.2 | 1.0 ± 0.2 | 1.0 ± 0.2 | 1.0 ± 0.2 | 1.0 ± 0.2 |
| Folic acid (mg/1,000 kcal) | 108.9 ± 36.4 | 103.6 ± 31.1 | 105.8 ± 33.3 | 120.3 ± 33.5 | 108.7 ± 26.4 | 114.5 ± 30.6 |
| Vit C (mg/1,000 kcal) | 40.4 ± 24.6 | 39.4 ± 30.0 | 39.8 ± 27.9 | 43.0 ± 18.6 | 40.2 ± 21.7 | 41.6 ± 20.2 |
| Ca (mg/1,000 kcal) | 243.5 ± 84.5 | 251.4 ± 99.0 | 248.2 ± 93.3 | 285.5 ± 74.0 | 244.7 ± 64.1∗∗ | 265.1 ± 71.9 |
| P (mg/1,000 kcal) | 522.2 ± 80.3 | 532.3 ± 89.5 | 528.3 ± 85.8 | 540.7 ± 83.2 | 515.9 ± 67.4 | 528.3 ± 76.4 |
| Fe (mg/1,000 kcal) | 6.7 ± 2.0 | 6.7 ± 1.7 | 6.7 ± 1.8 | 7.0 ± 1.2 | 6.8 ± 1.6 | 6.9 ± 1.5 |
| Zn (mg/1,000 kcal) | 4.7 ± 0.7 | 4.6 ± 0.8 | 4.7 ± 0.7 | 4.5 ± 0.8 | 4.9 ± 2.6 | 4.7 ± 1.9 |
 XML Download