

 PDF
PDF ePub
ePub Citation
 Print
Print


Abstract
This study examined how achievement of session goals contributes to outcomes of subjects after participation in a 12-week lifestyle intervention program in men with metabolic syndrome (MetS). Thirty office workers with MetS, aged 47.2 ± 6.6 years, participated in this study, from March to July, 2011. The intervention program included face-to-face counseling five times during the 12-week period. Counselors and subjects designed session goals for each round. The average of the goal achievement rate was calculated based on compliance for each round. The subjects were divided into three groups according to their tertiles of achievement rate: Low-compliance group (LC, < 59%), medium-compliance group (MC, 59-70%), and high-compliance group (HC, > 70%). Anthropometry, biochemical index, and nutrient intake were examined at baseline and at the end of the 12-week intervention program. After the intervention, diastolic blood pressure (DBP) showed a significant decrease in the LC group, and waist circumference (WC) showed a significant decrease in the MC group. Systolic blood pressure (SBP), DBP, and low-density lipoprotein cholesterol (LDL) showed a significant decrease in the HI group. Changes in SBP and DBP were significantly lower in the HC group than in the MC group (p < 0.05, p < 0.01). Changes in LDL were significantly lower in the HC group than in the MC group (p < 0.05). Results for intake of total energy, protein, fat, and sodium, as well as rates of carbohydrate and fat intake, showed a significant decrease in all participants (p < 0.05). The change in fiber was significantly higher in the HC group than in the MC group (p < 0.05). The change of fruit serving size showed a significant increase in the HC group (p < 0.01). The number of risk factors for MetS showed a significant decrease in the LC and HC groups (p < 0.05), however, no significant mean differences were observed among the three groups. In conclusion, participation in this intervention program resulted in positive effects on risk factors for MetS, nutrient intake, and dietary habits, especially in the High-compliance group.
Go to : 
REFERENCES
1). Reaven G. The metabolic syndrome or the insulin resistance syndrome? Different names, different concepts, and different goals. Endocrinol Metab Clin North Am. 2004; 33(2):283–303.

2). Grundy SM, Cleeman JI, Daniels SR, Donato KA, Eckel RH, Franklin BA, Gordon DJ, Krauss RM, Savage PJ, Smith SC Jr, Spertus JA, Costa F. American Heart Association. American Heart Association; National Heart, Lung, and Blood Institute. Diagnosis and management of the metabolic syndrome: an American Heart Association/National Heart, Lung, and Blood Institute Scientific Statement. Circulation. 2005; 112(17):2735–2752.
3). Reaven GM. Banting lecture 1988. Role of insulin resistance in human disease. Diabetes. 1988; 37(12):1595–1607.
4). Shin JH, Kang SG, Kim MJ, Hwang YN, Song SW. The effect of regular aerobic exercise on health-related quality of life among metabolic syndrome patients. Korean J Obes. 2008; 17(4):182–187.
5). Lim S, Shin H, Song JH, Kwak SH, Kang SM, Yoon JW, Choi SH, Cho SI, Park KS, Lee HK, Jang HC, Koh KK. Increasing prevalence of metabolic syndrome in Korea: the Korean National Health and Nutrition Examination Survey for 1998-2007. Diabetes Care. 2011; 34(6):1323–1328.
6). Moon HK, Kong JE. Assessment of nutrient intake for middle aged with and without metabolic syndrome using 2005 and 2007 Korean National Health and Nutrition Survey. Korean J Nutr. 2010; 43(1):69–78.
7). Wannamethee SG, Shaper AG, Alberti KG. Physical activity, metabolic factors, and the incidence of coronary heart disease and type 2 diabetes. Arch Intern Med. 2000; 160(14):2108–2116.
8). Lee WY, Jung CH, Park JS, Rhee EJ, Kim SW. Effects of smoking, alcohol, exercise, education, and family history on the metabolic syndrome as defined by the ATP III. Diabetes Res Clin Pract. 2005; 67(1):70–77.
9). Freiberg MS, Cabral HJ, Heeren TC, Vasan RS, Curtis Ellison R. Third National Health and Nutrition Examination Survey Alcohol consumption and the prevalence of the Metabolic Syndrome in the US.: a cross-sectional analysis of data from the Third National Health and Nutrition Examination Survey. Diabetes Care. 2004; 27(12):2954–2959.
10). Oh SW, Yoon YS, Lee ES, Kim WK, Park C, Lee S, Jeong EK, Yoo T. Korea National Health and Nutrition Examination Survey. Association between cigarette smoking and metabolic syndrome: the Korea National Health and Nutrition Examination Survey. Diabetes Care. 2005; 28(8):2064–2066.
11). Havas S, Anliker J, Greenberg D, Block G, Block T, Blik C, Lan-genberg P, DiClemente C. Final results of the Maryland WIC food for life program. Prev Med. 2003; 37(5):406–416.
12). La Londe MA, Graffagnino CL, Falko JM, Snow RJ, Spencer K, Caulin-Glaser T. Effect of a weight management program on the determinants and prevalence of metabolic syndrome. Obesity (Silver Spring). 2008; 16(3):637–642.
13). Park SY, Yang YJ, Kim Y. Effects of nutrition education using a ubiquitous healthcare (u-Health) service on metabolic syndrome in male workers. Korean J Nutr. 2011; 44(3):231–242.
14). Kim MJ, Kwon S, Ly SY. Effects of low glycemic index nutrition education on the blood glucose control in patients with type 2 diabetes mellitus. Korean J Nutr. 2010; 43(1):46–56.
15). Lee HS, Lee JW, Kim JM, Chang N. The effect of nutrition education and exercise program on body composition and dietary intakes, blood lipid and physical fitness in obese women(2)-relationship between participation rates and effectiveness of obesity management program. Korean J Nutr. 2010; 43(3):260–272.
16). Kang JY, Cho SW, Lee JY, Sung SH, Park YK, Paek YM, Choi TI. The effects of a worksite on-line health education program on metabolic syndrome risk factors and nutrient intakes of male workers. Korean J Nutr. 2010; 43(1):57–68.
17). World Health Organization, International Association for the Study of Obesity, International Obesity Task Force. The Asia-Pacific perspective: redefining obesity and its treatment. Sydney: Health Communications;2000.
18). Son SM, Huh GY, Lee HS. Development and evaluation of validity of dish frequency questionnaire (DFQ) and short DFQ using Na index for estimation of habitual sodium intake. Korean J Community Nutr. 2005; 10(5):677–692.
19). Lee EH, Kim HK, Lee YH, Moon SY, Kwon EJ, Lee SH. Effectiveness of lifestyle intervention on the management of metabolic syndrome. J Korean Soc Health Educ Promot. 2007; 24(3):1–19.
20). Expert Panel on Detection, Evaluation, and Treatment of High Blood Cholesterol in Adults. Executive Summary of The Third Report of The National Cholesterol Education Program (NCEP) Expert Panel on Detection, Evaluation, and Treatment of High Blood Cholesterol In Adults (Adult Treatment Panel III). JAMA. 2001; 285(19):2486–2497.
21). The Korean Nutrition Society. Dietary reference intakes for Koreans, 1st revision. Seoul: The Korean Nutrition Society;2010.
22). Merriam PA, Persuitte G, Olendzki BC, Schneider K, Pagoto SL, Palken JL, Ockene IS, Ma Y. Dietary intervention targeting increased fiber consumption for metabolic syndrome. J Acad Nutr Diet. 2012; 112(5):621–623.
23). Esmaillzadeh A, Kimiagar M, Mehrabi Y, Azadbakht L, Hu FB, Willett WC. Fruit and vegetable intakes, C-reactive protein, and the metabolic syndrome. Am J Clin Nutr. 2006; 84(6):1489–1497.
24). Kim HS. A study on health behaviors and nutrient intakes in the Korean adult’s with metabolic syndrome [dissertation]. Seoul: Catholic University of Korea;2005.
25). Yoo S, Nicklas T, Baranowski T, Zakeri IF, Yang SJ, Srinivasan SR, Berenson GS. Comparison of dietary intakes associated with metabolic syndrome risk factors in young adults: the Bogalusa Heart Study. Am J Clin Nutr. 2004; 80(4):841–848.
26). Kim M, Kim J, Bae W, Kim S, Lee Y, Na W, Sohn C. Relationship between nutrients intakes, dietary quality, and serum concentrations of inflammatory markers in metabolic syndrome patients. Korean J Community Nutr. 2011; 16(1):51–61.
27). Sohn C, Kim J, Bae W. The framingham risk score, diet, and inflammatory markers in Korean men with metabolic syndrome. Nutr Res Pract. 2012; 6(3):246–253.
28). Anderson JW, Riddell-Mason S, Gustafson NJ, Smith SF, Mackey M. Cholesterol-lowering effects of psyllium-enriched cereal as an adjunct to a prudent diet in the treatment of mild to moderate hypercholesterolemia. Am J Clin Nutr. 1992; 56(1):93–98.
29). Brown L, Rosner B, Willett WW, Sacks FM. Cholesterol-lowering effects of dietary fiber: a meta-analysis. Am J Clin Nutr. 1999; 69(1):30–42.
30). Chobanian AV, Bakris GL, Black HR, Cushman WC, Green LA, Izzo JL Jr, Jones DW, Materson BJ, Oparil S, Wright JT Jr, Roccella EJ. Joint National Committee on Prevention, Detection, Evaluation, and Treatment of High Blood Pressure. National Heart, Lung, and Blood Institute; National High Blood Pressure Education Program Coordinating Committee. Seventh report of the Joint National Committee on Prevention, Detection, Evaluation, and Treatment of High Blood Pressure. Hypertension. 2003; 42(6):1206–1252.
31). Lewington S, Clarke R, Qizilbash N, Peto R, Collins R. Prospective Studies Collaboration. Age-specific relevance of usual blood pressure to vascular mortality: a meta-analysis of individual data for one million adults in 61 prospective studies. Lancet. 2002; 360(9349):1903–1913.
32). Whelton PK, He J, Appel LJ, Cutler JA, Havas S, Kotchen TA, Roccella EJ, Stout R, Vallbona C, Winston MC, Karimbakas J, National High Blood Pressure Education Program Coordinating C. Primary prevention of hypertension: clinical and public health advisory from The National High Blood Pressure Education Program. JAMA. 2002; 288(15):1882–1888.
33). American Dietetic Association Staff, Office of Disease Prevention and Health Promotion. Worksite nutrition. 2nd edition.Washington, D.C.: Academy of Nutrition and Dietetics;1993.
34). Titze S, Martin BW, Seiler R, Stronegger W, Marti B. Effects of a lifestyle physical activity intervention on stages of change and energy expenditure in sedentary employees. Psychol Sport Exerc. 2001; 2(2):103–116.
Go to :
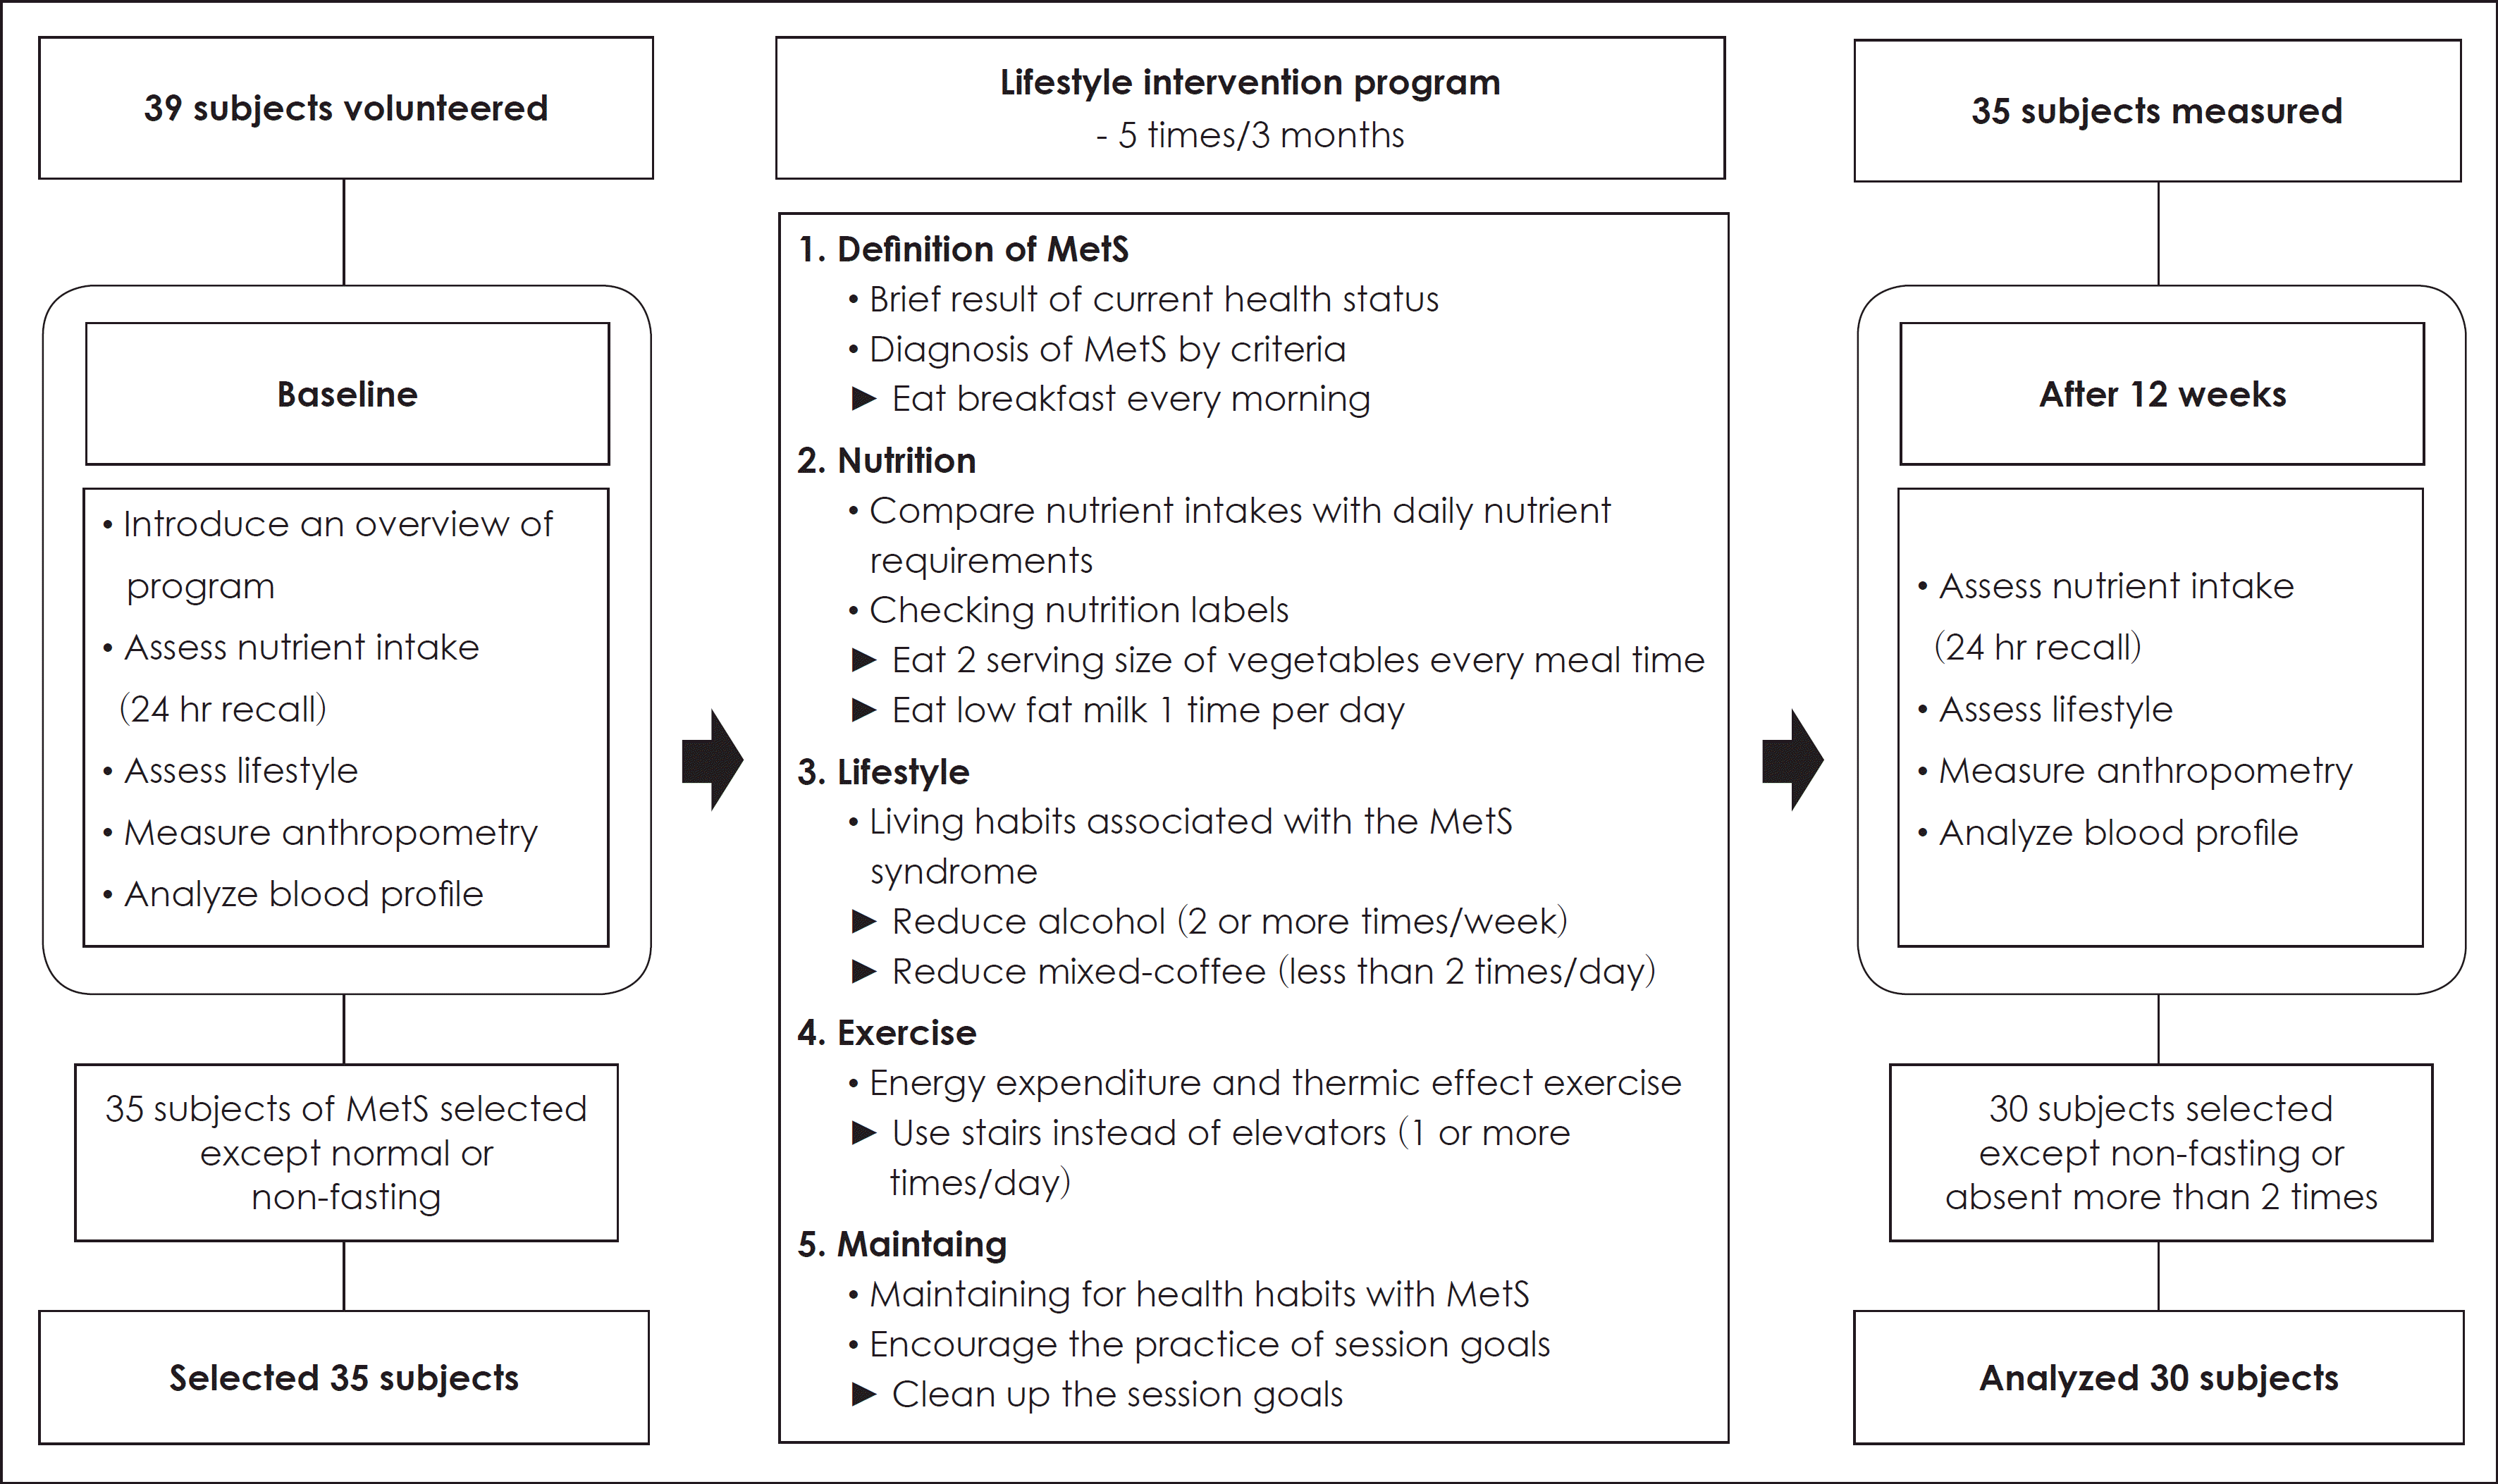
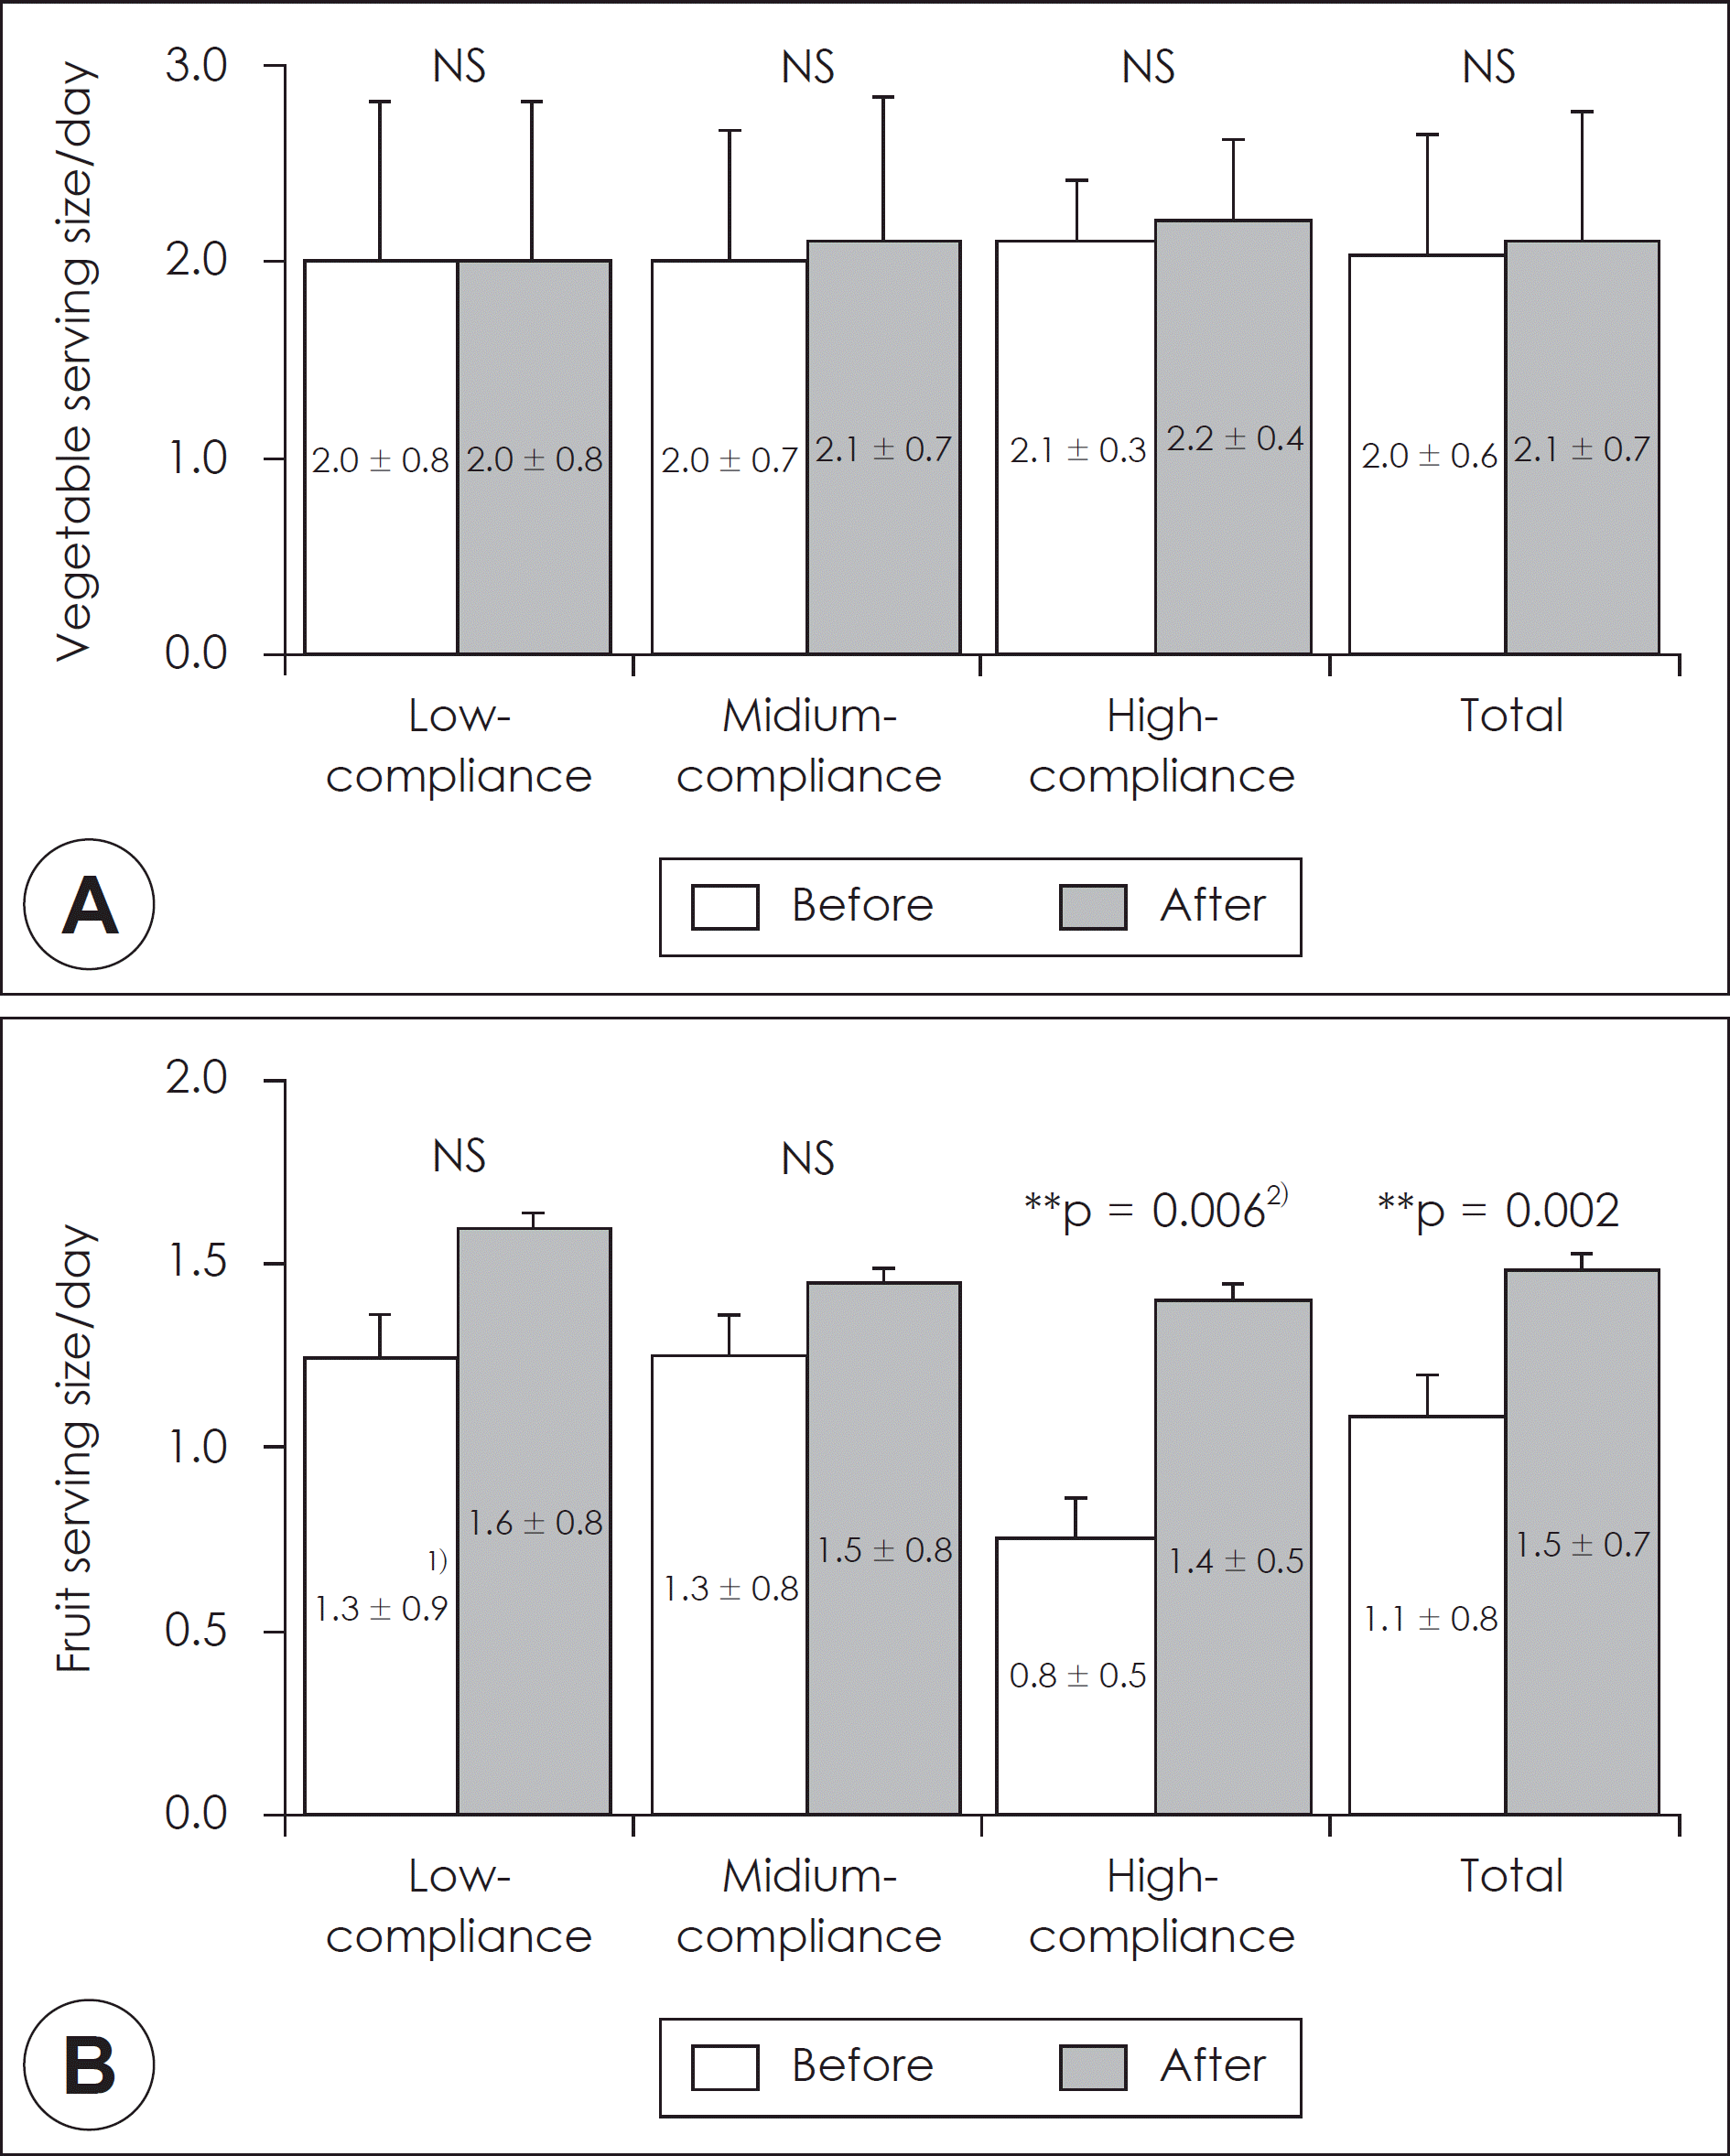 | Fig. 2.Comparisons of changed fruit and vegetable serving size among the compliance groups. 1) Mean ± S.D. 2) Analysis by NPAR Wilcoxon test at ∗: p <0.05, ∗∗: p <0.01. |
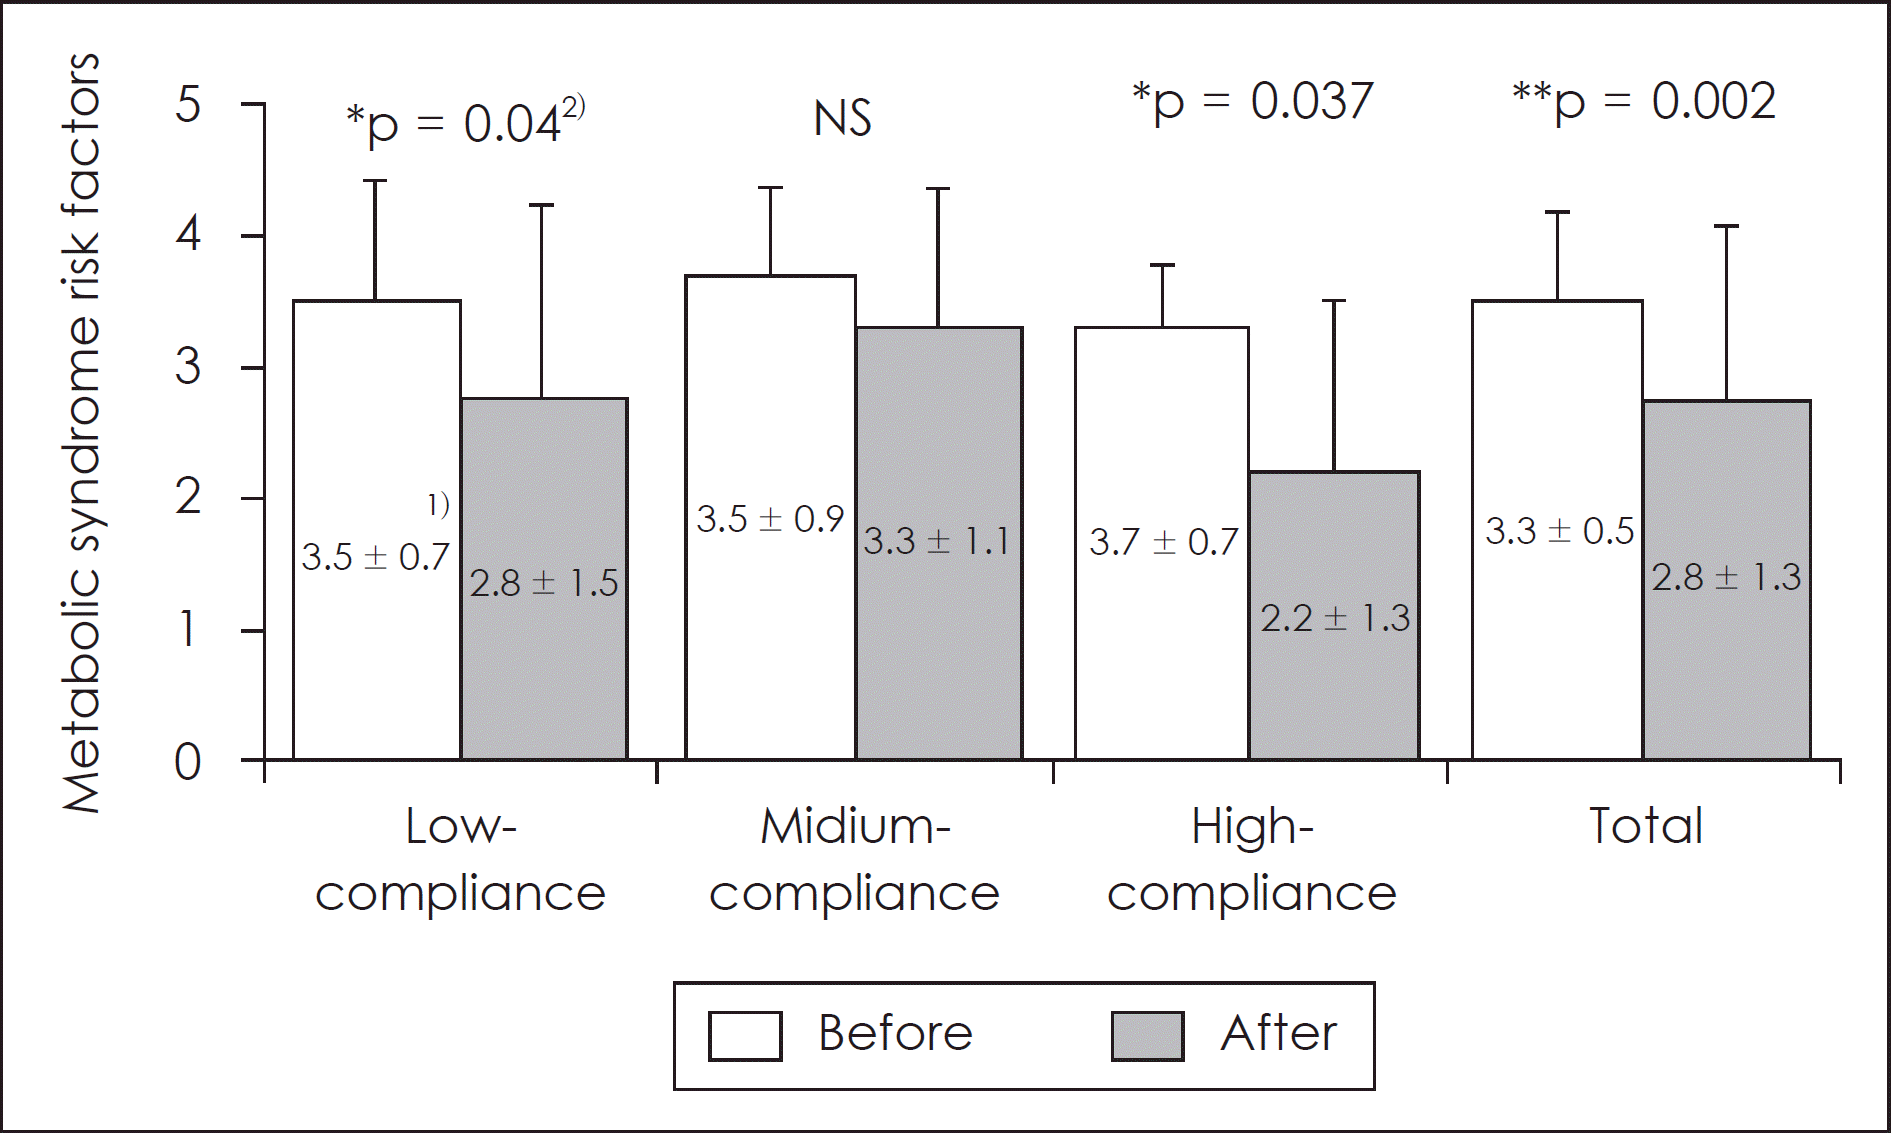 | Fig. 3.Comparisons of changed MetS risk factors among the compliance groups. 1) Mean ± S.D. 2) Analysis by NPAR Wilcoxon test at ∗: p < 0.05, ∗∗: p < 0.01. |
Table 1.
General characteristics of the subjects according to compliance of session goal
| Variables | Low-compliance (n = 10) | Medium-compliance (n = 10) | High-compliance (n = 10) | Total (n = 30) | ||||||||
|---|---|---|---|---|---|---|---|---|---|---|---|---|
| Before | After | p-value | Before | After | p-value | Before | After | p-value | Before | After | p-value | |
| Age | 46.0 ± 5.91) | 46.7 ± 7.2 | 48.8 ± 6.9 | 47.2 ± 6.6 | 0.630 | |||||||
| Education level | ||||||||||||
| ≤ High school | 01 (10.0)2) | 00 (0.0) | 03 (30.0) | 04 (13.3) | 0.182 | |||||||
| ≤ University | 05 (50.0) | 08 (80.0) | 06 (60.0) | 19 (63.3) | ||||||||
| ≤ Graduate school | 04 (40.0) | 02 (20.0) | 01 (10.0) | 07 (23.3) | ||||||||
| Marital status | ||||||||||||
| Single | 00 (0.0) | 00 (0.0) | 00 (0.0) | 00 (0.0) | ||||||||
| Married | 10 (100.0) | 10 (100.0) | 10 (100.0) | 30 (100.0) | ||||||||
| Smoking | ||||||||||||
| ea/day | 11.0 ± 8.50 | 13.3 ± 5.80 | 0.3173) | 20.6 ± 4.70 | 17.7 ± 4.10 | 0.102 | 14.4 ± 10.8 | 12.8 ± 12.3 | 0.180 | 16.9 ± 8.80 | 15.2 ± 7.50 | 0.2024) |
| Never smoked | 3 (30.0) | 3 (30.0) | 2 (20.0) | 2 (20.0) | 2 (20.0) | 02 (20.0) | 07 (23.3) | 07 (23.3) | ||||
| Former smokers | 4 (40.0) | 4 (40.0) | 1.0005) | 1 (10.0) | 1 (10.0) | 1.000 | 4 (40.0) | 05 (50.0) | 0.881 | 09 (30.0) | 10 (33.3) | 0.910 |
| Current smokers | 3 (30.0) | 3 (30.0) | 7 (70.0) | 7 (70.0) | 4 (40.0) | 03 (30.0) | 14 (46.7) | 13 (43.3) | ||||
| Alcohol drinking | ||||||||||||
| g/day | 28.5 ± 19.1 | 25.9 ± 18.2 | 0.749 | 56.3 ± 39.1 | 50.5 ± 29.7 | 0.695 | 35.3 ± 27.9 | 40.0 ± 44.3 | 0.670 | 40.0 ± 31.2 | 38.8 ± 33.0 | 0.351 |
| ≤ 2/week | 6 (60.0) | 7 (70.0) | 1.000 | 5 (50.0) | 8 (80.0) | 0.350 | 8 (80.0) | 10 (100.0) | 0.474 | 19 (63.3) | 25 (83.3) | 0.080 |
| ≥ 3/week | 4 (40.0) | 3 (30.0) | 5 (50.0) | 2 (20.0) | 2 (20.0) | 00 (0.0) | 11 (36.7) | 05 (16.7) | ||||
| Exercise | ||||||||||||
| ≤ 2/week | 8 (80.2) | 5 (50.0) | 0.350 | 8 (80.2) | 5 (50.0) | 0.350 | 2 (20.0) | 05 (50.0) | 0.350 | 18 (60.0) | 15 (50.0) | 0.302 |
| ≥ 3/week | 2 (20.0) | 5 (50.0) | 2 (20.0) | 5 (50.0) | 8 (80.0) | 05 (50.0) | 12 (40.0) | 15 (50.0) | ||||
| Checking nutrition labels | ||||||||||||
| No | 8 (80.0) | 3 (30.0) | 0.070 | 7 (70.0) | 4 (40.0) | 0.370 | 8 (80.0) | 03 (30.0) | 0.070 | 23 (76.7) | 10 (33.3) | 0.001 |
| Yes | 2 (20.0) | 7 (70.0) | 3 (30.0) | 6 (60.0) | 2 (20.0) | 07 (70.0) | 07 (23.3) | 20 (66.7 | ||||
Table 2.
Comparisons of changed scores in measured body composition and biochemical index among the compliance groups
| Low-compliance (n = 10) | Medium-compliance (n = 10) | High-compliance (n = 10) | p-value4) | Total (n = 30) | p-value5) | ||||||||
|---|---|---|---|---|---|---|---|---|---|---|---|---|---|
| Before | After | Δscore2) | Before | After | Δscore | Before | After | Δscore | Before | After | |||
| WT, kg | 79.9 ± 12.41) | 80.7 ± 13.1 | -0.8a6) | 82.0 ± 9.8 | 81.0 ± 9.7 | -1.0b | 80.6 ± 11.0 | 79.1 ± 8.3 | 0-1.5a | 0.041 | 80.8 ± 10.8 | 80.3 ± 10.2 | 0.308 |
| BMI, kg/m2 | 26.5 ± 3.9 | 26.8 ± 4.2 | -0.3a | 26.8 ± 2.5 | 26.5 ± 2.4 | -0.3b | 27.0 ± 4.2 | 26.5 ± 3.9 | 0-0.5ab | 0.035 | 26.8 ± 3.5 | 26.6 ± 3.5 | 0.290 |
| PBF, % | 21.4 ± 10.0 | 22.8 ± 4.5 | -1.5 | 25.0 ± 2.4 | 24.7 ± 1.6 | -0.3 | 23.1 ± 5.7 | 22.4 ± 4.6 | 0-0.7 | 0.827 | 23.2 ± 6.7 | 23.3 ± 3.8 | 0.866 |
| LBM, kg | 57.8 ± 5.4 | 57.3 ± 6.9 | -0.5 | 56.7 ± 6.7 | 56.7 ± 6.5 | -0.0 | 57.2 ± 7.3 | 57.0 ± 7.0 | 0-0.2 | 0.911 | 57.2 ± 6.3 | 57.0 ± 6.5 | 0.707 |
| WC, cm | 91.0 ± 9.3 | 90.7 ± 9.2 | -0.3 | 94.1 ± 8.1 | 92.3 ± 6.8∗ | -1.8 | 92.2 ± 8.6 | 90.3 ± 6.9 | 0-1.9 | 0.306 | 92.4 ± 8.5 | 91.1 ± 7.5∗3) | 0.056 |
| SBP, mmHg | 132.2 ± 13.8 | 128.6 ± 12.3 | -3.6ab | 131.9 ± 8.1 | 137.1 ± 12.5 | -5.2a | 131.6 ± 8.6 | 119.9 ± 9.6∗ | -11.7b | 0.020 | 131.9 ± 10.1 | 128.5 ± 13.2 | 0.164 |
| DBP, mmHg | 84.1 ± 7.4 | 76.9 ± 11.1∗ | -7.3a | 78.4 ± 5.7 | 80.9 ± 10.5 | -2.5b | 80.7 ± 10.6 | 71.7 ± 9.7∗ | 0-9.0ac | 0.004 | 81.1 ± 8.2 | 76.5 ± 10.8∗ | 0.007 |
| FBS, mg/dL | 105.3 ± 16.3 | 104.0 ± 24.1 | -1.3 | 115.8 ± 24.5 | 121.5 ± 43.9 | -5.7 | 115.0 ± 34.6 | 97.6 ± 22.6 | -17.4 | 0.179 | 112.0 ± 25.8 | 107.7 ± 32.3 | 0.348 |
| TG, mg/dL | 209.5 ± 90.4 | 213.8 ± 107.3 | -4.3 | 267.5 ± 152.2 | 222.4 ± 101.3 | -45.1 | 146.2 ± 77.0 | 154.3 ± 81.4 | -30.2 | 0.073 | 207.7 ± 118.8 | 204.2 ± 100.2 | 0.824 |
| TC, mg/dL | 196.1 ± 30.7 | 201.7 ± 25.5 | -5.6 | 191.8 ± 36.2 | 200.4 ± 34.6 | -8.6 | 207.2 ± 31.9 | 185.4 ± 42.1 | -21.8 | 0.087 | 198.4 ± 32.5 | 195.8 ± 34.3 | 0.624 |
| HDL, mg/dL | 35.6 ± 7.8 | 39.4 ± 8.7 | -3.8 | 34.9 ± 7.2 | 37.4 ± 6.7 | -2.5 | 44.1 ± 11.1 | 40.0 ± 6.8 | 0-4.1 | 0.067 | 38.2 ± 9.5 | 38.9 ± 7.3 | 0.588 |
| LDL, mg/dL | 130.8 ± 27.8 | 133.9 ± 27.7 | -3.1ab | 117.2 ± 31.9 | 122.6 ± 42.5 | -5.4a | 145.0 ± 28.2 | 122.5 ± 37.6∗ | -22.5b | 0.041 | 131.0 ± 30.6 | 126.3 ± 35.6 | 0.288 |
6) The different letters are significant difference among groups based on Mann-Whitney test. WT: weight, BMI: body mass index, PBF: percent body fat, LBM: lean body mass, WC: waist circumference, SBP: systolic blood pressure, DBP: diastolic blood pressure, FBS: fasting blood sugar, TG: triglyceride, TC: total cholesterol, HDL: high-density lipoprotein, LDL: low-density lipoprotein
Table 3.
Comparisons of changed dietary intakes of nutrients among the compliance groups
| Low-compliance (n = 10) | Medium-compliance (n = 10) | High-compliance (n = 10) | p-value4) | Total (n = 30) | p-value5) | ||||||||
|---|---|---|---|---|---|---|---|---|---|---|---|---|---|
| Before | After | Δscore2) | BEFORE | AFTER | Δscore | Before | After | Δscore | Before | After | |||
| Energy, kcal | 2,305.7±674.11) | 1,968.7±211.4 | -337.0 | 2,280.6±545.8 | 1,708.7±403.2∗3) | -572.0 | 2,062.6±558.4 | 1,660.6±262.3∗ | -402.0 | 0.422 | 2,216.3±585.3 | 1,779.3±323.5 | 0.001 |
| % carbohy- drate | 53.6±6.9 | 59.9±9.6 | -2.4 | 57.9±6.9 | 55.6±11.1 | -8.6 | 59.3±7.6 | 61.3±7.6 | -6.4 | 0.772 | 64.7±7.5 | 58.9±9.5 | 0.372 |
| % protein | 18.5±3.6 | 15.7±1.7∗ | -5.9 | 15.6±6.1 | 19.2±4.8 | -0.5 | 16.6±2.5 | 17.4±2.3 | -1.6 | 0.057 | 20.1±4.1 | 17.5±3.5 | 0.595 |
| % fat | 27.9±7.1 | 24.4±8.8 | -7.9 | 26.6±5.1 | 25.2±9.5 | -4.4 | 24.1±7.6 | 21.2±6.1 | -6.3 | 0.910 | 29.8±7.6 | 23.6±8.1 | 0.184 |
| Carbohy- drate, g | 292.0±108.0 | 291.7±67.3 | -0.3 | 274.9±61.6 | 227.1±68.3 | -47.7 | 285.3±52.8 | 251.7±44.7 | -33.5 | 0.268 | 284.0±75.6 | 256.9±64.9 | 0.118 |
| Protein, g | 99.6±31.2 | 76.1±11.3∗ | -23.4 | 84.9±23.6 | 76.8±21.8 | -8.0 | 81.9±24.6 | 71.8±16.2 | -10.0 | 0.687 | 88.8±26.9 | 74.9±16.5 | 0.036 |
| Fat, g | 68.7±29.5 | 52.5±19.0 | -16.2 | 58.1±24.8 | 47.6±24.4 | -10.5 | 56.5±34.2 | 39.5±14.9 | -17.0 | 0.836 | 61.1±29.2 | 46.6±19.9 | 0.029 |
| Fiber, g | 25.6±9.6 | 23.5±5.6 | -2.1ab6) | 25.4±6.9 | 18.6±6.1 | -6.8a | 21.3±6.0 | 27.7±12.8 | -6.4b | 0.025 | 24.1±7.6 | 23.3±9.3 | 0.709 |
| Ca, mg | 653.0±250.9 | 602.3±107.2 | -50.7 | 627.3±237.8 | 543.8±111.6 | -83.5 | 548.9±162.8 | 465.2±239.4 | -83.7 | 0.965 | 609.8±217.6 | 537.1±168.8 | 0.129 |
| P, mg | 1,268.7±373.3 | 1,118.8±108.2 | -149.9 | 1,240.8±334.6 | 1,049.3±222.0 | -191.5 | 1,114.9±293.9 | 970.4±219.5 | -144.5 | 0.946 | 1,208.1±330.8 | 1,046.2±194.1 | 0.029 |
| Fe, mg | 16.7±2.8 | 15.0±3.4 | -1.7 | 16.2±3.5 | 13.7±3.1 | -2.5 | 15.9±3.6 | 13.2±3.4 | -2.7 | 0.889 | 16.3±3.2 | 14.0±3.3 | 0.013 |
| Na, mg | 3,218.3±783.2 | 2,587.1±542.0∗ | -631.2 | 3,615.1±1,459.8 | 3,213.7±1,686.4 | -401.5 | 3,067.6±710.9 | 2,286.0±992.8 | -781.6 | 0.836 | 3,300.3±1,031.4 | 2,695.6±1,197.6 | 0.001 |
| K, mg | 3,429.9±1,037.8 | 3,067.3±709.1 | -362.6 | 3,427.1±701.3 | 2,949.3±841.0 | -477.8 | 3,023.6±562.6 | 2,661.1±674.6 | -362.5 | 0.924 | 3,293.5±789.2 | 2,892.6±739.5 | 0.034 |
| Vit A, μgRE | 1,308.7±792.8 | 838.9±551.7 | -469.8 | 1,096.2±439.3 | 927.4±427.8 | -168.7 | 1,015.9±621.7 | 954.3±460.0 | -61.6 | 0.498 | 1,140.3±625.1 | 906.9±468.4 | 0.108 |
| Vit B1, mg | 1.5±0.5 | 1.3±0.4 | -0.2 | 1.3±0.4 | 1.9±2.0 | -0.6 | 1.3±0.6 | 1.2±0.6 | -0.1 | 0.676 | 1.4±0.5 | 1.5±1.2 | 0.652 |
| Vit B2, mg | 1.4±0.3 | 1.1±0.4 | -0.3 | 1.3±0.6 | 1.4±0.5 | -0.1 | 1.2±0.5 | 1.1±0.4 | -0.1 | 0.354 | 1.3±0.5 | 1.2±0.5 | 0.460 |
| Vit B6, mg | 2.9±1.0 | 2.8±0.6 | -0.1 | 2.6±0.8 | 2.4±0.7 | -0.3 | 2.5±0.7 | 2.1±0.6 | -0.4 | 0.889 | 2.7±0.8 | 2.4±0.7 | 0.162 |
| Niacin, mg | 27.6±15.7 | 19.1±4.1 | -8.6 | 19.3±3.2 | 18.5±6.1 | -0.8 | 18.8±5.4 | 15.8±5.6 | -3.1 | 0.325 | 21.9±10.3 | 17.8±5.4 | 0.047 |
| Vit C, mg | 115.3±64.7 | 104.2±39.5 | -11.0 | 145.1±42.0 | 80.0±40.1∗∗ | -65.0 | 97.5±49.3 | 92.1±55.7 | -5.4 | 0.118 | 119.3±54.8 | 92.1±45.3 | 0.036 |
| Vit E, mg | 15.4±4.6 | 16.6±6.4 | -1.2 | 18.4±7.0 | 14.5±4.5 | -3.9 | 15.8±6.3 | 14.2±7.9 | -1.6 | 0.432 | 16.5±6.0 | 15.1±6.3 | 0.352 |
| Folate, μg | 360.2±101.9 | 292.1±66.4 | -68.1 | 354.6±111.2 | 251.0±111.5 | -103.6 | 281.9±100.4 | 257.1±74.3 | -24.8 | 0.215 | 332.3±107.3 | 266.8±85.3 | 0.017 |
| Cholesterol, mg | 328.3±187.4 | 297.4±182.2 | -30.8 | 414.7±221.6 | 399.0±265.5 | -15.6 | 331.8±218.9 | 288.7±196.7 | -43.1 | 0.939 | 358.3±206.6 | 328.4±216.3 | 0.535 |
 XML Download