

 PDF
PDF ePub
ePub Citation
 Print
Print


Abstract
Figures and Tables
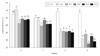 | Fig. 1Altered epidermal hydration in the groups. Hairless mice fed a control diet without UV irradiation for 6 weeks (group UV-); UV-irradiated hairless mice fed a control diet (group UV+) or diets supplemented with 1.0% royal jelly harvested from different areas in Korea or from China (group RJ4) in parallel with UV irradiation for 6 weeks. Values are mean ± SEM (0-1 wk; n = 10 in gro-ups UV-, UV+, RJ1, RJ3 and RJ4, n = 9 in group RJ2; 3-6 wk; n = 10 in groups UV-, UV+, RJ1, n = 9 in groups RJ2, RJ3, RJ4). Values without a common letter in each week are significantly different (p < 0.05) using one-way ANOVA and Duncan's multiple range test.
|
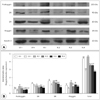 | Fig. 2Altered protein levels of profilaggrin, degradative intermediate and filaggrin in the epidermis of groups. Hairless mice fed a control diet without UV irradiation for 6 weeks (group UV-); UV-irradiated hairless mice fed a control diet (group UV+) or diets supplemented with 1.0% royal jelly harvested from different areas in Korea or from China (group RJ4) in parallel with UV irradiation for 6 weeks. A: Representative expression of profilaggrin, three-repeated intermediate (3RI), two-repeated intermediate (2RI) and filaggrin proteins in the epidermis of groups. B: The signal intensities from multiple experiments of A were quantified and the integrated areas were normalized to the corresponding value of keratin-5 (loading control). Values are mean ± SEM (n = 6). Values without a common letter in profilaggrin, 3RI, 2RI, filaggrin and total filaggrins are significantly different (p < 0.05) using one-way ANOVA and Duncan's multiple range test.
|
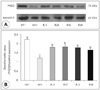 | Fig. 3Altered protein levels of peptidylarginine deiminase-3 (PAD3) in the epidermis of groups. Hairless mice fed a control diet without UV irradiation for 6 weeks (group UV-); UV-irradiated hairless mice fed a control diet (group UV+) or diets supplemented with 1.0% royal jelly harvested from different areas in Korea or from China (group RJ4) in parallel with UV irradiation for 6 weeks. A: Representative expressions of PAD3 in the epidermis of groups. B: The signal intensities from multiple experiments of A were quantified and the integrated areas were normalized to the corresponding value of keratin-5 (loading control). Values are mean ± SEM (n = 5). Values without a common letter are significantly different (p < 0.05) using one-way ANOVA and Duncan's multiple range test.
|
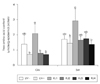 | Fig. 4Comparison of glutamate and serine contents in the epidermis of groups. Hairless mice fed a control diet without UV irradiation for 6 weeks (group UV-); UV-irradiated hairless mice fed a control diet (group UV+) or diets supplemented with 1.0% royal jelly harvested from different areas in Korea or from China (group RJ4) in parallel with UV irradiation for 6 weeks. Values are mean ± SEM (n = 6). Values without a common letter in glutamate and serine are significantly different (p < 0.05) using one-way ANOVA and Duncan's multiple range test.
|
Table 1
1) Groups UV- and UV+, hairless mice fed a control diet without (group UV-) or with (group UV+) UV irradiation for 6 weeks; Groups RJ1, RJ2, RJ3 and RJ4, hairless mice fed diets containing 1.0% Royal Jelly (RJ) harvested from different areas in Korea or from China (group RJ4) in parallel with UV irradiation for 6 weeks 2) AIN-93 Vitamin Mix #310025 (Dyets Inc., Bethlehem, PA): niacin, 3 g = kg; calcium pantothenate, 1.6 g = kg; pyridoxine HCl, 0.06 g = kg; thiamine HCl, 0.6 g = kg; riboflavin, 0.6 g = kg; folic acid, 0.2 g = kg; biotin, 0.2 g = kg; vitamin E acetate (500 IU = g), 15 g = kg; vitamin B12 (0.1%), 2.5 g = kg; vitamin A palmitate (500,000 IU = g), 0.8 g = kg; vitamin D3 (400,000 IU = g), 0.25 g = kg; vitamin K1=dextrose mix (10 mg = g), 7.5 g = kg; sucrose, 967.23 g = kg 3) AIN-93 G salt mix #210025 (Dyets Inc.): calcium carbonate, 357 g = kg; potassium phosphate (monobasic), 196 g = kg; potassium citrate H2O, 70.78 g = kg; sodium RJ3loride, 74 g = kg; potassium sulfate, 46.6 g = kg; magnesium oxide, 24 g = kg; ferric citrate USP, 6.06 g = kg; zinc carbonate, 1.65 g = kg; manganous carbonate, 0.63 g = kg; cupric carbonate, 0.3 g = kg; potassium iodate, 0.01 g = kg; sodium selenate, 0.01025 g = kg; ammonium paramolybdate 4H2O, 0.00795 g = kg; sodium metasilicate, 9H2O, 1.45 g = kg; RJ3romium potassium sulfate 12H2O, 0.275 g = kg; lithium RJ3loride, 0.0714 g = kg; boric acid, 0.0815 g = kg; sodium fluoride, 0.0635 g = kg; nickel carbonate, 0.0318 g = kg; ammonium vanadate, 0.066 g = kg; sucrose (finely powdered), 221.026 g = kg 4) Casein (nitrogen × 6.25), 870 g = kg
![]()
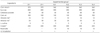
Table 2

1) Groups UV- and UV+, hairless mice fed a control diet without (group UV-) or with (group UV+) UV irradiation for 6 weeks; Groups RJ1, RJ2, RJ3 and RJ4, hairless mice fed diets containing 1.0% Royal Jelly (RJ) harvested from different areas in Korea or from China (group RJ4) in parallel with UV irradiation for 6 weeks 2) FER: food efficiency ratio: [weight gain (g)/week]/[food intake (g)/week] 3) All values are mean ± SEM (1 wk: n = 10 in group UV-, UV+, RJ1, RJ3, RJ4, n = 9 in group RJ2; 2 wk: n = 10 in groups UV-, UV+, RJ1, RJ3, n = 9 in groups RJ2, RJ4; 3-6 wk: n = 10 in groups UV-, UV+, RJ1, n = 9 in groups RJ2, RJ3, RJ4). Values without a common letter are significantly different (p < 0.05) using one-way ANOVA and Duncan's multiple range test
![]()
Table 3
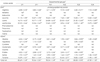
1) Data are Mean ± SEM (n = 6). Values without a common letter in the same row are significantly different (p < 0.05) using one-way ANOVA and Duncan's multiple range test 2) Groups UV- and UV+, hairless mice fed a control diet without (group UV-) or with (group UV+) UV irradiation for 6 weeks; Group RJ1, RJ2, RJ3 and RJ4, hairless mice fed diets containing 1.0% Royal Jelly (RJ) harvested from different areas in Korea or from China (group RJ4) in parallel with UV irradiation for 6 weeks 3) EAA: Essential Amino Acid, NEAA: Non Essential Amino Acid 4) nd: Not detected
![]()
 XML Download