Abstract
Figures and Tables
 | Fig. 1Ceramide levels in the epidermis of hairless mice fed a control diets without UV irradiation for 5 weeks (group C) and UV-irradiated hairless mice fed a control diet (group UV) or diets supplemented with 0.5% (M0.5) or 1.0% (M1.0) of red ginseng extracts mixed with Torilis fructus and Corni fructus (66.7% red ginseng) in parallel with UV irradiation for 5 weeks. The ceramide levels were determined in the epidermis of group C, UV, M0.5, and M1.0 by high-performance thin-layer chromatography and expressed as ng of ceramides/µg of protein. Date are mean ± SEM (n = 10). Values without a common letter are significant different (p < 0.05) using one-way ANOVA and Duncan's multiple range test. |
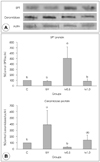
 | Fig. 2Altered expression of SPT and ceramidase proteins in the epidermis of hairless mice fed a control diet without UV irradiation for 5 weeks (group C) and UV-irradiated hairless mice fed a control diet (group UV) or diets supplemented with 0.5% (M0.5) or 1.0%(M1.0) of red ginseng extracts mixed with Torilis fructus and Corni fructus (66.7% red ginseng) in parallel with UV irradiation for 5 weeks. A: Representative expressions of SPT and ceramidase protein in epidermis of mice. Protein extracts (15 µg each) from groups C, UV, M0.5, and M1.0 were subjected to 10% sodium dodecylsulfate-polyacrylamide gel electrophoresis and immunoblotted with polyclonal antiserum against SPT (67 kDa) or ceramidase (45 kDa) and with actin (Santa Cruz Biotechnology Inc., Santa Cruz, CA)-specific antibodies. The region of gel shown for SPT was between the 62- and 83-kDa prestained molecular markers. The region of each gel shown for ceramidase and actin was between the 34- and 55-kDa prestained molecular markers. B: The signal intensities from multiple experiments of (A) were quantified, and the integrated areas were normalized, first to the corresponding value of actin and then to the signal observed in the normal control group (group C). Data are mean ± SEM (n = 10). Values without a common letter are significant different (p < 0.05) using one-way ANOVA and Duncan's multiple range test. |
Table 1

Composition is in units of g/kg of diet. Group C, hairless mice fed a control diet without UV irradiation for 5 weeks; groups UV, M0.5, and M1.0, hairless mice fed a control diet (UV) or diets supplemented with 0.5% (M0.5) or 1.0% (M1.0) of red ginseng extracts mixed with Torilis fructus and Corni fructus (66.7% red ginseng) contained diet in parallel with UV irradiation for 5 wks
1) AIN-93 Vitamin Mix #310025 (Dyets Inc., Bethlehem, PA)39) 2) AIN-93G salt mix 3210025 (Dyets Inc.)39) 3) Casein (nitrogen × 6.25), 870 g/kg
Table 2

1) Data are mean ± SEM value (n = 10). Group C, hairless mice fed a control diet without UV irradiation for 5 weeks; groups UV, M0.5, and M1.0, hairless mice fed a control diet (UV) or diets supplemented with 0.5% (M0.5) or 1.0% (M1.0) of red ginseng extracts mixed with Torilis fructus and Corni fructus (66.7% red ginseng) in parallel with UV irradiation for 5 weeks 2) Date are mean ± SEM (n = 10). Values without a common letter in the same row are significantly different (p < 0.05) using one-way ANOVA and Duncan's multiple range test 3) Total RNA in the epidermis of group C, UV, M0.5, and M1.0 was isolated, and real-time PCR was performed for SPT and ceramidase mRNAs. The signal intensities from real-time PCR analysis were quantified and normalized, first to the corresponding values for the GAPDH internal controls and then to that of normal control group (group C)


 PDF
PDF ePub
ePub Citation
 Print
Print


 XML Download