

 PDF
PDF ePub
ePub Citation
 Print
Print


Abstract
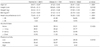
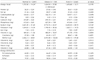
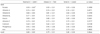
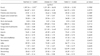
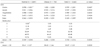
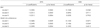
The purpose of this study was to compare nutrient intake and diet quality of obese women to those of non-obese women, and to investigate the relationship between diet quality and obesity index in females. We analyzed data from the combined 2007-2009 Korean National Health and Nutrition Examination Survey (KNHANES). In this study, according to their BMI (above 25 kg/m2), we classified the subjects into the obese group (n = 724) and non-obese control group (n = 2,841). Nutrient adequacy ratio (NAR), the number of foods (Dietary Variety Score, DVS), and food groups consumed (Dietary Diversity Score, DDS) were analyzed by using the data from the 24-recall method. The average energy intake of both the obese and control group were 1634.94 kcal and 1,707.81 kcal, respectively (p = 0.0199). The obese group consumed significantly lower quantities of calcium per 1,000 kcal compared to the control group (p = 0.0261). With regards to diet quality, calcium NAR in the obese group was significantly lower than that of the control group (p = 0.0158). MAR values for the obese and the control group was 0.79 and 0.80, respectively and revealed no statistical difference. The obese group showed a significantly lower consumption of milk compared to the control group (p = 0.0162). The average DVS of the obese and control group was 28.63 and 30.41, respectively and revealed a statistical significance (p = 0.0003). DDS in the obese group (3.686) was significantly lower than that of the control group (3.769)(p = 0.0253). DVS showed considerable negative relationships with BMI or waist circumference after it was adjusted for potential confounding factors. In conclusion, obese women had lower calcium intake quality, milk consumption, DVS and DDS than those of the control group. In Korean females, food intake variety did adversely affect obesity index. Further studies are needed to confirm this finding.
Figures and Tables


References
1. Ministry of Health, Welfare and Family Affairs, Korea Centers for Disease Control and Prevention. Korea Health Statistics 2009: Korea National Health and Nutrition Examination Survey (KNHANESIV-3). 2010. Seoul:
2. World Health Organization. Obesity: Preventing and managing the global epidemic. Report of a WHO consultation. 1998. Genova:
3. Szponar L, Rychlik E. Dietary intake elderly subjects in rural and urban area in Poland. Pol Merkur Lekarski. 2002. 13(78):490–496.
4. Drewnowski A, Henderson SA, Driscoll A, Rolls BJ. The Dietary Variety Score: assessing diet quality in healthy young and older adults. J Am Diet Assoc. 1997. 97(3):266–271.
5. Jovanović GK, Zezelj SP, Malatestinić D, Sutić IM, Stefanac VN, Dorcić F. Diet quality of middle age and older women from Primorsko-Goranska County evaluated by healthy eating index and association with body mass index. Coll Antropol. 2010. 34:Suppl 2. 155–160.
6. Previdelli AN, Lipi M, Castro MA, Marchioni DM. Dietary quality and associated factors among factory workers in the metropolitan region of Sao Paulo, Brazil. J Am Diet Assoc. 2010. 110(5):786–790.

7. Arroyo Izaga M, Rocandio Pablo AM, Ansotegui Alday L, Pascual Apalauza E, Salces Beti I, Rebato Ochoa E. Diet quality, overweight and obesity in university students. Nutr Hosp. 2006. 21(6):673–679.
8. Yeon JY, Bae YJ. Evaluation of nutrient and food intake status, and dietary quality -Focused on comparison with overweight and normal female university students-. Korean J Food Nutr. 2010. 23(4):453–461.
9. Kim SH, Kim JY, Ryu KA, Sohn CM. Evaluation of the dietary diversity and nutrient intakes in obese adults. Korean J Community Nutr. 2007. 12(5):583–591.
10. Jun YS, Choi MK, Bae YJ, Sung CJ. Effect of meals variety on obesity index, blood pressure, and lipid profiles of Korean adults. Korean J Food Cult. 2006. 21(2):216–224.
11. Lee MS, Kwak CS. The comparison in daily intake of nutrients, quality of diets and dietary habits between male and female college students in Daejeon. Korean J Community Nutr. 2006. 11(1):39–51.
12. Kant AK. Indexes of overall diet quality: a review. J Am Diet Assoc. 1996. 96(8):785–791.
13. Krebs-Smith SM, Smiciklas-Wright H, Guthrie HA, Krebs-Smith J. The effects of variety in food choices on dietary quality. J Am Diet Assoc. 1987. 87(7):897–903.
14. Beydoun MA, Gary TL, Caballero BH, Lawrence RS, Cheskin LJ, Wang Y. Ethnic differences in dairy and related nutrient consumption among US adults and their association with obesity, central obesity, and the metabolic syndrome. Am J Clin Nutr. 2008. 87(6):1914–1925.
15. Chung HK, Kang JH, Shin MJ. Assessment for nutrient intakes in Korean women according to obesity and metabolic syndrome. Korean J Community Nutr. 2010. 15(5):694–703.
16. Baecke JA, Burema J, Deurenberg P. Body fatness, relative weight and frame size in young adults. Br J Nutr. 1982. 48(1):1–6.
17. Huang L, Xue J, He Y, Wang J, Sun C, Feng R, Teng J, He Y, Li Y. Dietary calcium but not elemental calcium from supplements is associated with body composition and obesity in Chinese women. PLoS One. 2011. 6(12):e27703.
18. Shahar DR, Schwarzfuchs D, Fraser D, Vardi H, Thiery J, Fiedler GM, Blüher M, Stumvoll M, Stampfer MJ, Shai I. DIRECT Group. Dairy calcium intake, serum vitamin D, and successful weight loss. Am J Clin Nutr. 2010. 92(5):1017–1022.
19. Caron-Jobin M, Morisset AS, Tremblay A, Huot C, Légaré D, Tchernof A. Elevated serum 25(OH)D concentrations, vitamin D, and calcium intakes are associated with reduced adipocyte size in women. Obesity (Silver Spring). 2011. 19(7):1335–1341.
20. Teegarden D. The influence of dairy product consumption on body composition. J Nutr. 2005. 135(12):2749–2752.
21. Teegarden D, White KM, Lyle RM, Zemel MB, Van Loan MD, Matkovic V, Craig BA, Schoeller DA. Calcium and dairy product modulation of lipid utilization and energy expenditure. Obesity (Silver Spring). 2008. 16(7):1566–1572.
22. Jacobsen R, Lorenzen JK, Toubro S, Krog-Mikkelsen I, Astrup A. Effect of short-term high dietary calcium intake on 24-h energy expenditure, fat oxidation, and fecal fat excretion. Int J Obes (Lond). 2005. 29(3):292–301.
23. Marques-Vidal P, Gonçalves A, Dias CM. Milk intake is inversely related to obesity in men and in young women: data from the Portuguese Health Interview Survey 1998-1999. Int J Obes (Lond). 2006. 30(1):88–93.
24. Rosell M, Johansson G, Berglund L, Vessby B, de Faire U, Hellénius ML. Associations between the intake of dairy fat and calcium and abdominal obesity. Int J Obes Relat Metab Disord. 2004. 28(11):1427–1434.
25. Zemel MB, Thompson W, Milstead A, Morris K, Campbell P. Calcium and dairy acceleration of weight and fat loss during energy restriction in obese adults. Obes Res. 2004. 12(4):582–590.
26. Layman DK. The role of leucine in weight loss diets and glucose homeostasis. J Nutr. 2003. 133(1):261S–267S.
27. Zhao Y, Martin BR, Wastney ME, Schollum L, Weaver CM. Acute versus chronic effects of whey proteins on calcium absorption in growing rats. Exp Biol Med (Maywood). 2005. 230(8):536–542.
28. Louie JC, Flood VM, Hector DJ, Rangan AM, Gill TP. Dairy consumption and overweight and obesity: a systematic review of prospective cohort studies. Obes Rev. 2011. 12(7):e582–e592.
29. Arabshahi S, van der Pols JC, Williams GM, Marks GC, Lahmann PH. Diet quality and change in anthropometric measures: 15-year longitudinal study in Australian adults. Br J Nutr. 2011. 1–10.
30. Gao SK, Beresford SA, Frank LL, Schreiner PJ, Burke GL, Fitzpatrick AL. Modifications to the Healthy Eating Index and its ability to predict obesity: the Multi-Ethnic Study of Atherosclerosis. Am J Clin Nutr. 2008. 88(1):64–69.
31. Drewnowski A, Fiddler EC, Dauchet L, Galan P, Hercberg S. Diet quality measures and cardiovascular risk factors in France: applying the Healthy Eating Index to the SU.VI.MAX study. J Am Coll Nutr. 2009. 28(1):22–29.
32. Azadbakht L, Mirmiran P, Azizi F. Dietary diversity score is favorably associated with the metabolic syndrome in Tehranian adults. Int J Obes (Lond). 2005. 29(11):1361–1367.
33. Lee JE, Ahn Y, Kimm K, Park C. Study on the associations of dietary variety and nutrition intake level by the number of survey days. Korean J Nutr. 2004. 37(10):908–916.
34. Bae YJ, Sung CJ. A comparison between postmenopausal osteoporotic women and normal women of their nutrient intakes and the evaluation of diet quality. Korean J Community Nutr. 2005. 10(2):205–215.
35. Kant AK, Graubard BI. A comparison of three dietary pattern indexes for predicting biomarkers of diet and disease. J Am Coll Nutr. 2005. 24(4):294–303.
 XML Download