Abstract
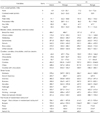
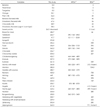
The Na, component of salt, can increase the risk of high blood pressure and hypertension. Especially, children are exposed to an increased risk of high sodium intake, because they often consume Na-rich processed foods and commercially prepared foods in the street. However, the database for the sodium and chloride content for these children's favorite foods is insufficient. In this study, the Na and Cl contents in 89 children's favorite foods were analyzed by using Instrumental Neutron Activation Analysis (INAA) method. The analyzed food items were presented after being classified into 33 kinds of food groups. The Na contents in 100 g children's favorite foods ranged from 0.3 mg to 35.1mg in fruits, 28.9mg to 82.5mg in milks, 127.2 mg to 602.2 mg in breads, cakes, sandwiches, and rice cakes, 2.5 mg to 1169.9 mg in candies, cookies and ice creams, 226.9 mg to 693.7 mg in commercially prepared street foods, and 103.4 mg to 875.8 mg in fast foods of westernized restaurant. Among children's favorite food groups, 100 g fried chicken, hotdog, burgers, and donuts contained an average Na of 536 mg, 553 mg, 794 mg, and 562.2 mg, respectively, so they are classified as 'high Na foods'. In contrast, 100 g fruits and dairy products contained Na an average 4.9 mg and 43.4 mg, respectively, being classified as 'low Na foods'. One serving of ramen, mandu·noodle, and burger·pizza can supply over 667mg Na, which is one third of the KDRI targeted intake. Likewise, the Cl contents in children's favorite foods were diverse according to food groups. The Cl contents in the analyzed foods differed from the 1.5 times of Na content, which is assumed in general. This study showed that the Na and Cl contents in children's favorite foods are very diverse. Conclusively, a strategy to reduce Na contents in the fast foods such as noodles and westernized restaurant foods is necessary for children health.
Figures and Tables
References
1. Ministry of Health, Welfare and Family Affairs. 2005 Korean National Health and Nutritional Examination Survey. 2006.
2. Choi SK, Choi HJ, Chang NS, Cho SH, Choi YS, Park HK, Joung HJ. Snacking behaviors in middle and high school students in Seoul. Korean J Community Nutr. 2008. 13(2):199–206.
3. Lyu ES, Chae IS, Lee KH. Interrelations among fast food, beverage intake and sociality, anger expression of adolescents in the Busan area. Korean J Community Nutr. 2008. 13(6):829–839.
4. Kim K, Park E. Nutrient density of fast food consumed by the middle school students in Cheungju city. Korean J Community Nutr. 2005. 10(3):271–280.
5. Kim MJ, Oh SY, Yoon KS. A study on students' intake of streets food and their perception toward their hygiene status of street foods and microbilogical analysis. Korean J Food Cult. 2007. 22(3):342–352.
6. Lee SS. A study on dietary behavior of children according to their perferences for fast food. Korean J Community Nutr. 2004. 9(2):204–213.
7. Lee JS. A comparative study on fast foods consumption pattern classified by age in Busan. Korean J Community Nutr. 2007. 12(5):534–544.
9. Macdiarmid J, Loe J, Craig LCA, Masson LF, Holmes B, Mc-Neill B. Meal and snacking patterns in school aged children in Scotland. Eur J Clin Nutr. 2009. 63:1297–1304.

10. Cooke L. The importance of exposure for healthy eating in childhood: a review. J Hum Nutr Diet. 2007. 20(4):294–301.

11. Kang MH, Yoon KS. Elementary School Students' Amounts of Sugar, Sodium, and Fats Exposure through Intake of Processed Food. J Korean Soc Food Sci Nutr. 2009. 38(1):52–61.

12. Ministry of Health, Welfare and Family Affairs. 2010. 08. cited 2010 August 6. Available from: http://www.law.go.kr/LSW/lsInfoP.do?lsiSeq=98630#0000; 2008.
13. The Korean Nutrition Society. Dietary Reference Intake for Koreans. 2005. Seoul:
14. Brion MJ, Ness AR, Davey Smith G, Emmett P, Rogers I, Whincup P, Lawlor DA. Sodium intake in infancy and blood pressure at 7 years: findings from the Avon Longitudinal Study of Parents and Children. Eur J Clin Nutr. 2008. 62:1162–1169.

15. Reduction of trans fat, sugar, sodium contents in restaurant and processed foods for children. KFDA Report. 2009.
16. Matsuzuki H, Muto T, Haruyama Y. School children's salt intake is correlated with salty taste preference assessed by their mothers. Tohoku J Exp Med. 2008. 215(1):71–77.

17. Kim GH, Lee HM. Frequent consumption of certain fast foods may be associated with an enhanced preference for salt taste. J Hum Nutr Diet. 2009. 22(5):475–480.

18. Lee KW, Lee HS, Lee MJ. A study on the eating behaviors of self-purchasing snack among elementary school students. Korean J Food Cult. 2005. 20:594–602.
19. KFDA. 2010. 08. cited 2010 August, 6. Available from:
http://www.kfda.go.kr/index.kfda?x=28&searchkey=title&mid=92&searchword=식품등의표시기준&y=7&pageNo=1&seq=3074&cmd=v, 2007.
20. Yun JH, Cho SD, Kim SY, Lee EJ, Park HK, Kim MC, Kim GH. Study on suggestions for the nutritional and hygienic standards and guidelines for quality certification in children's preferable food. J Korean Soc Food Sci Nutr. 2008. 37(5):589–597.

21. Park HR, Jeong GO, Lee SL, KIm JY, Kang SA, Park KY, Ryou HJ. Workers intake too much salt from eating out dishes and food service cafeterias: direct chemical analysis of sodium content. Nutr Res Pract. 2009. 3(4):328–333.

22. Kwon Y, Rhee M, Kim L, Kwon K, Kim S, Shin H, Park S, Lee E, Park H, Park Y. Differences between analyzed and estimated sodium contents of food composition table or food exchange list. J Korean Soc Food Sci Nutr. 2010. 39(4):535–541.

23. Son SM. Koreans' problems in salt intakes and the role of dietitians for low-salt diet. Nutr Diet. 2007. 30:10–14.
24. Moon HK, Choi SO, Kim JE. Dishes contributing to sodium intake ofelerly living in rural areas. Korean J Community Nutr. 2009. 14:123–136.
25. Chang SO. The amount of sodium in the processed foods, the use of sodium information on the nutrition label and the acceptance of sodium reduced ramen in the female college students. Korean J Nutr. 2006. 39(6):585–591.
26. Kim KS, Paik HY. A Comparative study on optimum gustation of salt and sodium intake in young and middle-aged Korean women. Korean J Nutr. 1992. 25(1):32–41.
27. Royo-Bordonada MA, Gorgojo L, de Oya M, Garcés C, Rodríguez-Artalejo F, Rubio R, del Barrio JL, Martín-Moreno JM. Food sources of nutrients in the diet of Spanish children: the Four Provinces Study. Br J Nutr. 2003. 89(1):105–114.

28. Thomson BM, Vannoort RW, Haslemore RM. Dietary exposure and trends of exposure to nutrient elements iodine, iron, selenium and sodium from the 2003-4 New Zealand Total Diet Survey. Br J Nutr. 2008. 99(3):614–625.

29. Verma P, Mittal S, Ghildiyal A, Chaudhary L, Mahajan KK. Salt preference: age and sex related variability. Indian J Physiol Pharmacol. 2007. 51(1):91–95.
30. Rural Development Administration (RDA). Food Composition Table. 2006. 7th ed. Rural Resources Development Institute.
31. Hong SM. Nutrient database construction and program of activation of menu nutrition labeling of restaurants KFDA report. 2009.
32. Cho SY, Hong WJ, Lee JY, Kang SH, Chung YS. A study on mineral distribution in Korean foodstuffs by neutron activation analysis. Korean J Food Sci Technol. 2002. 34(3):390–395.
33. Karppanen H, Karppanen P, Mervaala E. Why and how to implement sodium, potassium, calcium, and magnesium changes in food items and diets? J Hum Hypertens. 2005. 19:Suppl 3. s10–s19.

34. Pietinen P, Valsta LM, Hirvonen T, Sinkko H. Labelling the salt content in foods: a useful tool in reducing sodium intake in Finland. Public Health Nutr. 2008. 11(4):335–340.

35. Kremer S, Mojet J, Schimojo R. Salt reduction in foods using naturally brewed soy source. J Food Sci. 2009. 74(6):s255–s262.
36. The Korea Nutrition Society. Food values. 2009. Seoul:


 PDF
PDF ePub
ePub Citation
 Print
Print


 XML Download