

 PDF
PDF ePub
ePub Citation
 Print
Print


Abstract
The study aim was to examine the effect of sensory responses of subjects after 6-month dietary sodium reduction with the aid of nutritional education. Fourteen female college students voluntarily restricted their sodium intake for 6 months, during which time they received nutritional education on the low sodium diet. As a control group, 10 students, whose anthropometric measurement, sodium intake behavior, and blood pressure were not different from those of the experimental group, were maintained on a normal diet. For the sensory responses of subjects, the salt taste perception and pleasantness for graded (0.15-1.3%) NaCl solutions were measured by a 9-point hedonic scale. The optimum sodium concentration, urinary sodium excretion, and blood pressure were measured. All the measurements were done at the beginning and end of the experiment. The sensory evaluation revealed an absence of any difference between the two groups in salt taste perception and pleasantness responses at the beginning. After 6-month adaptation, the experimental group subjects showed higher responses to low NaCl solution (0.15, 0.3, 0.5%) in salt taste perception and pleasantness evaluation while the control group subjects exhibited the opposite response. The optimum sodium concentration was reduced from 105.6 mmol to 80.7 mmol (p = 0.015) and the urinary sodium excretion was also reduced from 1,398 mg to 906 mg (p = 0.041) only in the experimental group. Systolic blood pressure was significantly reduced in the experimental group, although there was no correlation between the urinary sodium excretion and blood pressure. The optimum sodium concentration was negatively correlated with the urinary sodium excretion (r = 0.418, p = 0.053), indicating that adaptation to low sodium diet can reduce sodium intake. Further study on the individual responses of subjects on a low sodium diet by periodical evaluation may provide useful data for setting the duration needed to stabilize a lowered appetite for sodium.
Figures and Tables
Fig. 1
Saltiness response to graded NaCl solution pre-and post-experiment with saltiness scale 1 = extremely insipid, 5 = proper, 9 = extremely salty. Comparison of responses between pre- and post-experiment at each NaCl concentration by paired t-test was not significant by p < 0.05.
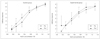
Fig. 2
Pleasantness response to graded NaCl solution pre-and post-experiment with scale 1 = extremely dislike, 5 = so and so, 9 = extremely like. Comparison of responses between pre-and post-experiment at each NaCl concentration by paired t-test was not significant with p < 0.05.
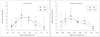
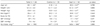
Table 4
Optimum saltness concentration, urinary sodium and creatinine, and blood pressure of subjects at the beginning and the end of study
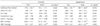
1) Pre-: at the beginning of study, 2) Post-: at the end of study, 3) Mean ± SD, 4) p-values between pre- and post- in each control and experimental group by paired Student's t-test, 5) Not significant (p = 0.734) between pre- optimum Na values in control and experimental group by Student's t-test, SBP: Systolic blood pressure, DBP: Diastolic blood pressure, *: p < 0.05, **: p < 0.01, ***: p < 0.001

References
1. Vander AJ, Sheman JH, Luciano DS. Human Physiology. 1990. 5th ed. New York: Mcgraw Hill Publishing Co.;471–512.
2. Dahl LK. Salt intake and salt need. N Engl J Med. 1958. 258:1152–1156.

3. Holbrook JT, Patterson KY, Bodner JE, Douglas LW, Veillon C, Kelsay JL, Smith JC. Sodium and potassium intake and balance in adults consuming self-selected diets. Am J Clin Nutr. 1984. 40:786–793.
4. Pietinen P. Estimating sodium intake from food consumption data. Ann Nutr Metab. 1982. 26:90–99.
5. He J, Gu D, Chen J, Jaquish CE, Rao DC, Hixson JE, Chen JC, Duan X, Huang JF, Chen CS, Kelly TN, Bazzano LA, Whelton PK. Gender difference in blood pressure responses to dietary sodium intervention in the GenSalt study. J Hypertens. 2009. 27(1):48–54.
6. de Wardener HE, MacGregor GA. Harmful effects of dietary salt in addition to hypertension. J Hum Hypertens. 2002. 16(4):213–223.
7. Sanders PW. Dietary salt intake, salt sensitivity, and cardiovascular health. Hypertension. 2009. 53(3):442–445.
8. Chang SO. A study on the perception, use, and demand of housewife-consumers for nutrition label. Korean J Nutr. 2000. 33(7):763–773.
9. Chang SO. The amount of sodium in the processed foods, the use of sodium information on the nutrition lable and acceptance of sodium reduced ramen in the female college students. Korean J Nutr. 2006. 39(6):585–591.
10. The Korean Nutrition Society. Dietary reference intakes for Korean. 2005. Seoul:
11. Strategies to reduce sodium intake in the United States. Institute of Medicine. 2010. 04. www.iom.edu/sodiumstrategies.
12. Chung HR. Policy approaches to reduce sodium intake in the public. Conference for Strategy Development of Optimal Salt Intake for Korean. 2002. 48–55.
13. Bibbins-Domingo K, Chertow GM, Coxson PG, Moran A, Lightwood JM, Pletcher MJ, Goldman L. Projected effect of dietary salt reduction on future cardiovascular disease. N Engl J Med. 2010. 362(7):590–599.
14. Kim YS, Paik HY. Measurement of Na intake in Korean Adult Female. Korean J Nutr. 1987. 20(5):341–349.
15. Contreras RJ, Ftank M. Sodium deprivation alters neural responses to gustatoy stimuli. J Gen Physiol. 1979. 73:569–594.
16. Bertino M, Beauchamp GK, Engelman K. Long-term reduction in dietary sodium alters the taste of salt. Am J Clin Nutr. 1982. 36(6):1134–1144.
17. Pangborn RM, Pecore SD. Taste perception of sodium chloride in relation to dietary intake of salt. Am J Clin Nutr. 1982. 35(3):510–520.
18. Blais CA, Pangborn RM, Borhani NO, Ferrel MF, Prineas RJ, Laing B. Effect of dietary sodium restriction on taste responses to sodium chloride, a longitudinal study. Am J Clin Nutr. 1986. 44:232–243.
19. Bertino M, Beauchamp GK, Riskey DR, Engelman K. Taste perception in three individuals on a low sodium diet. Appetite. 1981. 2:67–73.
20. Kwak EH, Lee SL, Lee HS, Kwun IS. Relation dietary and urinary Na, K, Ca, to blood pressure in elderly people in rural area. Korean J Nutr. 2003. 36(1):75–82.
21. Son SM, Huh GY, Lee HS. Development and evaluation of validity of dish frequency questionnaire (DFQ) and short DFQ using Na index for estimation of habitual sodium intake. Korean J Community Nutr. 2005. 10(5):677–692.
22. Kim JY, Kang YR, Lee MY, Paik HY. Sodium intake and preference for salty taste in elementary school children residing in rural and urban areas of Korea. Korean J Nutr. 1990. 23(4):248–256.
23. Kim KS, Paik HY. A Comparative study on optimum gustation of salt and sodium intake in young and middle-aged korean women. Korean J Nutr. 1992. 25(1):32–41.
24. Choi BS, Kim EJ, Park YS. Study on sodium intake and preference for salty taste in college women. J Korean Soc Food Sci Nutr. 1997. 26(1):154–160.
25. Lim HJ. A study on the food intake, sodium and potassium intakes and urinary excreation of preschool children in Pusan. Korean J Nutr. 2000. 33(6):647–659.
26. Yoon YO, Kim ES, Ro HK. Sodium intakes of some industrial workers. Korean J Nutr. 1990. 23(1):37–43.
27. Kim EY. Anthropometry, blood pressure, salt threshold and salt preference of children of orphan in Seoul and Kangnung. Korean J Nutr. 1994. 27(2):181–191.
28. Son SM, Park YS, Lim WJ, Kim SB, Jeong YS. Sodium intakes of korean adults with 24-hour urine analysis and dish frequency questionnaire and comparison of sodium intakes according to the regional areas and dish group. Korean J Community Nutr. 2007. 12(5):545–558.
29. Park YS, Son SM, Lim WJ, Kim SB, Jeong YS. Comparison of dietary behavior related to sodium intake by gender and age. Korean J Community Nutr. 2008. 13(1):1–12.
30. Ahn EJ, Noh HY, Chung J, Paik HY. The effect of zinc status on salty taste acuity, salty taste preference, sodium intakeand blood pressure in korean young adults. Korean J Nutr. 2010. 43(2):132–140.
31. Cho YY. Practice guidline for reducing salt intake. Conference for Strategy Development of Optimal Salt Intake for Korean. 2002. 31–41.
32. Lee HS, Lee KS. Measurement and evaluation of optimum salt concentration in usual dishes for the menu suggestion. Korean J Food Cookery Sci. 1996. 12(3):305–311.
33. Koo NS. Sensory evaluation. 2006. Seoul: Kyomunsa.
34. Lee JY. A study of salt consumption and related factors among adult females. Korean J Food Nutr. 2001. 14(5):430–440.
35. Yamamoto ME, Caggiula AW, Olson MB, Keisey SF, McDonald RH. Application of overnight urine collections and food records for monitoring the sodium and potassium intakes of groups and individuals. J Am Diet Assoc. 1994. 94:897–899.
36. Korea Centers for Disease Control and Prevention. The Fourth Korea National Health and Nutrition Examination Survey (KNHANES IV). 2008.
37. Gillum FR, Prineas RJ, Anderson P, Kebede J. Lack of response of salt taste threshold and preference to dietary restriction in mild hypertension. Am Heart J. 1981. 102:138. (letter).
38. Graudal NA, Galloe AM, Garred P. Effects of sodium restriction on blood pressure, renin, aldosteron, catecholamines, cholesterol and trigliceride: a meta analysis. JAMA. 1998. 279(17):1383–1391.
39. Law MR, Frost CD, Wald NJ. By how much does dietary salt reduction lower blood pressure? III--Analysis of data from trials of salt reduction. BMJ. 1991. 302(6780):819–824.
40. Park JA, Yoon JS. The relationship of renin activity, homonal Na, Ca and habitual Na, Ca intake in hypertension. Korean J Nutr. 1999. 32(6):671–680.
41. He J, Gu D, Chen J, Jaquish CE, Rao DC, Hixson JE, Chen JC, Duan X, Huang JF, Chen CS, Kelly TN, Bazzano LA, Whelton PK. GenSalt Collaborative Research Group. Gender difference in blood pressure responses to dietary sodium intervention in the GenSalt study. J Hypertens. 2009. 27(1):48–54.
42. Norat T, Borman R, Luben R, Welch A, Khaw KT, Wareham N, Bingham S. Blood pressure and interactions between the angiotension polymorphism AGT M235T and sodium intake: a cross-sectional population study. Am J Clin Nutr. 2008. 88:392–397.
 XML Download