Abstract
The purpose of this study was to investigate the effects of aging process on the immunity in human subjects. In this investigation, nineteen families of three generations (daughters on college age, their mothers, and grandmothers) participated to avoid genetic variation among individuals. Dietary food records, anthropometric measurements and biochemical assessments of serum nutrients were used to evaluate the nutritional status of subjects. The immune parameters of subjects were assessed by the total and differential WBC count. Total B and T lymphocytes, and T cell subsets were quantified by flowcytometer. Serum immunoglobulin G, A, M concentrations were also measured as an index of humoral immunity. The result of this study can be summarized as follows: 1. Along with the aging process, body fat was found to be increased whereas lean body mass and total body water were diminished. Since there were no significant difference in serum vitamin E levels in all age groups, serum retinal concentrations tended to decrease as one gets old. 2. Although total number of T lymphocytes seemed to be unchanged, B lymphocytes and NK cell numbers were increased by aging. The Percentage of CD8 + lymphocytes was lower in the elderly subjects compared with the younger, resulting in higher ratio of CD4 +/CD8 + lymphocytes in the elderly. Serum Ig G and Ig A levels remained unchanged, but IgM levels were significantly decreased as the age processes continue. Taking all together, it could be suggested that the alteration of immune cell population by aging is selective and possibly nonage factors such as nutrition may be attributable to the change of immunity in the elderly. The nutritional status and aging process may selectively affect both the cell-mediated (CD8 +, CD4 +:CD8 + ratio, NK cell) and humoral (B lymphocyte, Immunoglobulin M, G) immune parameters in human subjects.
REFERENCES
2). JH Choi. Modulation of the Aging Process by Food Restriction. J Korean Soc Food Sci Nutr. 1991; 20(2):187–196.
3). WK Cho. Aging and Gastroenterologic Changes. Korean J Food & Nutr. 1993; 6(3):219–230.
4). Navarrete-Reyes AP, Montana-Alvarez M. Inflammaging. Aging inflammatory origin. Rev Invest Clin. 2009; 61(4):327–336.
5). Tahara S, Mastsno M, Kaneko T. Age-related changes in oxidative damage to lipids and DNA in rat skin. Mech Ageing Dev. 2001; 122(4):415–426.

6). IS Lim. The Approach of Antioxidant, Endocrine, & Immune System on Exercise & Aging. Exerc Sci. 2002; 11(1):35–51.
7). Finch CE, Crimmins EM. Inflammatory exposure and historical changes in human life-spans. Science. 2004; 305(5691):1736–1739.

8). Chen J, Li J, Lim FC, Wu Q, Douek DC, Scott DK, Ravussin E, Hsu HC, Jazwinski SM, Mountz JD. Maintenance of naïve CD8 T cells in nonagenarians by leptin, IGFBP3 andT3. Mech Ageing Dev. 2010; 131(1):29–37.
10). Faber J, Vos P, Kegler D, van Norren K, Argilés JM, Laviano A, Garssen J, van Helvoort A. Beneficial immune modulatory effects of a specific nutritional combination in a murine model for cancer cachexia. Br J Cancer. 2008; 99(12):2029–2036.

12). Um MY, Choi WH, An JY, Kim SR, Ha TY. Physiological Activity/Nutrition: Effect of Defatted Sesame and Perilla Methanol Extracts on Cognitive Function and Antioxidant Activity in SA-MP8 Mice. Korean J Food Sci Technol. 2004; 36(4):637–642.
13). Iannuzzi SM, Prestwood KM, Kenny AM. Prevalence of Sar-copenia and predictors of skeletal muscle mass in healthy, older men and women. J Gerontol A Biol Sci Med. 2002; 57(12):772–777.
14). Chang UJ, Ko SA. A Study on the Dietary Intake Survey Method Using a Cameraphone. Korean J Community Nutr. 2007; 12(2):198–205.
15). Lee JE, Ahn YJ, Kim KC, Park C. Study on the associations of dietary variety and nutrition intake level by the number of survey days. Korean J Nutr. 2004; 37(10):908–916.
16). Frances Sizer, Ellie Whitney. Nutrition concepts and controversies. USA: Thomson Wadsworth;2006. p. 215–226.
17). Sareen S, Gropper , Jack L Smith, James L Groff. Advanced Nutrition and Human Metabolism. USA: Thomson Wadsworth;2005. p. 326–361.
18). Oh HM, Yoon JY, Cho SH, Yoon JS. Vitamin A and Vitamin E Status of Diabetic Patients and Normal Adults in Korea. Korean J Nutr. 2009; 42(4):318–326.

19). Cho SH, Choi YS. Relation of Serum Vitamin E and Lipopero-xide Levels with Serum Lipid Status in Korean Men. Korean J Community Nutr. 1997; 2(1):44–51.
20). Peter Wood. Understanding Immunology. United Kingdom: Pearson Education Limited;2006. p. 1–17.
21). Lauralee Sherwood. Human Physiology from cells to system. USA: Thomson Brooks/cole;2007. p. 407–409.
22). Weksler ME, Hutteroth TH. Impaired lymphocyte function in aged humans. J Clin Invest. 1974; 53:99.

24). Angener W, Cohne G, Reuter A, Britinger G. Decrease of T lymphocytes during ageing. Lancet. 1974; 1:1164.
26). Pettiford JN, Jason J, Nwanyanwu OC, Archibald LK, Kazembe PN, Dobbie H, Jarvis WR. Age-related differences in cell-specific cytokine production by acutely ill Malawian patients. Clin Exp Immunol. 2002; 128(1):110–117.

27). Pawelec G, Effros RB, Caruso C, Remarque E, Barnett Y, Solana R. T cells and aging. Front Biosci. 1999; 4:216–269.
28). Frasca D, Landin AM, Riley RL, Blomberg BB. Mechanisms for decreased function of B cells in aged mice and humans. J Immunol. 2008; 180(5):2741–2746.

29). Linton PJ, Dorshkind K. Age-related changes in lymphocyte development and function. Nat Immunol. 2004; 5(2):133–139.

30). Strandberg L, Verdrengh M, Enge M, Andersson N, Amu S, Onnheim K, Benrick A, Brisslert M, Bylund J, Bokarewa M, Nilsson S, Jansson JO. Mice chronically fed high-fat diet have increased mortality and disturbed immune response in sepsis. PLoS One. 2009; 4(10):e7605.

31). Miyazaki Y, Iwabuchi K, Iwata D, Miyazaki A, Kon Y, Niino M, Kikuchi S, Yanagawa Y, Kaer LV, Sasaki H, Onoe K. Effect of high fat diet on NKT cell function and NKT cell-mediated regulation of Th1 responses. Scand J Immunol. 2008; 67(3):230–237.

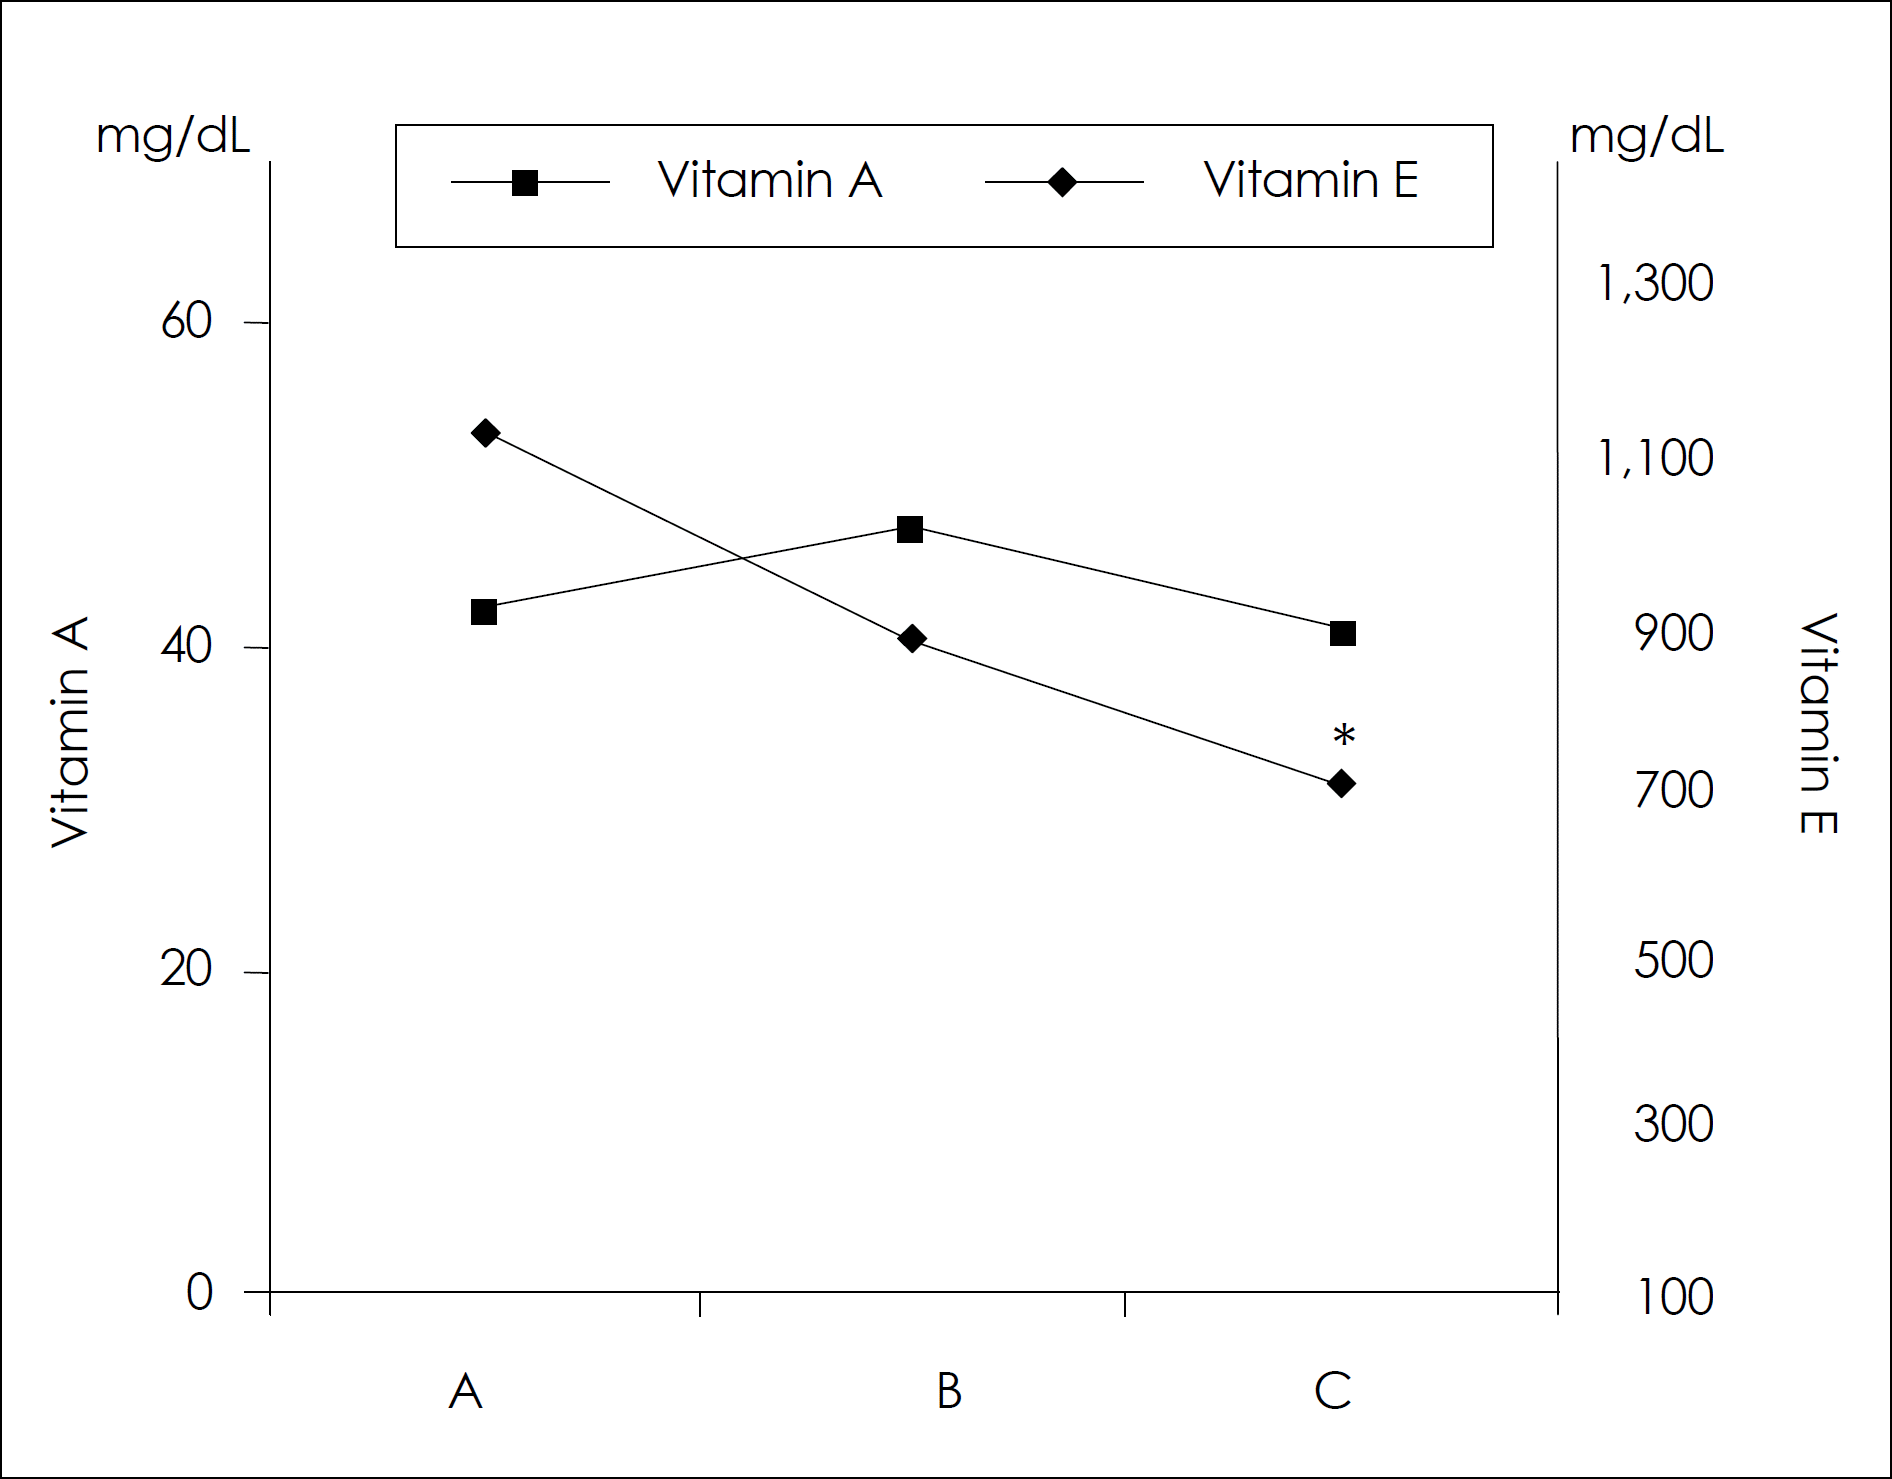
Fig. 1.
Serum vitamin A and E levels in different age groups. The data present the mean values ± S.D. ∗: significantly different from group A by the ANOVA, p < 0.05.

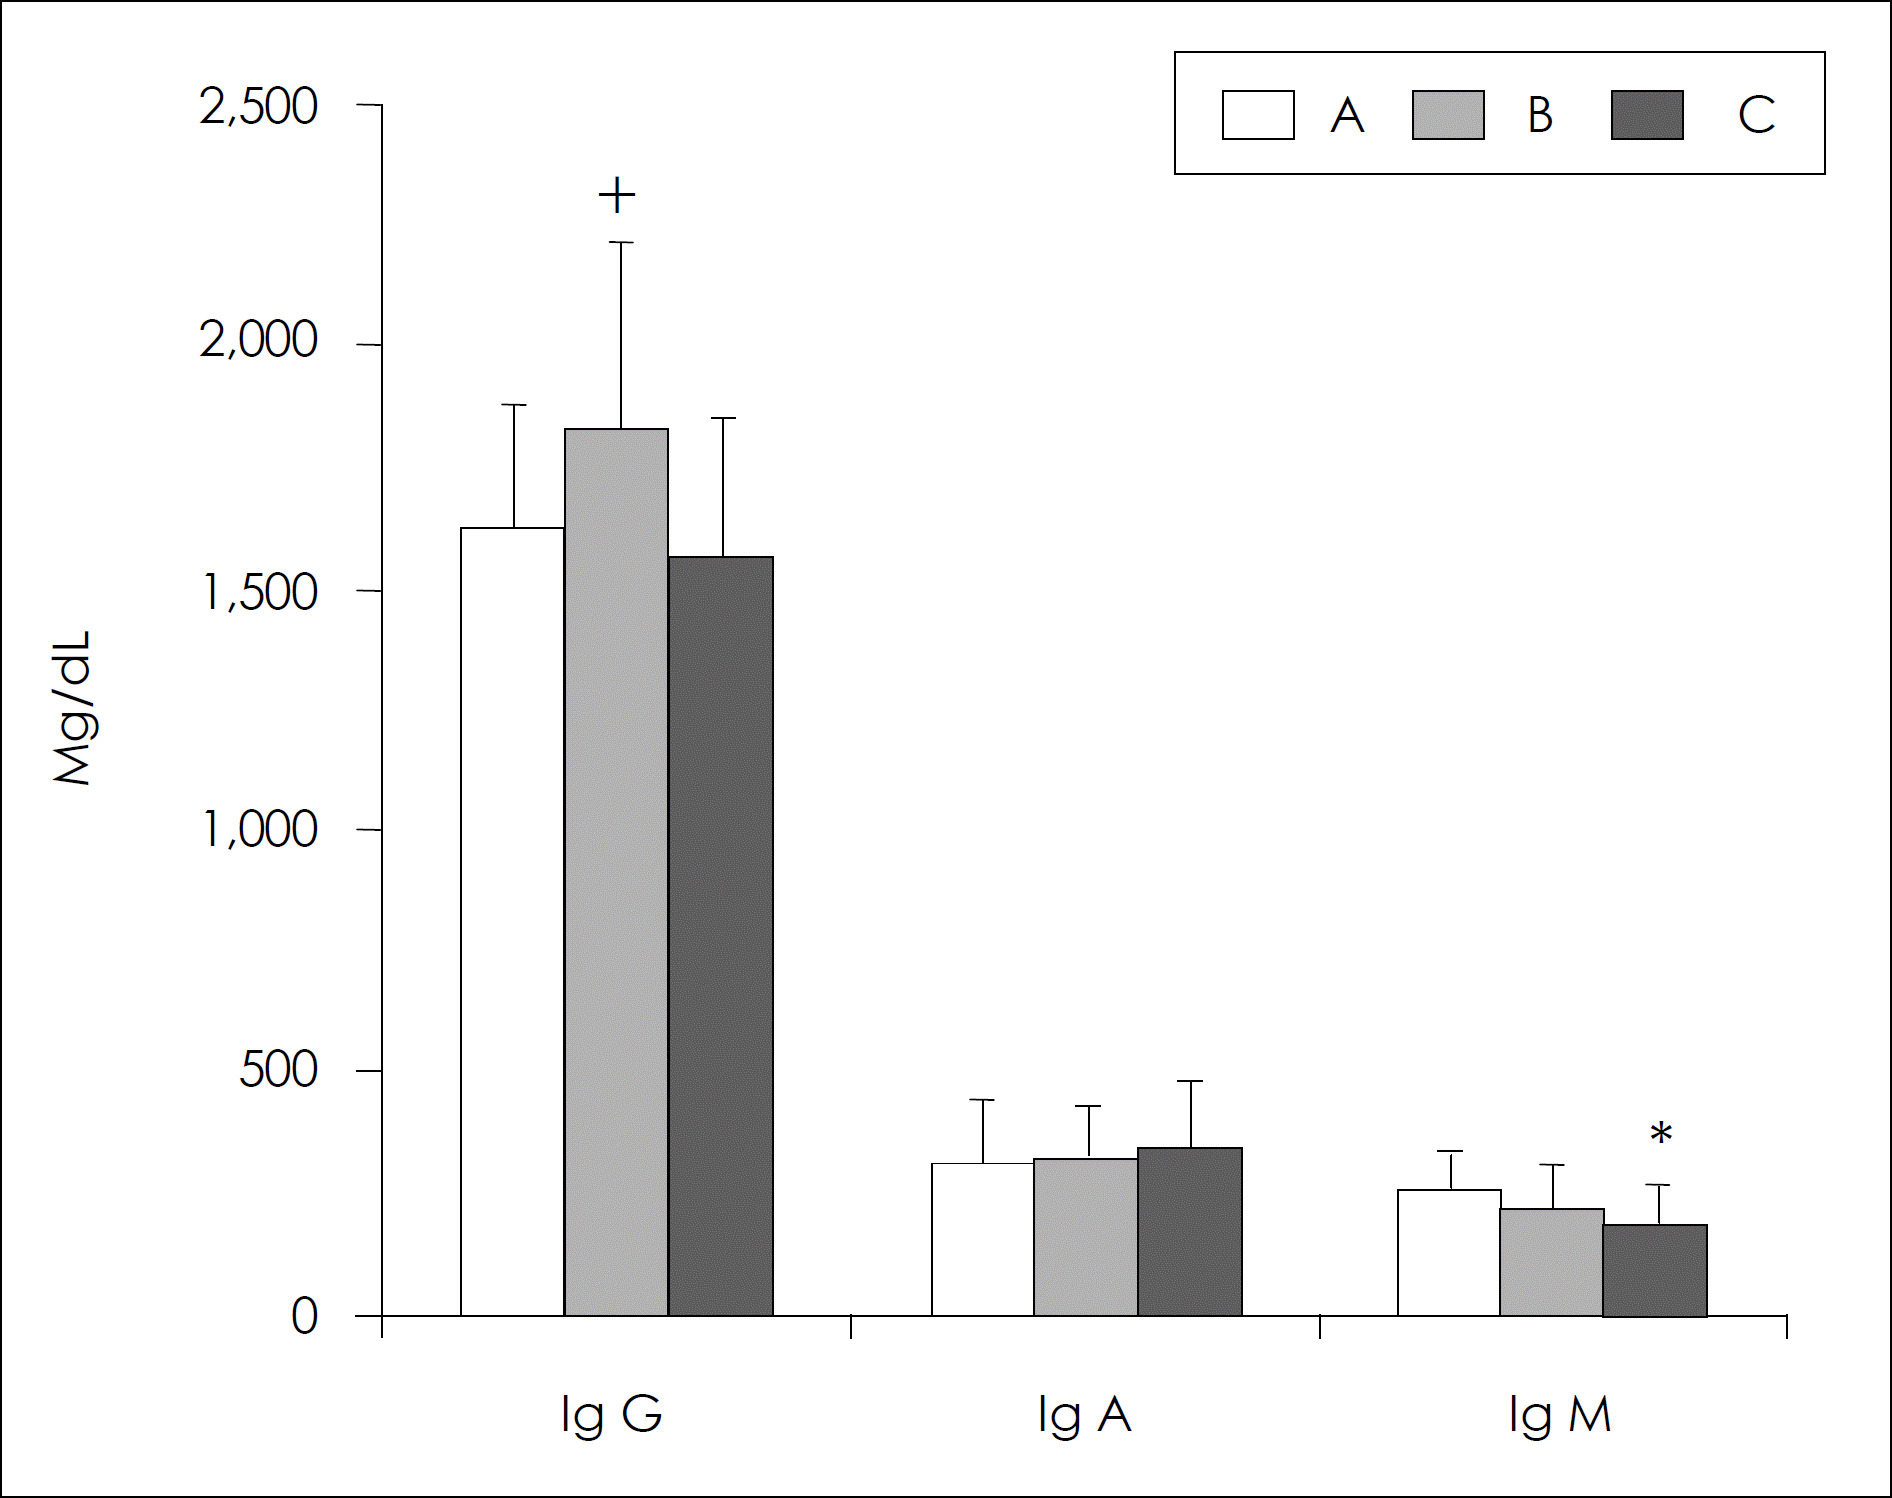
Fig. 3.
Serum immunoglobulin levels in different age groups. The data present the mean values ± S.D. ∗: significantly different from group A by the ANOVA, p < 0.05. +: significantly different from group C by the ANOVA, p < 0.05.

Table 1.
Anthropometric measurements
| A (N = 17) | B (N = 19) | C (N = 18) | |
|---|---|---|---|
| Age (years) | 023.0 ± 1.70 | 48.3 ± 4.80 | 75.3 ± 6.70 |
| Height (cm) | 161.5 ± 3.40 | 157.1 ± 4.400 | 148.4 ± 5.100 |
| Weight (kg) | 052.7 ± 5.7 | 56.5 ± 5.10 | 50.0 ± 8.00 |
| BMI (kg/m 2) | 0020.2 ± 2.0b1) | 22.8 ± 2.6 a | 22.5 ± 2.8a |
| Triceps skinfold (mm) | 020.8 ± 5.4 b | 22.8 ± 2.6 a | 22.5 ± 2.8 a |
| Triceps skinfold (mm) | 020.8 ± 5.4b | 25.4 ± 6.0a | 18.9 ± 6.4b |
| Arm circumference (cm) | 025.5 ± 2.2b | 28.7 ± 3.1a | 26.0 ± 2.5b |
| AMC (cm) | 018.9 ± 1.2b | 20.7 ± 2.5a | 020.0 ± 1.7ab |
| Body fat (%) | 024.1 ± 3.0b | 26.2 ± 3.8b | 30.9 ± 5.7a |
| LBM (kg) | 039.8 ± 4.0a | 41.6 ± 3.3a | 34.2 ± 4.5b |
| TBW(L) | 029.1 ± 3.0a | 30.4 ± 2.5a | 25.0 ± 3.3b |
Table 2.
Mean daily nutrients intake 1) from dietary food records
| Nutrients | A (N = 17) | B (N = 19) | C (N = 18) |
|---|---|---|---|
| Energy (kcal/day) | 1600.0 ± 465.5 | 1666.0 ± 484.2 | 0.1415 ± 360.2 |
| Energy (kcal/kg b.w.) | 30.3 ± 7.2 | 29.4 ± 7.8 | 29.3 ± 8.0 |
| Protein (g/day) | 055.8 ± 24.0 | 067.2 ± 26.9 | 057.4 ± 20.1 |
| (14%) 2) | (16.1%) | (16.2%) | |
| Fat (g/day) | 038.1 ± 15.6 | 031.5 ± 11.8 | 028.2 ± 14.7 |
| (21.4%) | (17.0%) | (17.9%) | |
| Carbohydrate (g/day) | 259.9 ± 72.3 | 268.2 ± 86.7 | 234.6 ± 55.5 |
| (64.9%) | (64.4%) | (66.3%) | |
| Iron (mg/day) | 10.6 ± 4.7 | 12.2 ± 5.1 | 09.4 ± 4.0 |
| (75.7%)3) | (87.1%) | (104.4%) | |
| Vitamin A (I.U) | 0002511 ± 1605 b4) | 4212.0 ± 1965 a | 003134 ± 2566 ab |
Table 3.
T cell subsets, B lymphocytes and NK-cells in cellmediated immunity
| A (N = 17) | B (N = 19) | C (N = 18) | |
|---|---|---|---|
| T lymphocytes (%) | 67.9 ± 6.5 | 67.9 ± 6.1 | 62.7 ± 12.0 |
| CD4 + (%) | 37.0 ± 8.1 | 42.1 ± 6.1 | 40.8 ± 10.5 |
| CD8 + (%) | 0031.7 ± 6.1 a1) | 26.7 ± 6.9 ab | 023.8 ± 10.8 b |
| CD4 +/CD8 + ratio | 01.25 ± 0.5b | 01.7 ± 0.5ab | 02.32 ± 1.74a |
| B lymphocytes (%) | 009.5 ± 3.1b | 10.8 ± 3.6ab | 12.3 ± 4.5a |
| NK-cell (%) | 014.9 ± 5.3 b | 15.5 ± 3.7 ab | 19.7 ± 8.9 a |
Table 4.
Correlation between anthropometric measurements and immune parameters
| 4-1) A group | |||||
|---|---|---|---|---|---|
| Skinfold thickness | Body fat (%) 1) | Lean body mass | Total body water | Body mass index | |
| Lymphocyte | -0.0177 | -0.0977 | -0.0890 | -0.0873 | -0.1673 |
| Basophil | -0.2713 | -0.1681 | -0.3743 | -0.3748 | -0.2989 |
| T lymphocyte | -0.1149 | -0.0121 | -0.3413 | -0.3364 | -0.1314 |
| CD8 + | -0.0675 | -0.0345 | -0.0388 | -0.0369 | -0.0617 |
| CD4: CD8 ratio | -0.0971 | -0.1912 | -0.0236 | -0.0216 | -0.0598 |
| Ig M | -0.2968 | -0.0508 | -0.6025∗ | -0.6018∗ | -0.5402∗ |
| 4-2) B group | |||||
| Skinfold thickness | Body fat (%) 1) | Lean body mass | Total body water | Body mass index | |
| Lymphocyte | -0.4046 | -0.5418∗ | -0.0931 | -0.0170 | -0.3606 |
| Basophil | -0.4645∗ | -0.3288 | -0.3778 | -0.3562 | -0.4831∗ |
| T lymphocyte | -0.0985 | -0.0343 | -0.4271 | -0.4560∗ | -0.1424 |
| CD8 + | -0.4453 | -0.0176 | -0.5300∗ | -0.4701∗ | -0.2247 |
| CD4: CD8 ratio | -0.4303 | -0.0241 | -0.4613∗ | -0.4061 | -0.2247 |
| Ig M | -0.4723∗ | -0.0933 | -0.1545 | -0.0704 | -0.0717 |
| 4-3) C group | |||||
| Skinfold thickness | Body fat (%) 1) | Lean body mass | Total body water | Body mass index | |
| Lymphocyte | -0.4255 | -0.2562 | -0.0535 | -0.0548 | -0.1664 |
| Basophil | -0.3147 | -0.2077 | -0.2049 | -0.2049 | -0.0163 |
| T lymphocyte | -0.2835 | -0.2400 | -0.0616 | -0.0622 | -0.1540 |
| CD8 + | -0.0151 | -0.1380 | -0.3467 | -0.3469 | -0.1665 |
| CD4: CD8 ratio | -0.0880 | -0.0564 | -0.2679 | -0.2682 | -0.0821 |
| Ig M | -0.3531 | -0.3483 | -0.0647 | -0.0685 | -0.1710 |
Table 5.
Correlation between mean daily nutrients intake and immune parameters
| 5-1) A group | ||||
|---|---|---|---|---|
| Dietary Intake | ||||
| Calorie | Carbohydrate | Fat | Fe | |
| Total WBC count | -0.2090 | -0.3336 | -0.0596 | -0.1189 |
| Eosinophil | -0.1281 | -0.1508 | -0.0874 | -0.1201 |
| Basophil | -0.1737 | -0.2032 | -0.0874 | -0.2105 |
| T lymphocyte | -0.5993∗ | -0.7301∗∗ | -0.2377 | -0.3228 |
| Ig G | -0.4986∗ | -0.3561 | -0.5418∗ | -0.2063 |
| Ig M | -0.1408 | -0.2346 | -0.1105 | -0.0325 |
| 5-2) B group | ||||
| Dietary Intake | ||||
| Calorie | Carbohydrate | Fat | Fe | |
| Total WBC count | -0.2421 | -0.0473 | -0.0805 | -0.0776 |
| Eosinophil | -0.3592 | -0.3236 | -0.4113 | -0.4977∗ |
| Basophil | -0.2990 | -0.4272 | -0.1685 | -0.5913∗∗ |
| T lymphocyte | -0.0612 | -0.0203 | -0.1964 | -0.0830 |
| Ig G | -0.1870 | -0.1169 | -0.0763 | -0.3501 |
| Ig M | -0.5385∗ | -0.5913∗∗ | -0.1231 | -0.6060∗∗ |
| 5-3) C group | ||||
| Dietary Intake | ||||
| Calorie | Carbohydrate | Fat | Fe | |
| Total WBC count | -0.3632 | -0.5604∗ | -0.1547 | -0.0228 |
| Eosinophil | -0.0918 | -0.0775 | -0.1446 | -0.0515 |
| Basophil | -0.1179 | -0.3281 | -0.1044 | -0.2625 |
| T lymphocyte | -0.2574 | -0.2336 | -0.1759 | -0.5191∗ |
| Ig G | -0.0374 | -0.0883 | -0.0114 | -0.1075 |
| Ig M | -0.0561 | -0.1012 | -0.0955 | -0.1794 |
Table 6.
Correlation between serum vitamin A or vitamin E levels and immune parameters of subjects
| A group (N = 17) | B group (N = 19) | C group (N = 18) | ||||
|---|---|---|---|---|---|---|
| Serum vitamin A | Serum vitamin E | Serum vitamin A | Serum vitamin E | Serum vitamin A | Serum vitamin E | |
| Lymphocyte | -0.0347 | -0.2929 | -0.0703 | -0.4893∗ | -0.3481 | 0.2361 |
| T lymphocyte | -0.1442 | -0.2481 | -0.0842 | -0.6084∗∗ | -0.1311 | 0.2628 |
| B lymphocyte | -0.1323 | -0.4612 | -0.1840 | -0.1193 | -0.2734 | 0.1650 |


 PDF
PDF ePub
ePub Citation
 Print
Print


 XML Download