

 PDF
PDF ePub
ePub Citation
 Print
Print


Abstract
Figures and Tables
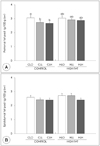 | Fig. 1Perirenal fat pad (A) and epididymal fat pad (B) in rats fed diets with different levels of dietary fat and/or leucine (see Table 1 for group description). The high fat induced animals were orally administered Leucine as separate feeding for 5 weeks with control diet or continuous high fat diet. Values are expressed as mean ± SE shown by vertical bars. Values with different letters are significantly different at α = 0.05 level by one-way ANOVA.
|
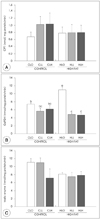 | Fig. 2Activities of carnitine palmitoyl transferase (A), glucose-6-phosphate dehydrogenase (B), and malic enzyme (C) in rats fed diets with different levels of fat and/or leucine. Values are expressed as mean ± SE shown by vertical bars. Values with different letters are significantly different at α = 0.05 level by oneway ANOVA.
|
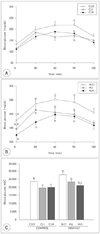 | Fig. 3Blood glucose concentrations during oral glucose tolerance test in rats fed diets with different levels of fat and/or leucine. The animals received orally administered glucose (1 g/kg bw) with or without leucin after overnight fasting for 12 h. Blood glucose levels were determined from tail blood samples at 0, 30, 60, 90, and 120 min and incremental blood glucose concentrations were integrated over a period of 2h (A: control diet with different leucine levels, B: high fat diet, C: incremental area under the curve of the glucose response). Values are expressed as mean ± SE shown by vertical bars. Values with different letters are significantly different at α = 0.05 level by one-way ANOVA.
|
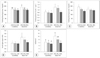 | Fig. 4Effect of leucine with or without high fat diet for 5 weeks on biochemical parameters of blood glucose. Values are expressed as mean ± SE shown by vertical bars. Values with different letters are significantly different at α = 0.05 level by oneway ANOVA. A: Fasting blood glucose (A), B: plasma insulin, C: glucagon concentrations, D: insulin/glucagon ratio, E: HOMA-IR (Fasting plasma insulin (µU/mL) × fasting blood glucose (mmol/l)/22.5).
|
Table 1
1) Control: AIN-93M diet (9.6% of energy as fat), High fat: AIN-93M diet (40% of energy as fat), CLO: AIN-93M diet (9.6% of energy as fat), CLL: AIN-93M diet (9.6% of energy as fat) + 0.6 g/kg BW Leu, CLH: AIN-93M diet (9.6% of energy as fat) + 1.2 g/kg BW Leu, HLO: AIN-93M diet (40% of energy as fat), HLL: AIN-93M diet (40% of energy as fat) + 0.6 g/kg BW Leu, HLH: AIN-93M diet (40% of energy as fat) + 1.2 g/kg BW Leu
2) Mineral mix (AIN-93M-MIX)(g/kg mixture): calcium carbonate 357.00, potassium phosphate monobasic 250.00, potassium citrate H2O 28.00, sodium chloride 74.00, potassium sulfate 46.60, magnesium oxide 24.00, ferric citrate U.S.P. 6.06, zinc carbonate 1.65, manganous carbonate 0.63, cupric carbonate 0.30, potassium iodate 0.01, sodium selenate 0.01025, ammonium paramolybdate 4H2O 0.00795, sodium metasilicate 9H2O 1.45, chromium potassium sulfate 12H2O 0.275, lithium chloride 0.0174, boric acid, 0.0815 sodium fluoride 0.0635, nickel carbonate 0.0318, ammonium vanadate 0.0066 and sucrose finely powered 209.806.
3) Vitamin mix (AIN-93-VX)(g/kg mixture): niacin 3.00, calcium pantothenate 1.60, pyridoxine HCl 0.70, thiamine HCl 0.60, riboflavin 0.60, folic acid 0.20, biotin 0.02, vitamin E acetate (500 IU/g) 15.00, vitamin B12 (0.1%) 2.50, vitamin A palmitate (500,000 IU/g) 0.80, Vitamin D3 (400,000 IU/g) 0.25, Vitamin K1/Dextrose Mix (10 mg/g) 7.50 and sucrose 967.23
![]()
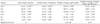
Table 2

1) See Table 1
2) Mean ± standard error (S.E)
3) Values within a column with different letters are significantly different at α = 0.05 level by Student's t test
4) Values within a column are not significant at α = 0.05 level by Student's t test
![]()
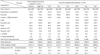
Table 3
1) See Table 1
2) Mean ± standard error (S.E)
3) Values within a column with different letters are significantly different at α = 0.05 level by Duncan's multiple range test
4) Values within a column are not significant at α = 0.05 level by Duncan's multiple range test
5) Statistical significance of experimental factors was calculated using two-way ANOVA. A: Effect of dietary fat level was significant at α = 0.05, B: Effect of leucine level was significant at α = 0.05, AB: Interaction of dietary fat and leucine level was significant at α = 0.05
![]()
 XML Download