Journal List > Korean J Nutr > v.42(3) > 1043755

Yang: The Analysis of Geriatric Nutritional Risk Index (GNRI) for Nutritional Assessment and Health Care in Elderly Women

Abstract

Nutritional assessment for the elderly can identify health status and morbidity. However, development of Nutritional Risk Index (NRI) remains limited for elderly because of difficulties in understanding physiological mechanism of elderly. This study was performed to analyze and develop Nutritional Risk Index for Korean elderly Women (Geriatric Nutritional Risk Index, GNRI). Based on literature review, factors for NRI were identified and indices were assessed by a cross-sectional survey. The survey involved Korean elderly women (≥ 60, n = 94) in Gwangju area, and sociodemographics, lifestyle characteristics, health conditions, dietary intakes based on 24h- recall, anthropometric measures (wt, ht, BMI, waist, hip, WHR, body protein, body fat, abdominal fat, and triceps skinfold thickness), and clinical biochemistry parameters (systolic blood pressure, diastolic blood pressure, cholesterol, HDL-cholesterol, triglyceride, total protein, albumin, prealbumin, hemoglobin, hematocrit, fasting blood glucose, HbA1c, ferritin, Zn, Ca, Na, K, Vit E, Vit B12, folate, C-reactive protein) were examined relation to nutritional risk index. Based on literature review and data analyses, three NRIs were categorized (NRI I, NRI II, NRI III) and used for further analysis. NRI I was related to having metabolic syndrome, NRI II was related to serum albumin and body weight, and NRI III was related to food habit and health concerns. Abdominal fat (%) of elderly was correlated with each NRIs. NRI II was correlated with nutritional deficiency and higher tendency of inflammatory response, and NRI III was correlated with nutritional status which tend to be lower on aging (protein, folate, Vit B12). NRI can serve as a useful tools in assessing health risk and nutritional status. Some modification of items in NRI and validity study are need to apply to Korean elderly.

Figures and Tables

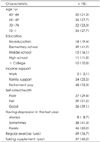
Table 1
General characteristics of the subjects
kjn-42-234-i001
Table 2
Anthropometric measures and blood pressure according to the age of elderly women (Mean ± SD)
kjn-42-234-i002

1) ANOVA 2) Different letters denote significant difference at p < 0.05 by Tukey test within the row

Table 3
Hematological status according to the age of elderly women (Mean ± SD)
kjn-42-234-i003

1) ANOVA

2) Different letters denote significant difference at p < 0.05 by Tukey test within the Row

3) Reference 22

Table 4
Daily nutrient intakes according to the age of elderly women (Mean ± SD)
kjn-42-234-i004

1) ANOVA

2) Different letters denote significant difference at p < 0.05 by Tukey test within the Row

3) Less than EER (Estimated energy requirements)

4) Less than AI (Adequate intake)

Table 5
Daily food intake according to the age of elderly women (Mean ± SD)(g)
kjn-42-234-i005

1) ANOVA

2) Different letters denote significant difference at p < 0.05 by Tukey test within the Row

Table 6
Prevalence of nutrition-related risk and mean scores based on NRIs according to the age of elderly women
kjn-42-234-i006

1) NRI I was based on having metabolic syndrome

2) NRI II (GNRI score) was calculated with the equation: Serum albumin (g/L) × 1.489 + 41.7 × present wt/usual wt (Cutoff value < 90)

3) NRI III (Dietary score, modified Mini Nutritional Assessment) was calculated by using score for change of Wt, loss of appetite, depression, stress, having pressure sores, taking medications, regular exercise, self-perception of nutrition, frequency of food groups (Cutoff value < 28)

4) %

5) Chi-square test

6) Mean ± SD

7) Different letters denote significant difference at p < 0.05 by Tukey test within the Row

8) ANOVA

Table 7
Comparison of anthropometric measures among Nutritional Risk Indices (NRIs)
kjn-42-234-i007

1) NRI I was based on having metabolic syndrome

2) NRI II (GNRI score) was calculated with the equation: Serum albumin (g/L) × 1.489 + 41.7 × present wt/usual wt (Cutoff value < 90)

3) NRI III (Dietary score, modified Mini Nutritional Assessment) was calculated by using score for change of Wt, loss of appetite, depression, stress, having pressure sores, taking medications, regular exercise, self-perception of nutrition, frequency of food groups (Cutoff value < 28)

*: T-test, p < 0.05

Table 8
Comparison of hematological status among Nutritional Risk Indices (NRIs)
kjn-42-234-i008

1) NRI I was based on having metabolic syndrome

2) NRI II (GNRI score) was calculated with the equation: Serum albumin (g/L) × 1.489 + 41.7 × present wt/usual wt (Cutoff value < 90)

3) NRI III (Dietary score, modified Mini Nutritional Assessment) was calculated by using score for change of Wt, loss of appetite, depression, stress, having pressure sores, taking medications, regular exercise, self-perception of nutrition, frequency of food groups (Cutoff value < 28)

*: T-test, p < 0.05

Table 9
Comparison of nutrient intakes among Nutritional Risk Indices (NRIs)
kjn-42-234-i009

1) NRI I was based on having metabolic syndrome

2) NRI II (GNRI score) was calculated with the equation: Serum albumin (g/L) × 1.489 + 41.7 × present wt/usual wt (Cutoff value < 90)

3) NRI III (Dietary score, modified Mini Nutritional Assessment) was calculated by using score for change of Wt, loss of appetite, depression, stress, having pressure sores, taking medications, regular exercise, self-perception of nutrition, frequency of food groups (Cutoff value < 28)

*: T-test, p < 0.05

Notes

This research was supported by grants from Korea Research Foundation.

References

1. Dwyer J. Frankler RT, Owen AL, editors. The elderly. handbook of Nutrition in the community. 1993. Mosby-Year Book;230–235.
2. Kim SK, Kang HK, Kim JH. Socio-economic factors affecting the health and nutritional status of the aged. Korean J Nutr. 2000. 33(1):86–101.
3. Yang EJ, Kim WY. New paradigm for Dietary reference intakes: American/Canadian dietary reference intakes (DRIs): Elderly. Korean J Nutr. 2004. 37(7):603–605.
4. Krunbolz HM. Lack of association between cholesterol and coronary heart disease mortality and morbidity and all-cause mortality in persons older that 70 years. JAMA. 1994. 272:1335–1342.
crossref
5. Park MY, Lee KH, Youn HS. Nutrition status of the rural elderly living in Kyungnam. Korean J Community Nutrition. 2001. 6:3S. 527–541.
6. Pakr JK, Son SM. The dietary behaviors, depression rates and nutrient intakes of the elderly females living alone. Korean J Community Nutrition. 2003. 8(5):716–725.
7. Kim YK, Lee HO, Chang L, Choue RW. A study on the food habits, nutrient intake and the disease distribution in the elderly (aged over 65 years)(I). Korean J Community Nutrition. 2002. 7(4):516–526.
8. Posner BM, Jette AM, Smith KW, Miller DR. Nutrition and health risk in the elderly: the Nutrition Screening Initiative. Am J Public Health. 1993. 83:972–978.
crossref
9. Vellas B, Guigoz Y, Garry PJ, Albarede JL. The mini Nutritional Assessment (MNA) and its use in grading the nutritional state of elderly patients. Nutrition. 1999. 15:116–122.
crossref
10. Bouillanne O, Morieneau G, Dupont C, Aussel C. Geriatric Nutritional Risk Index: a new index for evaluating at-risk elderly medical patients. Am J Clin Nutr. 2005. 82:777–783.
crossref
11. Bonnefoy M, Ayzac L, Ingenbleek Y, Bienvenu J. Usefulness of the prognostic inflammatory and nutritional index (PINI) in hospitalized elderly patients. Intern J Vitamin and Nutrition Research. 1998. 68(3):189–195.
12. Naber T, Bree A, Schermer T, Bakkeren J, Bar Brigit, Wild G, Katan MB. Specificity of indexes of malnutrition when applied to apparently healthy people: the effect of age. Am J Clin Nutr. 1997. 65:1721–1725.
crossref
13. Pablo R, Izaga A, Alday A. Assessment of nutritional status on hospital admission: Nutritional scores. Eur J Clin Nutr. 2003. 57(7):824–831.
crossref
14. Kondrup J, Allison SP, Elia M, Vella B, Plauth M. ESPEN guidelines for Nutrition Scerrning 2002. Clin Nutr. 2003. 22(4):415–421.
15. Han KH, Choi M, Park J. Nutritional risk and its related factors evaluated by the mini nutritional assessment for the elderly who are meal service participants. Korean J Nutr. 2004. 37(8):675–687.
16. Yoon JS, Lee JH. Nutrient intake, zinc status and health risk factors in elderly Korean women as evaluated by the nutrient screening initiative (NSI) checklist. Korean J Community Nutrition. 2002. 7(4):539–547.
17. Lee KW, Lee YM, Kim JH. The health and nutritional status of low-income, alone living elderly. Korean J Community Nutrition. 2000. 5(1):3–12.
18. Lee JW, Kim KE, Kim KN, Hyun TS, Park YS. Evaluation of the validity of a simple screening test developed for identifying Korean elderly at risk of undernutrition. Korean J Nutr. 2000. 33(8):864–872.
19. Omran ML, Morley JE. Assessment of protein energy malnutrition in older persons, part I: History, Examination, body composition, and screening tools. Nutrition. 2000. 16:50–63.
crossref
20. Omran ML, Morley JE. Assessment of protein energy malnutrition in older persons, part II: Laboratory evaluation. Nutrition. 2000. 16:131–140.
crossref
21. The Korean Nutrition Society. Dietary reference intakes for Koreans. 2005.
22. Green Cross Research Lab. Clinical Research Service. 2007.
23. Caterina R, Zampolli A, Turco SD, Madonna R, Massaro M. Nutritional mechanism that influence cardiovascular disease. Am J Clin Nutr. 2006. 83:suppl. 421S–426S.
24. Yang EJ, Bang HM. Nutritional status and health risks of low income elderly women in Gwangju area. Korean J Nutr. 2008. 413(4):65–76.
25. Ministry of Health and Welfare. 2005 National Health and Nutrition Survey: Overview. 2007.
26. Yang EJ, Kim WY. Nutritional Status of Korean Elderly. Korean J Gerontol. 2005. 15(1):1–10.
27. Park JK, Son SM. Anthropometric and biochemical indicators and related factors for the community dwelling elderly living alone. Korean J Community Nutrition. 2003. 8(5):726–735.
28. Kagansky N, Berner Y, Koren-Morag N, Perelman L, Knobler H, Levy S. Poor nutritional habits are predictors of poor outcome in very old hospitalize patients. Am J Clin Nutr. 2005. 82:784–791.
crossref
TOOLS
Similar articles