

 PDF
PDF ePub
ePub Citation
 Print
Print


Yuri Han, Sung-Ok Kwon, Sang-Ah Lee
Abstract
Objectives
The purpose of this study was to estimate the distribution and exposure prevalence of total carbohydrate intake and the carbohydrate-based foods such as rice, noodles, sweet potatoes, sweet drinks, milk and fruits and to characterize intake patterns among obese Korean adults.
Methods
Subjects included 137,363 adults aged 40 years or older who participated in a Health Examinees (HEXA) Study. Multiple regression analysis of data from Semi-Quantitative Food Frequency Questionnaire (SQFFQ) identified food sources of carbohydrates. Weight, height and waist circumstance (WC) were measured, and the body mass index (BMI) was calculated. Obesity was defined as BMI ≥ 25 kg/m2 and abdominal obesity as WC ≥ 90 cm and ≥ 85 cm for males and females, respectively.
Results
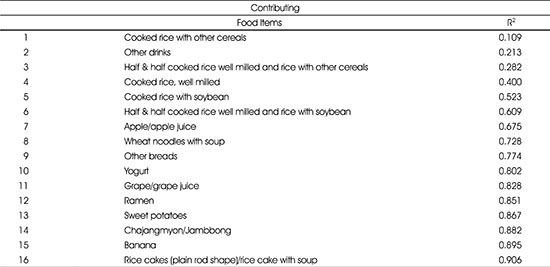
Obese adults appeared to have a higher total carbohydrate intake in the univariate analysis but had eaten less after adjustment for general and lifestyle factors, compared to normal weight adults (OR 0.78, 95% CI 0.73-0.82 for general obesity; OR 0.79, 95% CI 0.74-0.85, for abdominal obesity; P trend < 0.0001, respectively). Based on advance analysis for the food sources of carbohydrates, obese subjects had lower intake of rice (OR 0.86, 95% CI 0.68 -1.09 for general obesity; OR 0.87, 95% CI 0.67-1.13, for abdominal obesity; P trend < 0.0001, respectively) and higher intake of noodles (OR 1.21, 95% CI 1.16-1.27 for general obesity; OR 1.25, 95% CI 1.19-1.32, for abdominal obesity; P trend < 0.0001 respectively). With regard to other food sources of carbohydrates such as milk and fruits, intake was lower among obese compared to normal weight subjects.
Conclusions
In the Korean middle-aged and older obesity groups, the intake of carbohydrates and the related foods was lower than in normal weight subjects, except for noodles. We conclude that a higher intake of noodles may enhance weight-gain. Therefore, this study suggested that the guidelines should consider the types of carbohydrate sources and the amount consumed from foods in order to provide proper guidance with regard to control and prevent obesity among Korean adults.
Figures and Tables
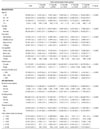
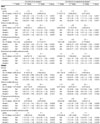
Table 1
Characteristics of the study subjects according to the quintile categories of total carbohydrate intake
![]()
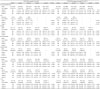
Table 2
Odds ratios and 95% confidence interval for obesity according to the distribution of total carbohydrate intake and major carbohydrate source foods
![]()
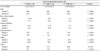
Table 4
Odds ratios and 95% confidence interval of obesity according to the noodle intake in Korean adults
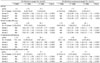
1) Obesity: BMI ≥ 25 kg/m2, Abdominal obesity: Waist Circumference M ≥ 90/F ≥ 85
2) The tertile for g/day for each noodle
3) Model 1: Crude
4) Model 2: Adjusted for age, sex, education, job, married, income
5) Model 3: Adjusted for Model 2 + drinking status, smoking status, exercise, total energy intake
![]()
References
1. Balakumar P, Maung-U K, Jagadeesh G. Prevalence and prevention of cardiovascular disease and diabetes mellitus. Pharmacol Res. 2016; 113(Pt A):600–609.
2. Flegal KM, Kit BK, Orpana H, Graubard BI. Association of all-cause mortality with overweight and obesity using standard body mass index categories: A systematic review and meta-analysis. JAMA. 2013; 309(1):71–82.
3. Carmienke S, Freitag MH, Pischon T, Schlattmann P, Fankhaenel T, Goebel H. General and abdominal obesity parameters and their combination in relation to mortality: a systematic review and meta-regression analysis. Eur J Clin Nutr. 2013; 67(6):573–585.
4. World Health Organization. GLOBAL STATUS REPORT ON NONCOMMUNICABLE DISEASES 2014 [Internet]. World Health Organization;2014. cited 2017 Apr 1. Available from: http://www.who.int/nmh/publications/ncd-status-report-2014/en/.
5. World Health Organization. Obesity and Overweight [Internet]. World Health Organization;2016. cited 2017 Apr 4. Available from: http://www.who.int/mediacentre/factsheets/fs311/en/.
6. Korea Centers for Disease Control and Prevention. Korea Health Statistics 2015. Korea Centers for Disease Control and Prevention;2015. cited 2017 Mar 31. Available from: https://knhanes.cdc.go.kr/knhanes/index.do.
7. Nguyen DM, El-Serag HB. The epidemiology of obesity. Gastroenterol Clin North Am. 2010; 39(1):1–7.
8. Mozaffarian D, Hao T, Rimm EB, Willett WC, Hu FB. Changes in diet and lifestyle and long-term weight gain in women and men. N Engl J Med. 2011; 364(25):2392–2404.
9. Fogelholm M, Anderssen S, Gunnarsdottir I, Lahti-Koski M. Dietary macronutrients and food consumption as determinants of long-term weight change in adult populations: a systematic literature review. Food Nutr Res. 2012; 56:1–45.
10. Cohen E, Cragg M, deFonseka J, Hite A, Rosenberg M, Zhou B. Statistical review of US macronutrient consumption data, 1965-2011: Americans have been following dietary guidelines, coincident with the rise in obesity. Nutrition. 2015; 31(5):727–732.
11. Murakami K, McCaffrey TA, Livingstone MB. Associations of dietary glycaemic index and glycaemic load with food and nutrient intake and general and central obesity in British adults. Br J Nutr. 2013; 110(11):2047–2057.
12. Aller EE, Abete I, Astrup A, Martinez JA, van Baak MA. Starches, sugars and obesity. Nutrients. 2011; 3(3):341–369.
13. Youn S, Woo HD, Cho YA, Shin A, Chang N, Kim J. Association between dietary carbohydrate, glycemic index, glycemic load, and the prevalence of obesity in Korean men and women. Nutr Res. 2012; 32(3):153–159.
14. Ahn Y, Kwon E, Shim JE, Park MK, Joo Y, Kimm K. Validation and reproducibility of food frequency questionnaire for Korean genome epidemiologic study. Eur J Clin Nutr. 2007; 61(12):1435–1441.
15. Kim JH, Lee JE, Jung IK. Dietary pattern classifications and the association with general obesity and abdominal obesity in Korean women. J Acad Nutr Diet. 2012; 112(10):1550–1559.
16. Serra-Majem L, Bautista-Castaño I. Relationship between bread and obesity. Br J Nutr. 2015; 113(S2):S29–S35.
17. McKeown NM, Troy LM, Jacques PF, Hoffmann U, O'Donnell CJ, Fox CS. Whole-and refined-grain intakes are differentially associated with abdominal visceral and subcutaneous adiposity in healthy adults: the Framingham Heart Study. Am J Clin Nutr. 2010; 92(5):1165–1171.
18. Pauline KB, Rimm EB. Whole grain consumption and weight gain: a review of the epidemiological evidence, potential mechanisms and opportunities for future research. Proc Nutr Soc. 2003; 62(1):25–29.
19. Atkinson FS, Foster-Powell K, Brand-Miller JC. International tables of glycemic index and glycemic load values: 2008. Diabetes Care. 2008; 31(12):2281–2283.
20. Radhika G, Van Dam RM, Sudha V, Ganesan A, Mohan V. Refined grain consumption and the metabolic syndrome in urban Asian Indians (Chennai Urban Rural Epidemiology Study 57). Metabolism. 2009; 58(5):675–681.
21. Malik VS, Popkin BM, Bray GA, Després JP, Hu FB. Sugar-sweetened beverages, obesity, type 2 diabetes mellitus, and cardiovascular disease risk. Circulation. 2010; 121(11):1356–1364.
22. Zuñiga YL, Rebello SA, Oi PL, Zheng H, Lee J, Tai ES. Rice and noodle consumption is associated with insulin resistance and hyperglycaemia in an Asian population. Br J Nutr. 2014; 111(6):1118–1128.
23. Cheung BM. The cardiovascular continuum in Asia: a new paradigm for the metabolic syndrome. J Cardiovasc Pharmacol. 2005; 46(2):125–129.
24. Pereira MA. Sugar-sweetened and artificially-sweetened beverages in relation to obesity risk. Adv Nutr. 2014; 5(6):797–808.
25. Ha K, Chung S, Lee HS, Kim CI, Joung H, Paik HY. Association of dietary sugars and sugar-sweetened beverage intake with obesity in Korean children and adolescents. Nutrients. 2016; 8(1):31.
26. Joo NS, Yang SW, Park SJ, Choi SJ, Song BC, Yeum KJ. Milk consumption and Framingham risk score: Analysis of the Korea National Health and Nutrition Examination Survey data (2008-2011). Yonsei Med J. 2016; 57(1):197–202.
27. Wang W, Wu Y, Zhang D. Association of dairy products consumption with risk of obesity in children and adults: a meta-analysis of mainly cross-sectional studies. Ann Epidemiol. 2016; 26(12):870–882.
28. Bertoia ML, Mukamal KJ, Cahill LE, Hou T, Ludwig DS, Mozaffarian D. Changes in intake of fruits and vegetables and weight change in United States men and women followed for up to 24 years: Analysis from three prospective cohort studies. PLoS Med. 2015; 12(9):e1001878.
29. Rizzoli R, Bischoff-Ferrari H, Dawson-Hughes B, Weaver C. Nutrition and bone health in women after the menopause. Womens Health (Lond). 2014; 10(6):599–608.
 XML Download