Abstract
Objectives
The purpose of the study was to develop a dietary fiber composition table (DFCT) and to assess dietary fiber intakes in Korea National Health and Nutrition Examination Survey (KNHANES).
Methods
The DFCT was developed by compiling the food composition tables published by the agencies of Korea, United States, or Japan. When there was no available data from the same species or status (dried, boiled, etc.) of food, the values were imputed by estimating from the same species with different status or substituting familiar species in biosystematic grouping. Using KNHANES VI-2 (2014) microdata and DFCT, intake of dietary fiber of Koreans was estimated.
Results
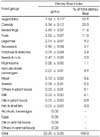
Among the 5,126 food items of DFCT, the proportion of items of which dietary fiber contents were taken from the analytical values of the same foods was 40.9%. The data from the domestic food composition tables was 37.5%, and the data from the foreign tables was 49.6%. The rest was assumed as zero, or estimated with recipe database and nutrition labeling. Mean daily intake of dietary fiber was 23.2 g, and mean intake per 1,000 kcal was 10.7 g in men and 12.6 g in women. The mean percentage of dietary fiber intake compared to adequate intake was higher than 100%. The major food groups contributing to dietary fiber intakes were vegetables and cereals, and the percent contribution were 32.9% and 23.0% of total dietary fiber intakes, respectively.
Figures and Tables
 | Fig. 1Process of the development of the dietary fiber composition table. KFCT: Food Composition Table, Korea [2], CCMP: Chemical Composition of Marine Products, Korea [8], RMCT: Restaurant Meal Composition Table, Korea [9], SR: Standard Reference, USA [10], JSTFC: Standard Tables of Food Composition, Japan [11]. |
Table 1
The characteristics of the databases used for establishing a dietary fiber composition table (DFCT) in this study

References
1. Westenbrink S, Brunt K, Kamp JW. Dietary fibre: challenges in production and use of food composition data. Food Chem. 2013; 140(3):562–567.
2. National Institute of Agricultural Sciences. Food composition table. 8th revision. Suwon: National Institute of Agricultural Sciences;2011.
3. Kweon SH, Kim YN, Jang MJ, Kim YJ, Kim KR, Choi SH. Data resource profile: the Korea National Health and Nutrition Examination Survey (KNHANES). Int J Epidemiol. 2014; 43(1):69–77.
4. Ministry of Health and Welfare, Korea Centers for Disease Control and Prevention. Korea Health Statistics 2014: Korea National Health and Nutrition Examination Survey (KNHANES VI-2). Sejong: Ministry of Health and Welfare;2015.
5. Yu KH, Chung CE, Ly SY. Analysis of dietary fiber intake in the Korean adult population using 2001 Korean National Health and Nutrition Survey data and newly established dietary fiber database. Korean J Nutr. 2008; 41(1):100–110.
6. Korea Health Industry Development Institute. Development of nutrient database: 5 Dietary fiber composition of foods. Seoul: Korea Health Industry Development Institute;2005. p. 5–181.
7. Baek YJ, Kweon SH, Oh KW. Development of fatty acid composition table and intakes of fatty acids in Korea National Health and Nutrition Examination Survey (KNHANES). Public Health Wkly Rep. 2015; 8(4):75–81.
8. National Fisheries Research and Development Institute. Chemical composition of marine products. 2nd ed. Busan: National Fisheries Research and Development Institute;2009.
9. Ministry of Food and Drug Safety. Restaurant meal composition table. Cheongju: Ministry of Food and Drug Safety;2012-2015.
10. United States Department of Agriculture. USDA National nutrient database for standard reference 28 [internet]. United States Department of Agriculture;2015. cited 2016 Feb 3. Available from: http://www.ars.usda.gov/.
11. Ministry of Education, Culture, Sports, Science and Technology. Standard tables of food composition in Japan - 2015 - (Seventh Revised Version) [internet]. Ministry of Education, Culture, Sports, Science and Technology;2015. cited 2016 Feb 3. Available from: http://www.MEXT.go.jp/.
12. Ministry of Health and Welfare. Dietary reference intakes for Koreans 2015. Sejong: Ministry of Health and Welfare;2015. p. 2–23. p. 184–211.
13. Korea Centers for Disease Control and Prevention. The Sixth Korea National Health and Nutrition Examination Survey (KNHANES VI-2) Microdata user guide. Cheongju: Korea Centers for Disease Control and Prevention;2015.
14. FAO/INFOODS. FAO/INFOODS Guidelines for checking food composition data prior to the publication of a user table. database-version 1.0. Rome: FAO;2012. p. 1–40.
15. Lee HJ, Kim YA, Lee HS. Annual changes in the estimated dietary fiber intake of Korean during 1991~2001. Korean J Nutr. 2006; 39(6):549–559.
16. United States Department of Agriculture. What we eat in America, NHANES 2011-2012 [Internet]. United States Department of Agriculture;2015. cited 2016 February 20. Available from: http://www.ars.usda.gov/.
17. Ministry of Health, Labour and Welfare. National Health and Nutrition Survey results: Nutritional Intake Status Survey [internet]. Ministry of Health, Labour and Welfare;2015. cited 2016 Feb 20. Available from: http://www.mhlw.go.jp/.
18. Sardinha AN, Canella DS, Martins AP, Claro RM, Levy RB. Dietary sources of fiber intake in Brazil. Appetite. 2014; 79:134–138.
19. Fukuda S, Saito H, Nakaji S, Yamada M, Ebine N, Tsushima E. Pattern of dietary fiber intake among the Japanese general population. Eur J Clin Nutr. 2007; 61(1):99–103.


 PDF
PDF ePub
ePub Citation
 Print
Print


 XML Download