

 PDF
PDF ePub
ePub Citation
 Print
Print


Abstract
Objectives
Methods
Results
Conclusions
Figures and Tables
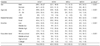
Table 1
General characteristics of the study subjects by the dietary carbohydrate energy ratio and the frequency of vegetable intake
![]()
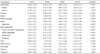
Table 2
Anthropometric, blood pressure, and blood biochemical indices of the study subjects by carbohydrate energy ratio and the frequency of vegetable intake1)
1) Adjusted for sex, age, residential area, income, education level, and energy intake
2) MCLV: Moderate carbohydrate·low vegetables, MCHV: Moderate carbohydrate·high vegetables
HCLV: high carbohydrate·low vegetables, HCHV: high carbohydrate·high vegetables
3) Calculated by Complex Samples General Linear Model ANOVA
4) Mean±SE
![]()
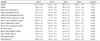
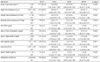
Table 3
Daily energy and nutrient intakes of the study subjects by carbohydrate energy ratio and the frequency of vegetable intake1)
1) Adjusted for sex, age, residential area, income, education level, and energy intake
2) MCLV: Moderate carbohydrate·low vegetables, MCHV: Moderate carbohydrate·high vegetables
HCLV: high carbohydrate·low vegetables, HCHV: high carbohydrate·high vegetables
3) Calculated by Complex Samples General Linear Model ANOVA 4) Mean±SE
†: Adjusted not for energy intake
‡: macronutrient energy ratio
![]()
Table 4
Nutrient adequacy ratio (NAR) and mean adequacy ratio (MAR) of the study subjects by the carbohydrate energy ratio and the frequency of vegetable intake1)
1) Adjusted for sex, age, residential area, income, education level, and energy intake
2) MCLV: Moderate carbohydrate·low vegetables, MCHV: Moderate carbohydrate·high vegetables
HCLV: high carbohydrate·low vegetables, HCHV: high carbohydrate·high vegetables
3) Calculated by Complex Samples General Linear Model ANOVA
4) Mean±SE
![]()
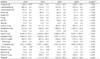
Table 5
Daily food item consumption frequency (times/day) of the study subjects by carbohydrate energy ratio and the frequency of vegetable intake1)
1) Adjusted for sex, age, residential area, income, and education level
2) MCLV: Moderate carbohydrate·low vegetables, MCHV: Moderate carbohydrate·high vegetables
HCLV: high carbohydrate·low vegetables, HCHV: high carbohydrate·high vegetables
3) Calculated by Complex Samples General Linear Model ANOVA
4) Mean±SE
![]()
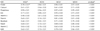
Table 6
The odds ratio of chronic disease risk in the study population by carbohydrate energy ratio and the frequency of intake of vegetables1)
1) Adjusted for sex, age, residential area, income, education level, and energy intake
2) MCLV: Moderate carbohydrate·low vegetables, MCHV: Moderate carbohydrate·high vegetables
HCLV: high carbohydrate·low vegetables, HCHV: high carbohydrate·high vegetables
3) Calculated by Complex Samples Logistic Regression
4) N (%), 5) 95% confidence interval of Odds ratio, 6) Cut off point for male, 7) Cut off point for female
![]()
 XML Download