

 PDF
PDF ePub
ePub Citation
 Print
Print


Abstract
Objectives
This study examined the impact of perceived volume on satiety using normal rice bowl, diet rice bowl and small rice bowl.
Methods
Thirty-six normal weight college female students participated in this study once a week for 3 weeks. Three hundred grams of fried rice in a normal rice bowl (1st week), 300 g of fried rice in a diet rice bowl (2nd week), and 300 g of fried rice in small rice bowl (3rd week) were served to the same participants over three consecutive weeks. After each lunch, the consumption volume of fried rice and the satiety rate were measured.
Results
The consumption volume of fried rice was 248 g (414.5 kcal) with a normal rice bowl, 254 g (429.8 kcal) with a diet bowl, and 270 g (456.8 kcal) with a small rice bowl. Results showed that the subjects who were eating from the small rice bowl ate more fried rice (p < 0.05) than eating from the normal rice bowl and diet rice bowl. However, the satiety rate of fried rice in a diet rice bowl was significantly higher than that of normal rice bowl and small rice bowl (p < 0.05). The five point scale of perceived volume on fried rice served normal rice bowl, diet rice bowl and small rice bowl were 2.4, 4.0 and 2.1.
Figures and Tables
Fig. 1
Pictures of general rice bowl, diet rice bowl and small rice bowl.
(A): side surface of rice bowls, (B): front surface of rice bowls, (C): back surface of rice bowls, (D): front surface of rice bowls containing 300 g Kimchi fried rice.
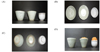
Fig. 2
Visually perceived quantity of food served in general rice bowl, diet rice bowl and small rice bowl. Values are Mean ± SD for 36 subjects. Values were analyzed with an ANOVA followed by Bonferroni-adjusted post hoc test. Different letters indicate significant differences (p < 0.05) among bowls.
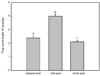
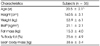
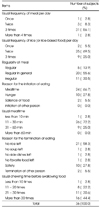
Table 4
Energy intake of Kimchi fried rice provided by general rice bowl, diet rice bowl and small rice bowl

Values are Mean ± SD for 36 subjects. Values were analyzed with an ANOVA followed by Bonferroni-adjusted post hoc test. Different letters indicate significant differences (p < 0.05) among bowls
1) General rice bowl vs. Diet rice bowl, p = 0.212
2) Diet rice bowl vs. Small rice bowl, p = 0.041
3) General rice bow vs. Small rice bowl, p = 0.048

References
1. Barkeling B, Linné Y, Melin E, Rooth P. Vision and eating behavior in obese subjects. Obes Res. 2003; 11(1):130–134.
2. Brehm BJ, Seeley RJ, Daniels SR, D'Alessio DA. A randomized trial comparing a very low carbohydrate diet and a calorie-restricted low fat diet on body weight and cardiovascular risk factors in healthy women. J Clin Endocrinology Metab. 2003; 88(4):1617–1623.
3. Chang UJ, Jung EY, Hong IS. The effect of the reduced portion size by using a diet rice bowl on food consumption and satiety rate. Korean J Community Nutr. 2007; 12(5):639–645.
4. Chang UJ, Jung EY, Suh HJ, Kim JM, Hong IS. The effect of the consumption monitoring inaccuracy by vision on Kimbab intake and satiety rate. Korean J Community Nutr. 2008; 13(2):237–243.
5. Chang VW, Christakis NA. Medical modelling of obesity: a transition from action to experience in a 20th century American medical textbook. Soc Health Illn. 2002; 24(2):151–177.
6. Cutler DM, Glaeser EL, Shapiro JM. Why have Americans become more obese? J Econ Perspect. 2003; 17(3):93–118.
7. Dansinger ML, Gleason JA, Griffith JL, Selker HP, Schaefer EJ. Comparison of the Atkins, Ornish, Weight Watchers, and Zone Diets for weight loss and heart disease risk reduction: A Randomized Trial. JAMA. 2005; 293(1):43–53.
8. de Castro JM. The time of day of food intake influences overall intake in humans. J Nutr. 2004; 134(1):104–111.
9. Gardner CD, Kiazand A, Alhassan S, Kim S, Stafford RS, Balise RR, Kraemer HC, King AC. Comparison of the Atkins, Zone, Ornish, and LEARN Diets for change in weight and related risk factors among overweight premenopausal women: The A TO Z Weight Loss Study: A Randomized Trial. JAMA. 2007; 297(9):969–977.
10. Hamburger K, Hansen T, Gegenfurtner KR. Geometric-optical illusions at isoluminance. Vision Res. 2007; 47(26):3276–3285.
11. Jung EY, Hong YH, Kwon HJ, Eum YK, Chang UJ. Effect of Visual Perception on Food Consumption and Satiety LevelsUsing a Modified Soup Bowl. J Korean Diet Assoc. 2010; 16(3):270–278.
12. Kim DH. The effects of health exercise program on cardiovascular function and blood lipids in middle aged woman. J Sports Med. 2001; 1(1):15–20.
13. Krassner HA, Brownell KD, Stunkard AJ. Cleaning the plate: food left over by overweight and normal weight persons. Behav Res Ther. 1979; 17(2):155–156.
14. Ledikwe JH, Ello-Martin JA, Rolls BJ. Portion Sizes and the Obesity Epidemic. J Nutr. 2005; 135(4):905–909.
15. Linne Y, Barkeling B, Rossner S, Rooth P. Vision and eating behavior. Obes Res. 2002; 10(2):92–95.
16. Lawless HT, Bender S, Oman C, Pelletier C. Gender, age, vessel size, cup vs. straw sipping, and sequence effects on sip volume. Dysphagia. 2003; 18(3):196–202.
17. Ministry of Health & Welfare, Korea Centers for Disease Control & Prevention. Korea Health Statistics 2011 : Korea National Health and Nutrition Examination Survey (KNHANES V-2). Cheongwon: 2012.
18. Raghubir P, Krishna A. Vital dimensions in volume perception: Can the eye fool the stomach. J Mark Res. 1999; 36(3):313–326.
19. Rodin J, McAvay G. Determinants of change in perceived health in a longitudinal study of older adults. J Gerontol. 1992; 47(6):P373–P384.
20. Rolls BJ, Ros LS, Kral TV, Meengs JS, Wall DE. Increasing the portion size of a packaged snack increase energy intake in men and women. Appetite. 2004; 42(1):63–69.
21. Sadoul BC, Schuring EA, Symersky T, Mela DJ, Masclee AA, Peters HP. Measuring satiety with pictures compared to visual analogue scales. An exploratory study. Appetite. 2012; 58(1):414–417.
22. Wansink B. Can package size accelerate usage volume. J Mark. 1996; 60(3):1–14.
23. Wansink B. Environment factors that increase the food intake and consmption volumn of unknowing consumers. Annu Rev Nutr. 2004; 24:455–479.
24. Wansink B. Mindless eating: why we eat more than we think. Am J Clin Nutr. 2006; 87(3):795.
25. Wansink B, Cheney MM. Super bowls: serving bowl size and food consumption. JAMA. 2005; 293(14):1727–1728.
26. Wansink B, Painter JE, Lee YK. The office candy dish: proximity's influence on estimated and actual consumption. Int J Obes (Lond). 2006; 30(5):871–875.
27. Wansink B, Painter JE, North J. Bottomless bowls: why visual cues of portion size may influence intake. Obes Res. 2005; 13(1):93–100.
28. Wansink B, Van Ittersum K. Why our eyes are bigger than our stomach: the del Bouf illusion and food intake. Ithaca, New York: Department of Applied Economics and Management, Cornell University;2006. Working paper.
29. Wansink B, Van Ittersum K, Painter JE. Ice cream illusions bowls, spoons, and self-served portion sizes. Am J Prev Med. 2006; 31(3):240–243.
30. Wansink B, Van Ittersum K. Do children really prefer large portions? Visual illusions bias their estimates and intake. J Am Diet Assoc. 2007; 107(7):1107–1110.
31. Young LR, Nestle M. The contribution of expanding portionsizes to the us obesity epidemic. Am J Public Health. 2002; 92(2):246–249.
 XML Download