

 PDF
PDF ePub
ePub Citation
 Print
Print


Abstract
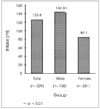
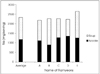
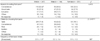
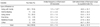
High intakes of sodium may increase the risk of hypertension or cardiovascular diseases. According to the 2010 Korea National Health and Nutrition Survey, the average intake of sodium was 4,878 mg/day with salt, kimchi, soy sauce, fermented soybean paste and Ramyeon being the five main sources of sodium. In order to identify solutions to reduce the intake of sodium, we investigated the intake patterns and eating behaviors of Ramyeon among 347 college students (male 146, female 201) using survey questionnaires. The average age of study subjects was 23.7 years for males and 20.5 years for females. The average Body Mass Index (kg/m2) was 21.9 for males and 20.1 for females. The average frequency of Ramyeon intake was 2.0 times/week. The main reason for eating Ramyeon was convenience (56%), followed by good taste (27%), low price (11%) and other reasons (9%). The criteria for choosing Ramyeon were taste (72%), convenience (14%), price (7%), nutrition (1%), and the other factors (2%). Males' average intake of Ramyeon soup (61%) was higher than that of the females (36%). The estimated intake of Ramyeon soup by survey showed a positive correlation with the measured intake of Ramyeon soup. Sodium contents of Ramyeon were measured separately for the noodles and the soup, which were 1,185 mg/serving and 1,148 mg/serving each. Therefore, the amount of sodium intake can be reduced if students eat less Ramyeon soup. Also, we observed that dietary behaviors and soup intakes of Ramyeon between the sexes were different. Appropriate nutritional education for proper eating habits may help decrease the intake of sodium.
Figures and Tables


References
1. Kim SK, Lee AR. Survey on consumption pattern of Ramyon in Seoul area. Korean J Dietary Culture. 1989; 4(4):395–404.
2. Korea Food and Drug Administration. Korean food standard codex. 2010. cited 2010 September 1. Available from http://www.kfda.go.kr.
3. Korea Health Industry Development Institute. In-depth analysis on the 3rd (2005) Korea health and nutrition examination survey-nutrition survey-. 2007a. cited 2013 February 28. Available from http://www.khidi.or.kr.
4. Korea Health Industry Development Institute. Development of food and nutrient database -Food portion/weight database-. 2007b. cited 2013 March 28. Available from http://www.khidi.or.kr.
5. Korean Nutrition Society. Dietary reference intakes for Koreans 2010. 2010.
6. Korean Society for Study of Obesity. Management of obesity 2012. Seoul: 2012. p. 17–22.
7. Korean Society of Community Nutrition. Questionnaires for dietary survey. 2000.
8. Lee JS, Km J, Hong KH, Jang YA, Park SH, Sohn YA, Chung HR. A comparison of food and nutrient intakes between instant noodle consumers and non-consumers among Korean children and adolescents. Korean J Nutr. 2009; 42(8):723–731.
9. Lee JW, Lee YH. Frequency of instant noodle (Ramyeon) intake and food value recognition, and their relationship to blood lipid levels of male adolescents in rural area. Korean J Community Nutr. 2003; 8(4):485–494.
10. Lee YN, Choi H. A study on the relationship between body mass index and the food habits of college students. Korean J Diet Cult. 1994; 9(1):1–10.
11. Lottemart. Food labels. 2013. cited 2013 April 29. Available from http://www.lottemart.com.
12. Ministry of Health and Welfare. Korea National Health and Nutrition Examination Survey (KNHANES V-1). Korea Health Statistics 2010. Korea Centers for Disease Control & Prevention;2011.
13. National Academy of Agricultural Science. Standard food composition table 8th revision. 2011. cited 2013 March 28. Available from http://koreanfood.rda.go.kr.
14. Nielsen Company. Nielsen market information diegest. 2013. cited 2013 Feb 28. Available from http://kr.nielsen.com.
15. World Health Organization, Food and Agriculture Organization of the United Nations. Diet, nutrition and the prevention of chronic diseases. Geneva: World Health Organization;2003.
 XML Download