

 PDF
PDF ePub
ePub Citation
 Print
Print


Abstract
Figures and Tables
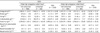
Table 1
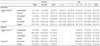
1) The estimated percent of population (standard error)
2) Korea National Health and Nutrition Examination Survey
3) 2007 Korean National Growth Charts. Underweight: < 5 percentile, Normal: 5 - 85 percentile, Overweight: 85 - 95 percentile, Obesity: ≥ 95 percentile or ≥ BMI 25
4) Criteria of weight status; underweight and normal → not obese; overweight and obese → obese
5) Korea Youth Risk Behavior Web-based Survey
*: p < 0.05, **: p < 0.01, ***: p < 0.001 (gender difference)
#: p < 0.05, ##: p < 0.01, ###: p < 0.001 (age difference)
^: p < 0.05 (year difference in 16 - 18y)
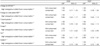
Table 2
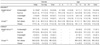
1) The estimated percent of population (standard error)
2) Korea National Health and Nutrition Examination Survey
3) 2007 Korean National Growth Charts. Underweight: < 5 percentile, Normal: 5 - 85 percentile, Overweight: 85 - 95 percentile, Obesity: ≥ 95 percentile or ≥ BMI 25
4) Criteria of weight status; underweight and normal → not obese; overweight and obese → obese
5) Korea Youth Risk Behavior Web-based Survey
#: p < 0.05, ##: p < 0.01, ###: p < 0.001 (age difference)
^: p < 0.05 (Year difference)
Table 3
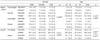
1) The estimated percent of population (standard error)
2) 2007 Korean National Growth Charts. Underweight: < 5 percentile, Normal: 5 - 85 percentile, Overweight: 85 - 95 percentile, Obesity: ≥ 95 percentile or ≥ BMI 25
3) Korea National Health and Nutrition Examination Survey
4) Korea Youth Risk Behavior Web-based Survey
5) Gender or age difference of KNHANES
6) Gender or age difference of KYRBWS
7) Year difference of KNHANES 16 - 18y
8) Criteria of weight status; underweight and normal → not obese; overweight and obese → obese
Table 4
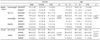
1) The estimated percent of population (standard error)
2) 2007 Korean National Growth Charts. Underweight: < 5 percentile, Normal: 5 - 85 percentile, Overweight: 85 - 95 percentile, Obesity: ≥ 95 percentile or ≥ BMI 25
3) Korea National Health and Nutrition Examination Survey
4) Korea Youth Risk Behavior Web-based Survey
5) Gender or age difference of KNHANES
6) Gender or age difference of KYRBWS
7) Year difference of KNHANES 16-18y
8) Criteria of weight status; underweight and normal → not obese; overweight, and obese → obese
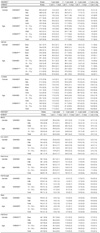
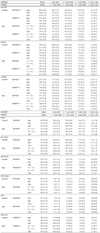
Table 7
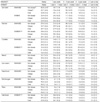
Table 8
1) Korea National Health and Nutrition Examination Survey
2) Korea Youth Risk Behavior Web-based Survey
3) 2007 Korean National Growth Charts. Not obese: < 85 percentile, Obese: ≥ 85 percentile or ≥ BMI 25
4) The estimated percent of population (standard error)
*: p < 0.05, **: p < 0.01, ***: p < 0.001
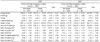
Table 9
Values are Mean ± SE
1) High energy/low nutrient foods were determined by the High energy/low nutrient food list from Korea Food & Drug Administration.
2) Percentage energy from carbohydrate compared to total energy intake per day
3) Percentage energy from protein compared to the total energy intake per day
4) Percentage energy from fat compared to the total energy intake per day
**: p < 0.01, ***: p < 0.001 intake group difference 2008
^^: p < 0.01, ^^^: p < 0.001 intake group difference 2009
#: p < 0.05 year difference in total
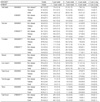
Table 10
1) Covariates: Gender, age, weight, quartile of income
2) OR: Odd Ratio Reference: Sufficiency Criteria of energy, carbohydrate, protein, fat and sodium
3) Meeting 75% - 125% of the Estimated Energy Requirement (EER) reference for gender and age in the Dietary Reference Intake for Koreans
4) High energy/low nutrient foods were determined by the High energy/low nutrient food list from Korea Food & Drug Administration
5) Meeting 75% - 125% of the individually calculated Estimated Energy Requirement (EER) using the formulas in the Dietary Reference Intake for Koreans
6) Intake adequacy was determined by meeting the Acceptable Macronutrient Distribution Ranges (AMDR) for age. Carbohydrate 55 - 70%, Protein 7 - 20%, Fat 2y: 20 - 35%, 3 - 18 y: 15 - 30%
7) Intake adequacy was determined by consuming less than the Standard of Target nutrient intake
Table 11
Values are Mean ± SE
1) High energy/low nutrient foods were determined by the High energy/low nutrient food list from Korea Food & Drug Administration
2) 2007 Korean National Growth Charts. Not obese: < 85 percentile, Obese: ≥ 85 percentile or ≥ BMI 25
3) Energy intake from high energy/low nutrient food as percentage of the total energy consumed per day
4) Protein intake from high energy/low nutrient food as percentage of the total protein consumed per day
5) Fat intake from high energy/low nutrient food as percentage of the total fat consumed per day
6) Carbohydrate intake from high energy/low nutrient food as a percentage of the total carbohydrate consumed per day
7) Sodium intake from high energy/low nutrient food as a percentage of the total carbohydrate consumed per day
8) Amount of intake from high energy/low nutrient food as a percentage of the total amount of food consumed per day
*: p < 0.05 (year difference in the obese group)
 XML Download