

 PDF
PDF ePub
ePub Citation
 Print
Print


INTRODUCTION
Natural killer T (NKT) cells express both natural killer receptors and semi-invariant T-cell receptors (TCRs). These cells recognize glycolipids presented by CD1d, a MHC class I-like protein expressed by antigen presenting cells, and express limited αβT cell receptors (TCRs) (1). Upon activation of NKT cells through TCR ligation, NKT cells produce a large amount of various cytokines such as interferon (IFN)-γ, interleukin (IL)-4, IL-10 and IL-13, which contribute to bridging innate and adaptive immune responses (2,3). NKT cells are heterogeneous in terms of TCR expression pattern and classified into invariant type I NKT cells expressing a specific Valpha chain of TCR (Vα14-Jα18 in mice and Vα24-JαQ in humans) and type II NKT cells that express more diverse TCR (4). Functionally, iNKT cells are activated upon stimulation with alpha-galactosylceramide (α-GalCer). Many studies have been focusing on the functions of iNKT cells rather than type II NKT cells. Therefore, iNKT cells have been implicated in in various immune diseases in autoimmunity transplantation, infection, and tumor surveillance (5-8). The iNKT cells express both TCRs and natural killer receptors on cell surface. Therefore, iNKT cells share characters of NK and T cells in terms of functions and expression patterns of various markers. Nevertheless, gene expression pattern of iNKT cells and conventional T cells has not been well characterized so far. To address this, we performed comparative microarray analyses of murine iNKT cells and conventional CD4+CD25- γδCR- T cells.
MATERIALS AND METHODS
Animals
B6 mice were purchased from the Orient Company (Seoul, Korea). Mice were bred and maintained under specific pathogen-free conditions at the Clinical Research Institute of Seoul National University Hospital (CRISNUH), Seoul, Korea. All animal experimental protocols were approved by the Institutional Animal Care and Use Committee (IACUC) at CRISNUH.
Cell preparation
B6 mice were sacrificed to isolate iNKT cells and conventional T cells, and their livers were homogenized, resuspended in RPMI media containing 33% Percoll density gradient medium (GE Healthcare BioScience, Piscataway, NJ), and centrifuged for 15 min at 2,000 rpm at 25℃. The mononuclear cells (MNCs) were retrieved, washed with PBS, and stained with fluorescein isothiocyanate (FITC)-conjugated mAb specific for CD3 (BD Biosciences, San Jose, CA) and allophycocyanin (APC)-conjugated CD1d/α-GalCer tetramer (National Institutes of Health Tetramer Core Facility, Bethesda, MD). The lymph nodes were homogenized, resuspended in PBS, and stained with FITC-conjugated mAb specific for CD3, phycoerythrin (PE)-conjugated mAb specific for CD25 (BD Biosciences, San Jose, CA) and PE-conjugated mAb specific for γδTCR (BD Biosciences, San Jose, CA). The stained cells were then sorted on a BD FACSAria flow cytometer (Franklin Lakes, NJ). The sorted CD3+ CD1d/α-GalCer tetramer+ iNKT cells and CD3+CD25-γδTCR- conventional T cells were isolated at >98% purity.
RNA extraction
Total cellular RNA from the sorted NKT cells and conventional T cells was extracted by RNeasy Mini Prep kit (Qiagen, Valencia, CA), as the manufacturer's instructions, and then used in separate microarray experiments. RNA quality, concentration and purity were assessed by Nano spectrophotometer (Thermospectronics, Rochester, NY).
Labeling and purification
Total RNA was amplified and purified using the Ambion Illumina RNA amplification kit (Ambion, Austin, USA) to yield biotinylated cDNA according to the manufacturer's instructions. Briefly, 550 ng of total RNA was reverse-transcribed to cDNA using a T7 oligo (dT) primer. Second-strand cDNA was synthesized, in vitro transcribed, and labeled with biotin-NTP. After purification, the cDNA was quantified using the ND-1000 Spectrophotometer (NanoDrop, Wilmington, USA).
Hybridization and data export
750 ng of labeled cDNA samples were hybridized to each mouse-8 expression bead array for 16~18 h at 58℃, according to the manufacturer's instructions (Illumina Inc., San Diego, USA). Detection of array signal was carried out using Amersham fluorolink streptavidin-Cy3 (GE Healthcare Bio-Sciences, Little Chalfont, UK) following the bead array manual. Arrays were scanned with an Illumina bead array Reader confocal scanner according to the manufacturer's instructions. Array data export processing and analysis was performed using Illumina BeadStudio v3.1.3 (Gene Expression Module v3.3.8).
Raw data preparation and statistic analysis
The quality of hybridization and overall chip performance were monitored by visual inspection of both internal quality control checks and the raw scanned data. Raw data were extracted using the software provided by the manufacturer (Illumina GenomeStudio v2009.2 [Gene Expression Module v1.5.4]). Array data were filtered by detection p value <0.05 (similar to signal to noise) in 50 % of total samples (we applied a filtering criterion for data analysis; higher signal value was required to obtain a detection p value <0.05). Selected gene signal value was transformed by logarithm and normal ized by quantified method. The independent LPE test confirmed that no difference exists between mean of groups in the data.
False discovery rate (FDR) was controlled by adjusting p value using Benjamini-Hochberg algorithm. Go-ontology analysis for significant probe list was performed using PANTHER (http://www.pantherdb.org/panther/ontologies.jsp), using text files containing Gene ID list and accession number of illumina probe ID. Gene Set Enrichment Analysis (GSEA) was performed whether a priori defined set of genes shows differentially pattern both biological process and molecular function states. One-tail Fisher Exact is adopted to measure the gene-enrichment in annotation terms.
RESULTS
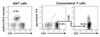
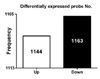
To compare iNKT cells with conventional T cells in terms of specific gene expression, we sorted CD3+α-Galcer tetramer+ iNKT cells in the liver and CD3+CD25-γδTCR- cells in the lymph nodes from B6 mice. To rule out the contamination of conventional T cells with CD4+CD25+ regulatory and γδ T cells, we sorted CD25- or -γδTCR-positive cells out from conventional T cells (Fig. 1). Among the analyzed 11,866 genes, 2307 gene expression differed between iNKT and conventional T cells. 1163 gene expression was up-regulated, whereas 1144 genes were down-regulated in iNKT cells compared with conventional T cells (Fig. 2).
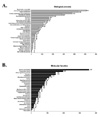
The GSEA method using 2 datasets provided differential expression of numerous genes in each biological process pathway and molecular function pathway in two target T cell groups (Fig. 3A and B). In general biological pathway, nucleoside, nucleotide, nucleic acid metabolism, signal transduction, protein metabolism and modification, developmental process, immunity, defense, intracellular protein traffic, and intracellular protein traffic-related gene expression were significantly different between iNKT cells and conventional T cells. In molecular function-related genes, nucleic acid binding, transcription factor, select regulatory molecule, transferase, receptor, and hydrolase and kinase were differentially expressed (Fig. 3B).
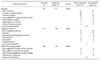
Several categories that showed statistically significant differences between two groups in the microarray data were more evaluated. These categories included immunity and defense, signal transduction, apoptosis, oncogenesis, cell adhesion and blood circulation and gas exchange related genes (Table I).
Among them, iNKT cells differentially expressed immunity and defense-related genes from conventional T cells compared with other categories. In molecular aspect, genes that are related with receptors, signaling molecules and defense and immunity proteins showed significant differential expression between two types of cells (Table II). In immunity and defense category of biological process category, macrophage-, natural killer cells-, glanulocyte-mediated immunity-related genes were up-regulated in iNKT cells compared with conventional T cells. Interestingly, iNKT cells up-regulated the genes that are related with chemokines compared with conventional T cells, suggesting that iNKT cells might be functionally regulated by enhancing chemokine-related proteins in immune system. Moreover, genes controlling cell apoptosis also up-regulated in iNKT cells compared with conventional T cells.
DISCUSSION
The iNKT cells express both TCRs and natural killer receptors on cell surface. The iNKT cells share characters of NK and T cells in terms of functions and expression patterns of various markers. Therefore, to characterize gene expression pattern of iNKT cells and conventional T cells, we performed microarray analysis.
We identified that a number of genes are differentially expressed between iNKT cells and conventional T cells (Fig. 2). To validate gene expression pattern and levels in our experiments, we estimated cytokine expression levels of IFN-γ, IL-4 and TNF-α which has been well known cytokines produced by iNKT cells upon TCR stimulation (2,9,10). Consistent with cytokine production pattern in activated iNKT cells, significantly up-regulated IFN-γ (113-fold), IL-4 (46-fold), and TNF-α (7-fold) expression levels were detected in iNKT cells, as compared with conventional T cells.
Genetic comparative methodologies have been developed and modified recently. The GSEA is a popular computational method to use for identifying differentially expressed genes that share some characteristic (11,12). Moreover, GSEA is also useful in analyzing related genes that have the same characteristic in the dataset. Therefore, GSEA method was used for our experiments to precisely compare two T cell subsets. The results of GSEA are consistent with innate-related functions of iNKT cells rather than conventional T cells (13).
In conclusion, iNKT cells differ from conventional T cells in terms of immune and defense-related gene expression, which might support that iNKT cells is a distinct subset of T cells by bridging innate and adaptive immunity.

 XML Download