Abstract
Purpose
To determine the associations of visual field index (VFI) with advanced glaucoma intervention study (AGIS) score, mean deviation (MD), pattern standard deviation (PSD), and average retinal nerve fiber layer (RNFL) thickness as measured by optical coherence tomography (OCT) and to evaluate the diagnostic abilities of these parameters.
Methods
One hundred fifteen glaucomatous eyes and 78 healthy eyes were enrolled in this cross-sectional study. Each participant had a Humphrey visual field analyzer test and OCT done. The diagnostic abilities of these parameters were analyzed using the receiver operating characteristic (ROC) curve, and we sought to determine the association of these parameters with VFI by Pearson correlation analysis.
Results
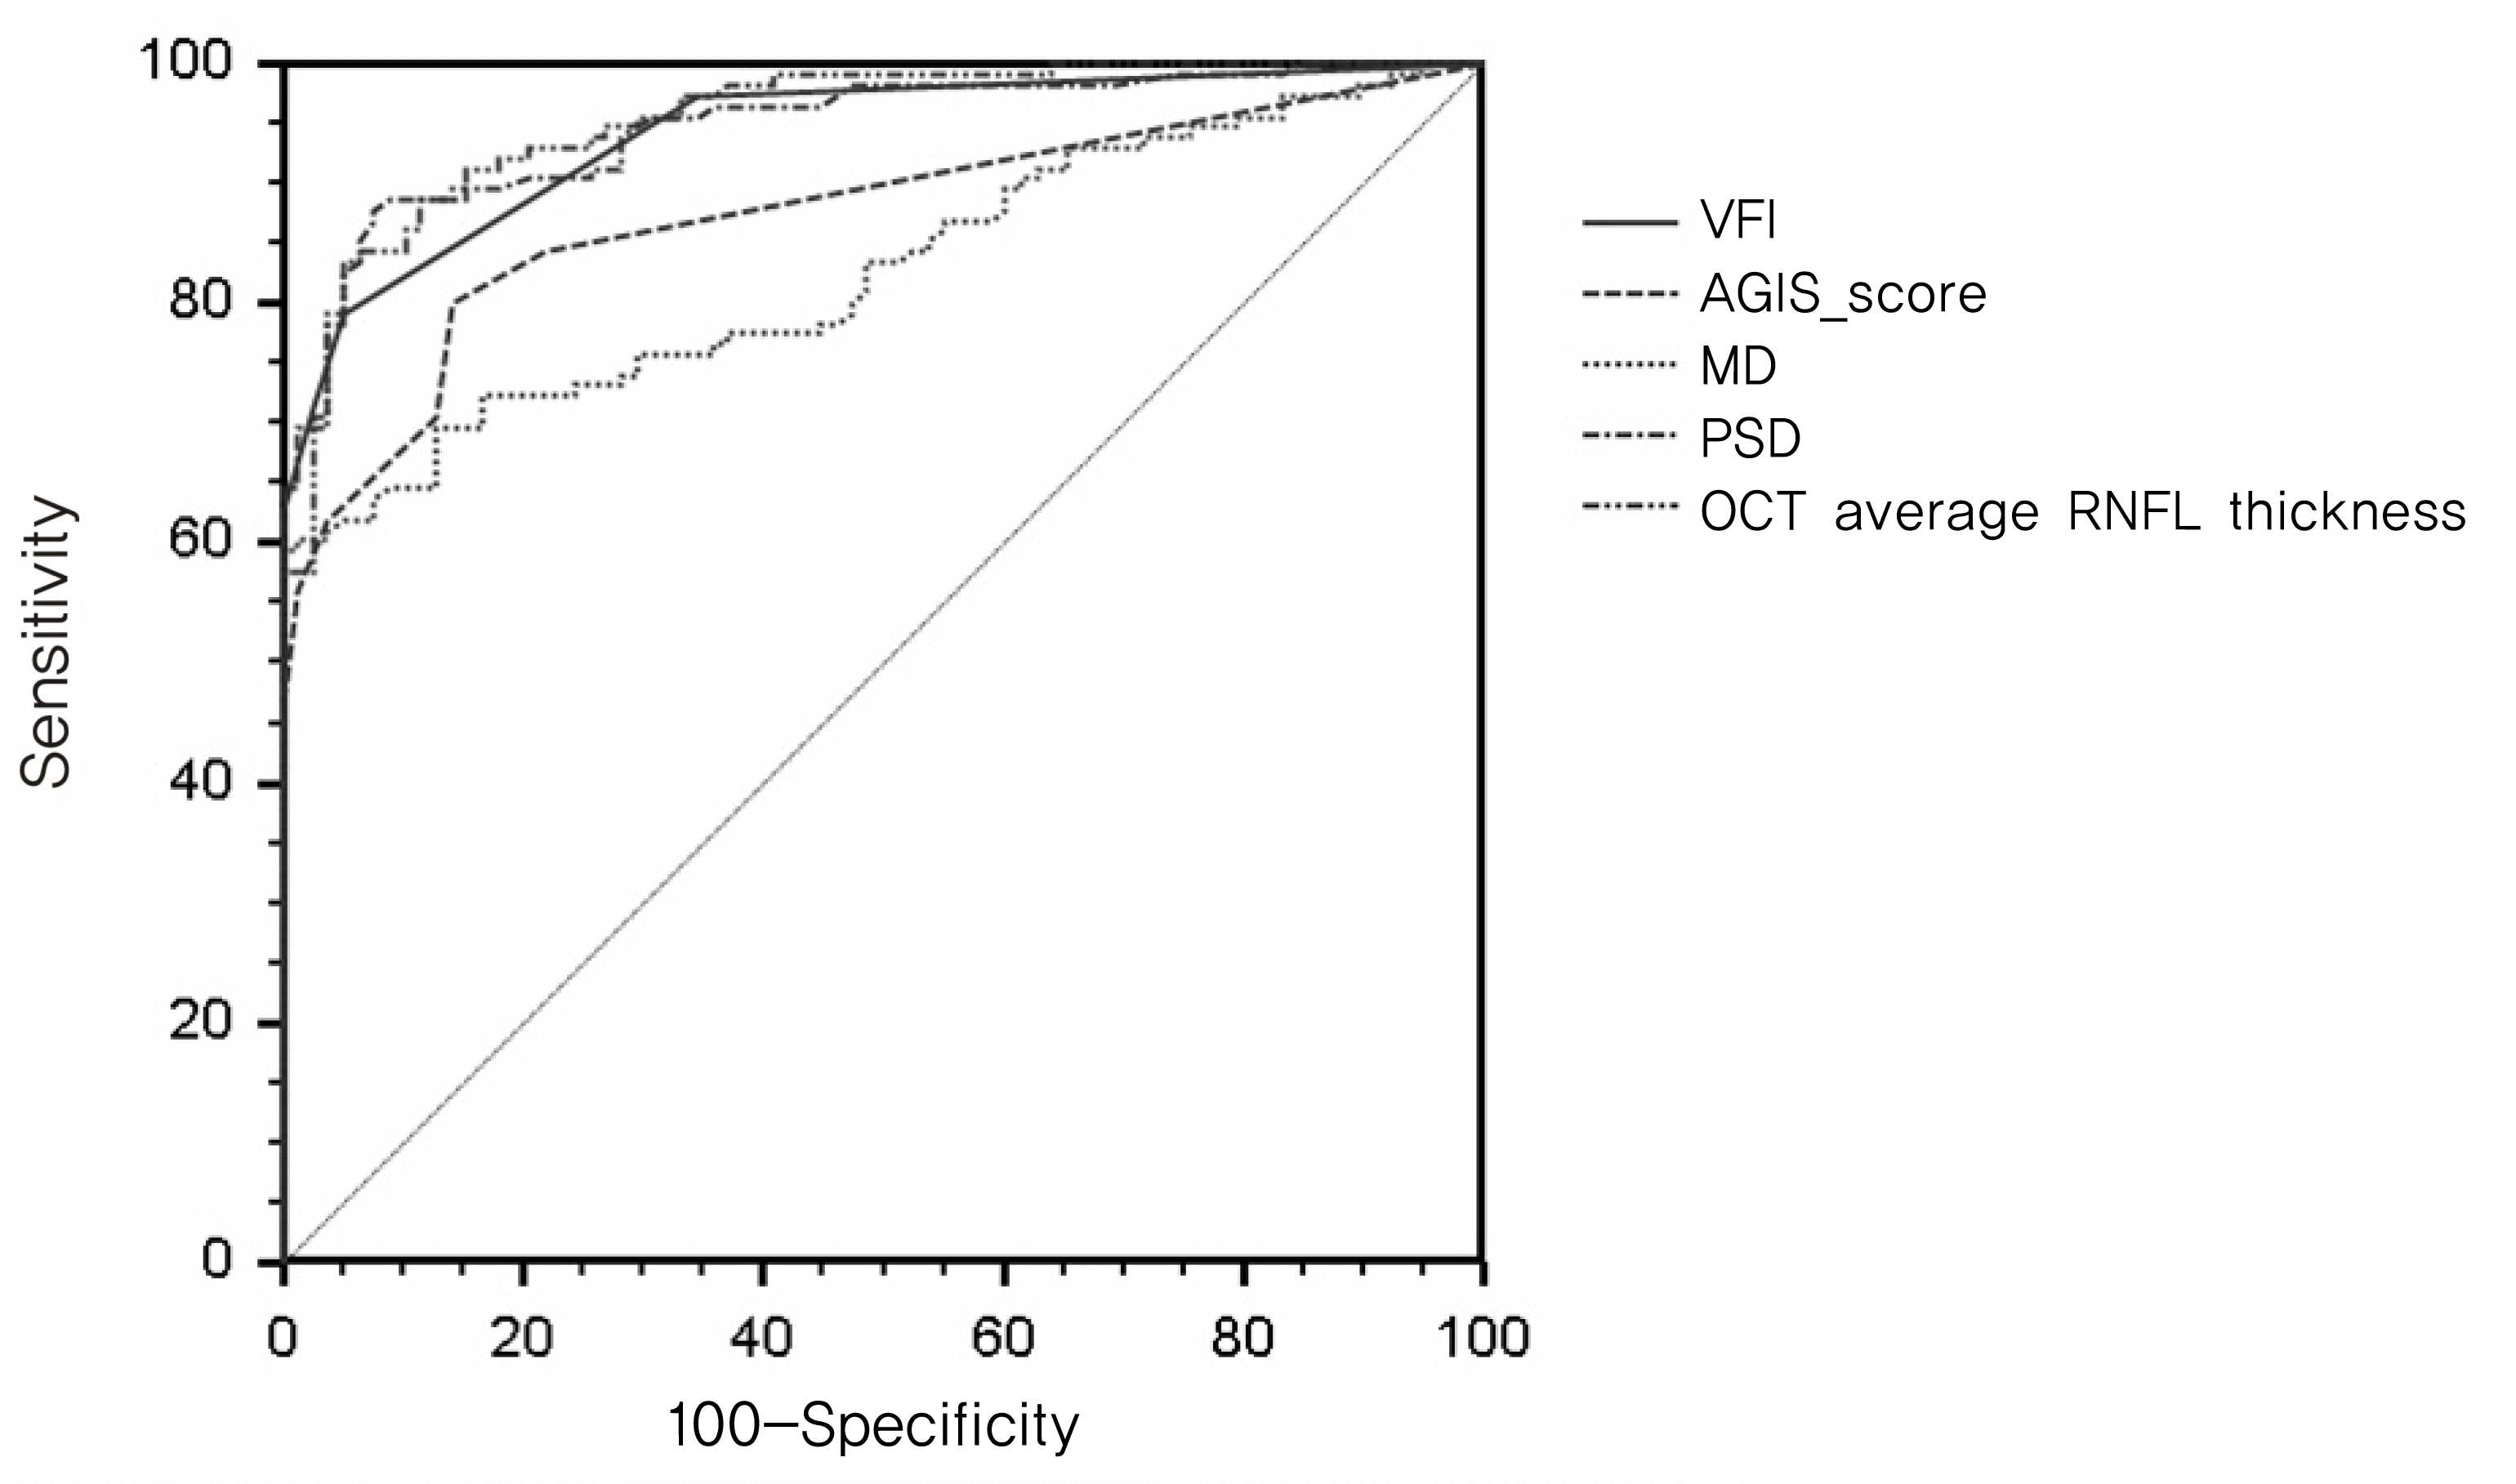
The associations between analyzed parameters and VFI were statistically significant (all, p<0.001). The area under the ROC curve (AUROC) value of VFI was greater than that of the MD and AGIS score (all, p<0.001) but was not different from the PSD and RNFL average thickness measured by OCT (p=0.756, p=0.638).
References
1. Sommer A, Miller NR, Pollack I, et al. The nerve fiber layer in the diagnosis of glaucoma. Arch Ophthalomol. 1977; 95:2149–56.

2. The Advanced Glaucoma Intervention Study (AGIS): 1. Study design and methods and baseline characteristics of study patients. Control Clin Trials. 1994; 15:299–325.
3. Collaborative Normal-Tension Glaucoma Study Group. aberrations of glaucomatous progression between untreated patients with normal-tension glaucoma and patients with therapeutically reduced intraocular pressures. Am J Ophthalmol. 1998; 126:487–97.
4. Gordon MO, Kass MA. The Ocular Hypertension Treatment Study: design and baseline description of the participants. Arch Ophthalmol. 1999; 117:573–83.
5. Musch DC, Lichter PR, Guire KE, Standardi CL. The aberrations Initial Glaucoma Treatment Study: study design, methods, and baseline characteristics of enrolled patients. Ophthalmology. 1999; 106:653–62.
6. Leske MC, Heijl A, hyman L, Bengtsson B. Early Manifest aberrations Trials: design and baseline data. Ophthalmology. 1999; 106:2144–53.
7. Flammer J. Fluctuations in the visual fields. Drance SM, aberrations DR, editors. Automatic Perimetry in Glaucoma A Practical Guide. Orlando, FL: Grune and Stratton Inc.;1985. 1:chap.p. 7.
8. Leske MC, Heijl A, Hyman L, et al. EMGT Group. Predictors of long-term progression in the early manifest glaucoma trial. aberrationsogy. 2007; 114:1965–72.

9. Heijl A, Lindgren G, Olsson J. A package for the statistical aberrations of visual field. Greve EL, Heijl A, editors. Doc aberrations Proc ser;1987. 1:chap.p. 9.
10. The AGIS Investigators. Advanced Glaucoma Intervention Study. 2. Visual field test scoring and reliability. Ophthalmology. 1994; 101:1445–55.
11. Bengtsson B, Heijl A. A Visual Fielld Index for Calculation of aberrations Rates of Progression. Am J Ophthalmol. 2008; 145:343–53.
13. Chauhan BC, LeBlanc RP, Shaw AM, et al. Repeatable diffuse visual filed loss in open-angle glaucoma. Ophthalmology. 1997; 104:532–8.
14. Weber JT. Topographie der funktionellen Schädigung beim chr-onishen glaukom. Heidelberg, Germany: Kauden Verlag;1992. p. 81.
15. Åsman P, Wild JM, Heijl A. Appearance of the pattern deviation map as a function of change in area of localized filed loss. Invest Ophthalmol Vis Sci. 2004; 45:3099–106.
16. Artes PH, Nicolela MT, LeBlanc RP, Chauhan BC. Visual field progression in glaucoma: total versus pattern deviation analysis. Invest Ophthalmol Vis Sci. 2005; 46:4600–6.
Figure 1.
Comparison of receiver operating characteristic (ROC) curves between VFI and Humphrey visual field parameters and OCT (RNFL) average thickness [The Area under (ROC) value of VFI, AGIS score, MD, PSD, and OCT was 0.943, 0.876, 0.827, 0.948, and 0.954, respectively. And the AUROC value of VFI was greater than that of the MD and AGIS score (all, p<0.001), but was not different from that of PSD and RNFL average thickness measured by OCT (p=0.756, p=0.638)]. VFI=visual field index; AGIS=advanced glaucoma intervention study; MD=mean deviation; PSD=pattern standard deviation; OCT=optical coherence tomography; RNFL=retinal nerve fiber layer.

Table 1.
Descriptive statistics for demographics and clinical characteristics of the study participants
| | Glaucomatous eyes (n=115) | Normal controls (n=78) | p-value |
|---|---|---|---|
| * No of patient | 115 | 78 | |
| Sex (M: F) | 66: 49 | 40: 38 | 0.18 |
| Age (yr) | 54.4±12.5 (26∼83) | 52.1±7.7 (28∼73) | 0.15 |
| † VFI (%) | 82.8±20.5 (11∼99) | 99.5±0.7 (97∼100) | <0.001 |
| ‡ AGIS score | 6.2±5.1 (1∼20) | 0.5±1.2 (0∼4) | <0.001 |
| § MD (dB) | −6.4±6.8 (−1.02∼-28.01) | −0.6±1.1 (1.76∼-2.54) | <0.001 |
| Π PSD (dB) | 6.2±4.5 (1.26∼15.95) | 1.5±0.3 (1.10∼2.57) | <0.001 |
| # OCT average thickness(μm) | 76.3±16.4 (84.27∼105.41) | 107.7±10.4 (86.72∼134.37) | <0.001 |
Table 2.
The area under receiver operating curve (AUROC) of the parameters from Humphrey visual field and from Stratus OCT
| | AUROC | 95% confidence interval | p-value for difference from *VFI |
|---|---|---|---|
| * VFI (%) | 0.943±0.019 | 0.900±0.971 | NA |
| † AGIS score | 0.876±0.024 | 0.821±0.919 | <0.001 |
| ‡ MD (dB) | 0.827±0.032 | 0.762±0.874 | <0.001 |
| § PSD (dB) | 0.948±0.016 | 0.906±0.974 | 0.756 |
| Π OCT (μm) | 0.954±0.017 | 0.914±0.979 | 0.638 |
Table 3.
Pearson correlation results between visual field index and Humphrey visual field parameters and optical coherence tomography retinal nerve fiber layer average thickness in glaucomatous patients
| | Correlation coefficient (R) | p-value |
|---|---|---|
| * AGIS score | 0.927 | <0.001 |
| † MD (dB) | 0.977 | <0.001 |
| ‡ PSD (dB) | 0.832 | <0.001 |
| § OCT (μm) | 0.662 | <0.001 |


 PDF
PDF ePub
ePub Citation
 Print
Print


 XML Download