

 PDF
PDF ePub
ePub Citation
 Print
Print


Introduction
Donepezil is a non-competitive, reversible, acetylcholinesterase (AChE) inhibitor and is used as a selective treatment for Alzheimer's disease.[1] Alzheimer's disease is a neurodegenerative disorder and causes memory dysfunction, cognitive impairment, and other symptoms. The use of AChE inhibitors or N-methyl-D-aspartate (NMDA)-receptor inhibitors helps relieve the symptoms and slows the progression of Alzheimer's disease. [2] Previously, tacrine was widely used as an AChE-based treatment; however, due to its hepatotoxicity, it has been replaced by other drugs, such as donepezil, rivastigmine, and galantamine. Among these drugs, donepezil displayed a relatively long half-life (approximately 70 to 80 h, whereas those of the other AChE inhibitors were 0.3 to 12 h) and had the appropriate potency to relieve symptoms for ataxia, cognitive impairment and other neurodegenerative symptoms caused by Alzheimer's disease. Consequently, it is widely used for vascular dementia in addition to Alzheimer's disease.[3]
Previously, quantitative analysis of donepezil was performed mainly by using high-performance liquid chromatography (HPLC) with an ultraviolet or fluorescence detector.[456] These methods have several merits. For example, samples can be easily prepared and analyzed; however, these methods also have some drawbacks. These methods require a long run time (approximately 20 min), they show low sensitivity, and they require a large injection volume (approximately 37 µL).[7] Recently, high performance or ultra performance liquid chromatographytandem mass spectrometers (HPLC-MS/MS or UPLC-MS/MS) have been used more frequently for chemical analysis, including the quantification of drugs in human plasma for various pharmacokinetic studies and for therapeutic drug monitoring.[8910] The UPLC-MS/MS system has a higher sensitivity than conventional UV or fluorescence detector methods, requiring a smaller sample volume than conventional analysis methods, and it has a shorter run time and a higher reproducibility.[6]
This study aimed to develop a donepezil analytical method with high reproducibility and sensitivity using UPLC-MS/MS and a UPLC column. Furthermore, the developed method was applied to the quantification of donepezil in human plasma.
Methods
Materials and reagents
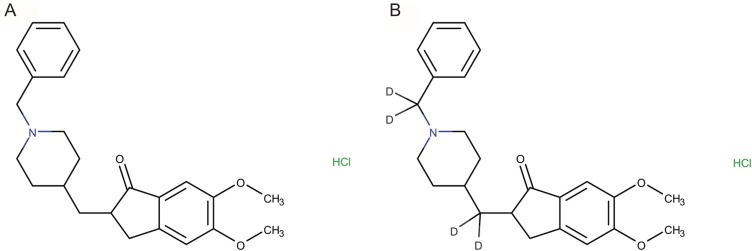
Molecular structures of (A) donepezil and (B) donepezil-D4 (IS) are represented in Figure 1 (A and B). Donepezil hydrochloride (standard, purity 100.0%) and donepezil-D4 hydrochloride (Internal standard, purity 99.0%) were purchased from the Tokyo Chemical Industry (Tokyo, Japan) and CDN Isotopes (Quebec, Canada), respectively. Acetonitrile, methanol, ethyl acetate, and hexane were purchased from Sigma-Aldrich (St. Louis, MO, USA). All the reagents obtained were HPLC grade or extra-pure grade. Deionized water was purified using a Millipore Milli-Q system at 18.2 MΩ (MA, USA). Drug-free pooled plasma containing sodium heparin was purchased from Biochemed (VA, USA). Pooled plasma and six individual plasmas were stored at −80℃ until analysis.
Preparation of quality control samples and calibration standards
Donepezil and donepezil-D4 stock solutions (1 mg/mL) were prepared in deionized water:methanol (50:50, v/v, 50% methanol). A working solution was prepared by serial dilution using 50% methanol final concentrations of 1, 2, 5, 10, 50, 100, and 500 ng/mL, and the working solution was spiked with plasma at a ratio of 1:9. The internal standard (IS) was prepared by dilution to 10 µg/mL using 50% methanol. All the analytes and IS working solutions were stored at 4℃ until analysis.
Calibration standards and quality control (QC) samples were prepared using drug-free pooled plasma. Three different concentrations of the QC samples were prepared by adding 20 µL of working solution to 180 µL of pooled plasma (low, medium and high concentrations of 0.3, 3.5, and 35 ng/mL, respectively). Seven calibration standards were prepared by spiking the working solution into drug-free pooled plasma (final concentrations were 0.1, 0.2, 0.5, 1, 5, 10, and 50 ng/mL, respectively).
Sample preparation
The plasma preserved at −80℃ was thawed at room temperature (18~21℃) and was slightly vortexed for a short time. Donepezil extraction from plasma was conducted by liquid-liquid extraction (LLE). A total of a 200 µL sample of plasma was transferred into a polypropylene tube and was spiked with 20 µL of IS (donepezil-D4, 10 µg/mL in 50% methanol). Then, the sample was extracted for 15 min after adding hexane:ethyl acetate (70:30, v/v) and was vortexed for 3 min prior to centrifugation at 4,000 rpm for 5 min. The supernatant was transferred to a new polypropylene tube and was kept for 60 min at −80℃. Then, the organic solution layer was transferred to a new polypropylene tube. The transferred supernatant was concentrated at 45℃ for 60 min using a vacuum concentrator (Labconco Corp., MO, USA) and was re-dissolved in 150 µL of a mobile phase (5% acetic acid in 20 mM ammonium acetate:100% acetonitrile = 60:40, v/v, pH 3.3). The dissolved sample was centrifuged at 13,200 rpm for 5 min, and 3 µL of the supernatant was injected into the UPLC-MS/MS system for analysis.
Chromatographic conditions
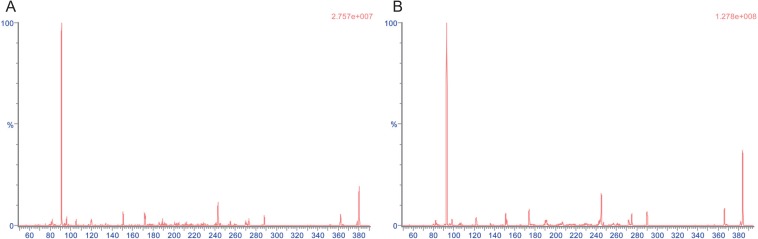
The UPLC-ESI-MS/MS system consisted of an ACQUITY™ UPLC (Waters, MA, USA) and a triple quadrupole tandem Xevo TQ-MS mass spectrometer (Waters, MA, USA). The analyte separation was performed on a Hypersil GOLD C18 column (150 × 2.1 mm, 1.9 µm, Thermo, MA, USA) using 5% acetic acid in 20 mM ammonium acetate buffer (pH 3.3) (A) and 100% acetonitrile (B) by the isocratic method at a ratio of 60:40 (v/v). The total run time was 3 minutes. The autosampler and column oven temperature were maintained at 10℃ and 40℃, respectively. MS/MS detection was performed in the positive ion mode for donepezil and IS. Multiple reaction monitoring (MRM) mode was used for quantification, with a m/z of 380.6 → 91.1 for donepezil and a m/z of 384.2 → 245.1 for IS (donepezil-D4). All the quantified data was processed using Masslynx version 4.1 (Waters, MA, USA). Product ion spectra of (A) donepezil and (B) donepezil-D4 (IS) by collision induced dissociation of corresponding parent ions is presented in Figure 2 (A and B).
Method validation
The validation of the quantification method was performed based on the “Guideline on Bioanalytical Method Validation” published by the Korean Ministry of Food and Drug Safety (MFDS) and US Food and administration (FDA).[1112] The following items were evaluated in this study: linearity, sensitivity, accuracy, precision, selectivity, carry-over, recovery, matrix effect, dilution integrity and stability under various conditions.
Linearity
The calibration standard consisted of a blank (without analyte and IS), a zero (without analyte and with IS), and seven-point samples (with analyte and IS). Linearity was assessed at donepezil concentrations of 0.1~50 ng/mL ranges in human plasma. In addition, linear regression, with a weighting factor of 1/x2, was used to assess whether the coefficient of correlation was higher than 0.997.
Sensitivity
Sensitivity was recognized only by the signal to noise (S/N) being 10 or more on the lower limit of quantification (LLOQ), and the LLOQ was set equal to the lowest concentration of the curve (0.1 ng/mL).
Accuracy and precision
For the evaluation of the accuracy and precision, five consecutive (intra-batch) analyses were performed in three different batches (inter-batch) at LLOQ and low, medium, and high concentrations of QC. An acceptance criterion of accuracy was within ±20% for LLOQ and ±15% for other concentrations. The acceptance criterion of precision also was within a coefficient of variation (CV, %) of less than 20% for LLOQ and less than 15% for other concentrations.
Selectivity
Selectivity was assessed using six individual human plasmas. We prepared four selectivity samples: (1) double blank, (2) spiked IS only, (3) spiked LLOQ concentration working solution only, and (4) spiked LLOQ concentration working solutions including IS. Then, we analyzed and compared the four selectivity samples to determine if they had interference peaks. The influence of interfering substances should be lower than 20% of the analyte peak area and lower than 5% of the IS peak area at LLOQ of the sample.
Carry-over
The carry-over effect was evaluated whether the analyte (donepezil) was higher than 20% of the LLOQ and 5% for the IS in the blank sample. The blank plasma was injected immediately after the injection of the upper limit of quantification (ULOQ) samples; this process was repeated five times.
Recovery
The recovery rate was calculated by comparing the area ratio of the spike-pre-extraction samples and the spike-post-extraction samples.
Matrix effect
Matrix effects were evaluated to assess whether endogenous substances present in the plasma interfered with analyte or IS. The matrix effect was tested with QC samples of low and high concentrations using six different individual plasmas as well as the analyte peak area and IS peak area after sample preparation.
Dilution integrity
The dilution integrity was used to evaluate the effect of sample dilution on the analysis. A sample of 100 ng/mL (2-fold of ULOQ) was diluted 1/10 and 1/50. Accuracy and precision were within 15%.
Stability
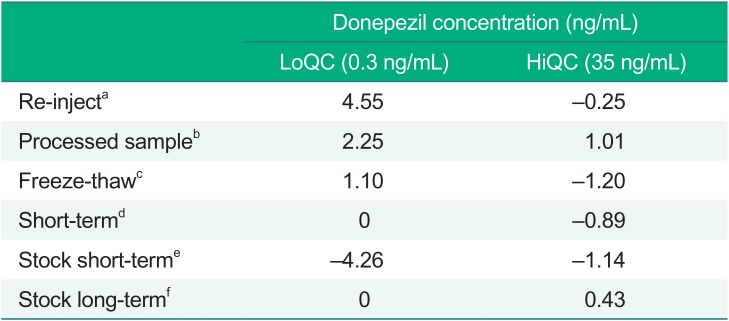
The stability test was performed under various conditions. The re-injection was compared with the results obtained by three-replicate analyses of the LoQC and HiQC samples using the samples analyzed the day before (test) as well as fresh samples (reference). Processed sample stability was determined by comparing the sample that was stored in the autosampler for 24 h. Freeze-thaw stability was assessed under three freeze-thaw cycles at −80℃. Short-term stability was measured after the samples were kept at 18~21℃ for 20 h. To assess stock stability at laboratory temperature (18~21℃) for 24 h and 4℃ for 24 days, the analyte to IS peak area ratio of the samples was compared to those of freshly prepared stock solution.
The acceptance criterion of the stability was that the % change of all the stability samples was within 15% of the nominal concentration.
Pharmacokinetic study
A clinical study was conducted in 18 healthy adult males receiving a single oral 5 mg dose of a donepezil hydrochloride tablet (Donep Tab, Daewoong Pharmaceutical, Co. Ltd.) in the Clinical Trial Center of Gachon University Gil Medical Center. The clinical study protocol was approved by the Institutional Review Board of Gachon University Gil Medical Center (IRB No: GBIRB2016-036). All the participants were informed about the purpose and content of the study and voluntarily agreed to the study. Blood samples were collected at pre-dose as well as 1, 2, 3, 3.5, 4, 4.5, 5, 5.5, 6, 8, 12, 24, 48, 72, 120, 168 h after drug administration in a tube containing sodium heparin. The collected blood was immediately centrifuged at 3,000 rpm for 10 min at 4℃ or lower, and the plasma obtained was divided into two polypropylene tubes of 0.7 mL each and stored at −80℃ until analysis.
Results
UPLC-MS/MS
The separation was performed using a Thermo Hypersil GOLD C18 column (150 × 2.1 mm, 1.9 µm) with 5% acetic acid in 20 mM ammonium acetate (a) and 100% acetonitrile (b) using the isocratic method (60:40, v/v). The results showed a good peak shape, and the analytes were well separated.
The extraction method was performed according to Philli et al's study. Donepezil was extracted using an n-hexane and ethyl acetate mixture in plasma. Liquid-liquid extraction (LLE) is a widely used technique for biological sample analysis. In several studies, a pH modifier, such as NaOH or phosphoric acid, is added for stable extraction. In this study, we attempted to extract donepezil in plasma without a pH modifier, and results showed a recovery rate of approximately 60%, which was reproducible even though it was a lower recovery than other references.
Method validation
Linearity
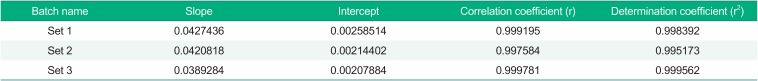
Using a seven-point calibration standard, the linearity of the method was evaluated. The method showed adequate linearity; all of the correlation coefficients (r) of the calibration standard were higher than 0.995, and the determination coefficient (r2) was also higher than 0.980 in three independent batches (Table 1).
Sensitivity
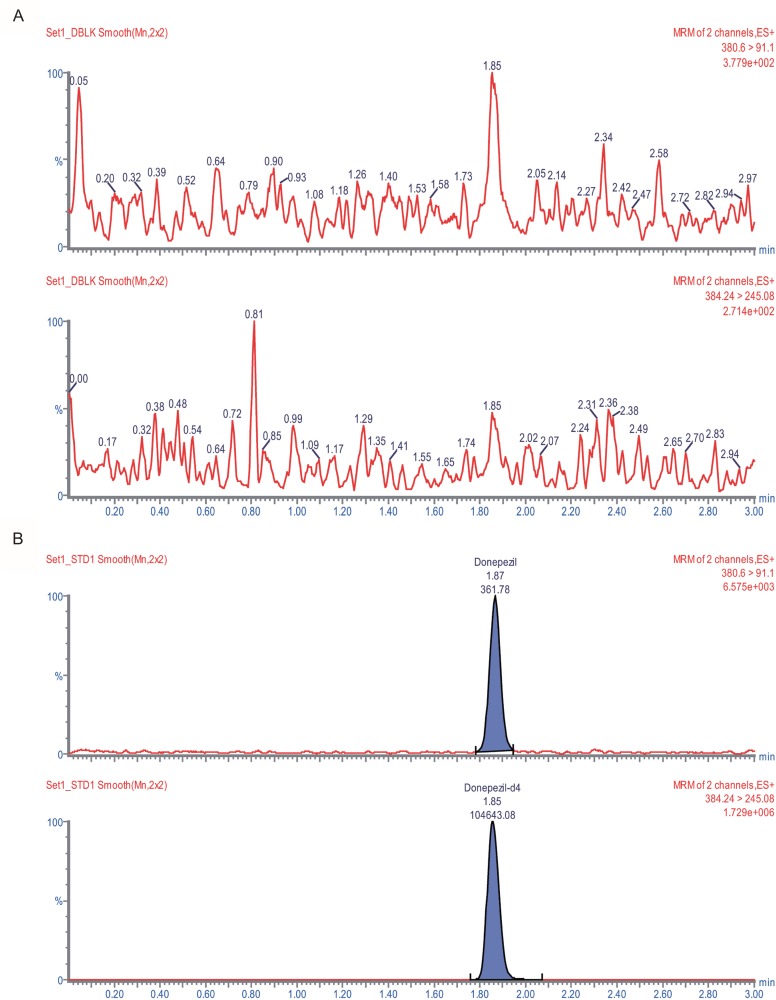
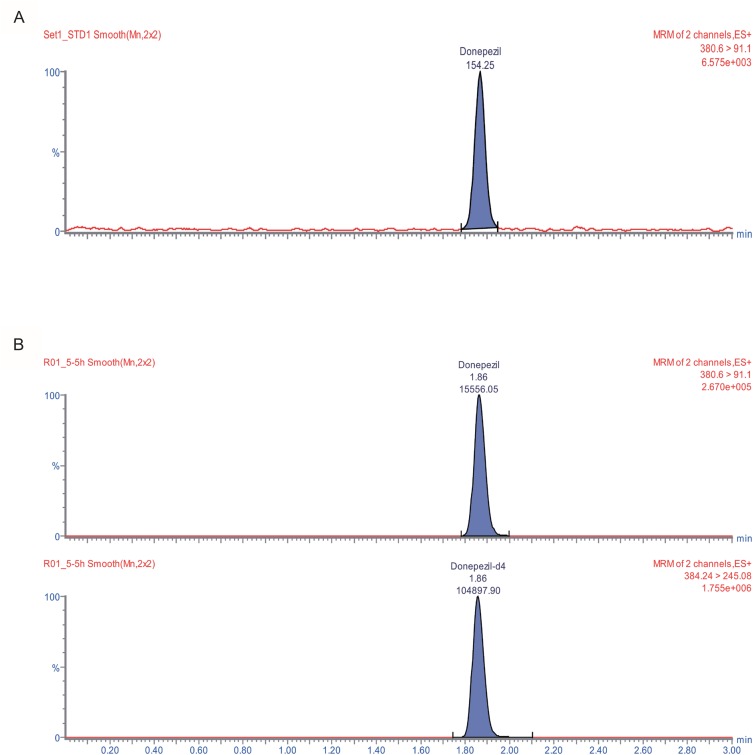
The chromatograms for the double blank sample (not contain any analytes) and for the LLOQ sample are found in Figure 3A and Figure 3B, respectively. The signal-to-noise ratio in the LLOQ sample was 154.3 (Fig. 4A), which satisfied the sensitivity criterion suggested in the bioanalytical method validation guidelines.[1112] The representative chromatogram of the sample that was obtained after oral administration of donepezil is presented in Figure 4B.
Accuracy and precision
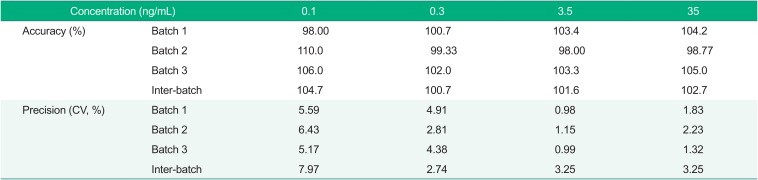
The range of inter and intra accuracy was 98.0%~110.0% and 100.7%~104.7%, respectively. The range of inter and intra precision was 0.98%~6.43% and 2.74%~7.97%, respectively. The results of the four quality control samples showed that the LLOQ was within ±20% for all the batches and was within ±15% at all the other QC concentrations (Table 2).
Selectivity
To confirm the interference by endogenous substances, the LLOQ samples (IS spiked) and the blank plasma samples were subjected to the same preparation, and the resulting interference peaks were analyzed on the chromatograms. No interference peak was found in the blank plasma after ULOQ sample injection (data not shown).
Recovery
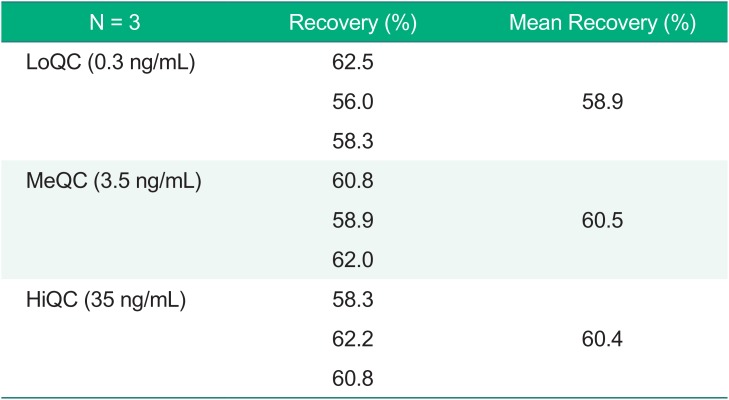
To assess the recovery, three replicates at low, medium, and high concentrations of QC for donepezil were prepared. The mean recovery was 58.9%, 60.5%, and 60.4%, respectively, and the CV was 1.51% among the three QC samples (Table 3).
Matrix effect
The matrix effect was evaluated using low and high QC samples prepared using six individual plasmas. The CV (%) was 0% for the low QC and was 1.02% for the high QC sample (data not shown).
Dilution integrity
A 1/10 diluted sampled represented the accuracy and was 110.0%~113.9%, and the precision was 1.58%. A 1/50 diluted sample represented the accuracy and was 108.30%~115.8%, with a precision of 2.80%. The 1/10 dilution results satisfied this criteria, but the 1/50 dilution results did not.
Stability
Re-injection, processed sample stability, freeze-thaw stability, short-term stability test and stock stability were evaluated. Three replicated LoQC and HiQC samples were used in the determination of stability. Re-injection, processed sample stability, freeze-thaw stability and short-term stability were compared, and a nominal concentration % change within 15% was considered acceptable. A stock short-term and long-term stability was calculated by comparing the peak area ratio of the test sample and the reference sample. All the stability test results are presented in Table 4.
Pharmacokinetic study
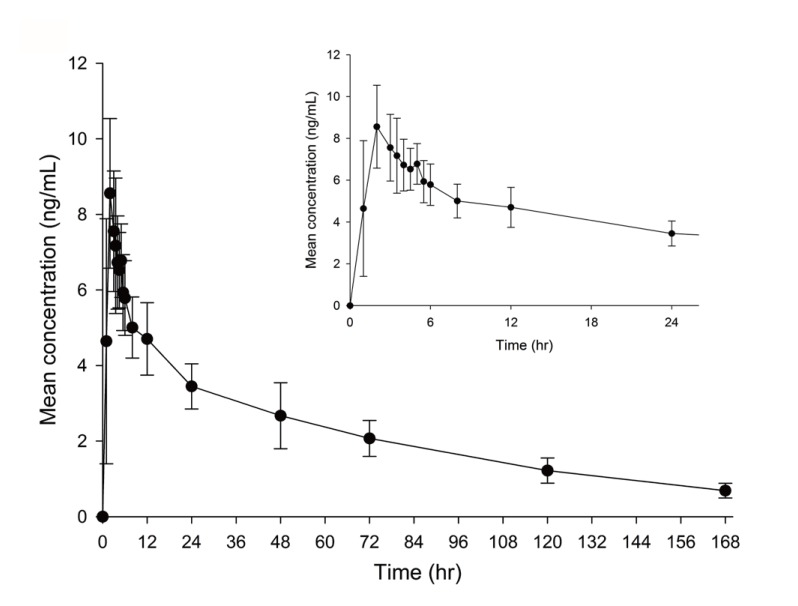
The method showed sufficient sensitivity, linearity, and suitability in the donepezil concentration ranges of 0.1~50 ng/mL for all batches. Moreover, the proper reproducibility and stability were obtained using human plasma. The mean concentration-time profile of donepezil is presented in Figure 5. The time to maximum concentration (Tmax) was observed at approximately 7 h.
Discussion
An analytical method of donepezil detection in plasma using the UPLC-ESI-MS/MS system was developed. The method was successfully applied to extract and quantify donepezil in human plasma. The method was validated according to the standard operating procedures based on the guidelines for bioanalytical method validation published by the Korean MFDS and the US FDA.[1112] All the evaluated items met the criteria of linearity, accuracy, sensitivity, matrix effect, carry-over, stability, and reproducibility under specified conditions. Using the UPLC and a UPLC column, only a small amount of injection volume (3 µL) was needed for quantification, and the run time for analysis was relatively short (approximately 3 minutes). The intra- and inter-batch accuracies ranged from 98.0% to 110.0% and from 100.7% to 104.7%, respectively. The intra- and inter-batch precisions ranged from 0.98% to 5.59% and from 2.74% to 7.97%, respectively. The current UPLC-MS/MS method seemed to be used for accurate quantification, even at relatively low concentrations of donepezil, with sensitivity and reproducibility.
The levels of donepezil in human plasma obtained from healthy subjects after oral dosing with 5 mg of donepezil hydrochloride (Donep®) was successfully determined using the developed and validated method. The mean ± standard deviation (SD) of the maximum concentration (Cmax) was 8.6 ± 2.0 ng/mL, and the median (range) Tmax was 2.0 (1.0~5.0 h), in eighteen healthy Korean subjects after 5 mg donepezil administration (Fig. 5).
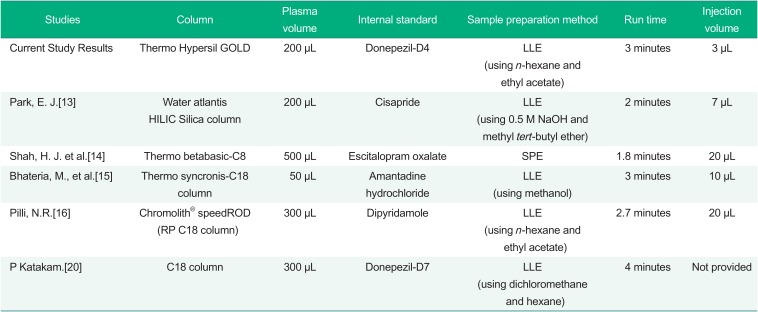
The current method showed reliable results with a liquidliquid extraction (LLE) preparation method and a C18 column with a relatively short run time of 3 min as well as a small injection volume of 3 µL compared to previous studies (Table 5).[13141516] First, as a comparison of the sample preparation method, Shah, H. J. et al. used solid-phase extraction (SPE) for sample preparation. Although SPE in known to be highly selective compared to liquid-liquid extraction (LLE) or protein precipitation (PP), it is considered to be difficult for handling, and it has a higher associated cost.[1718] Second, for the analysis column, the method developed by Park, E. J. et al. used LLE and a hydrophilic interaction chromatography (HILIC) to separate donepezil in plasma. HILIC was considered a powerful method to analyze hydrophilic or polar compounds in reverse phase.[1319] The shorter run time of 2 min was observed in the method with a HILIC column than that of our study results. However, 3 min of run time was considered relatively comparable to 1.8~2 min of run time; moreover, the smallest injection volume was needed among the compared previous methods.
In conclusion, a sensitive and simple analysis method for donepezil in human plasma was developed with the UPLC-MS/MS. Using the developed method, plasma donepezil concentrations were appropriately determined in healthy Korean subjects. The suggested method could be applied to various donepezil pharmacokinetic studies.
 XML Download