Loading [MathJax]/jax/output/HTML-CSS/fonts/TeX/fontdata.js

Journal List > Ann Rehabil Med > v.49(1) > 1516089977

Lee, Kim, and Kim: Nerve Conduction Study, Sympathetic Skin Response Test, and Demographic Correlates in Type 2 Diabetes Mellitus Patients

Abstract

Objective

To comprehensively assess the relationship between nerve conduction study (NCS), sympathetic skin response (SSR), and demographic factors in patients with diabetic neuropathy, exploring potential risk factors and mechanisms.

Methods

A retrospective study (N=184) included patients diagnosed with type 2 diabetes mellitus undergoing NCS and SSR. Demographic, clinical, and laboratory data were analyzed. Patients were categorized by diabetic peripheral neuropathy (DPN) and SSR stages for comparative analysis.

Results

HbA1c levels correlated with DPN progression. SSR stages exhibited age-related differences. Height correlated with DPN but not SSR stages. Body mass index showed no significant differences.

Conclusion

While DPN progression correlated with glycemic control and duration of diabetes, SSR was influenced by age. Unexpectedly, cholesterol levels remained within the normal range, challenging established concepts. Understanding these relationships is crucial for interpreting test results and developing targeted interventions for diabetic neuropathy.

Go to : Goto

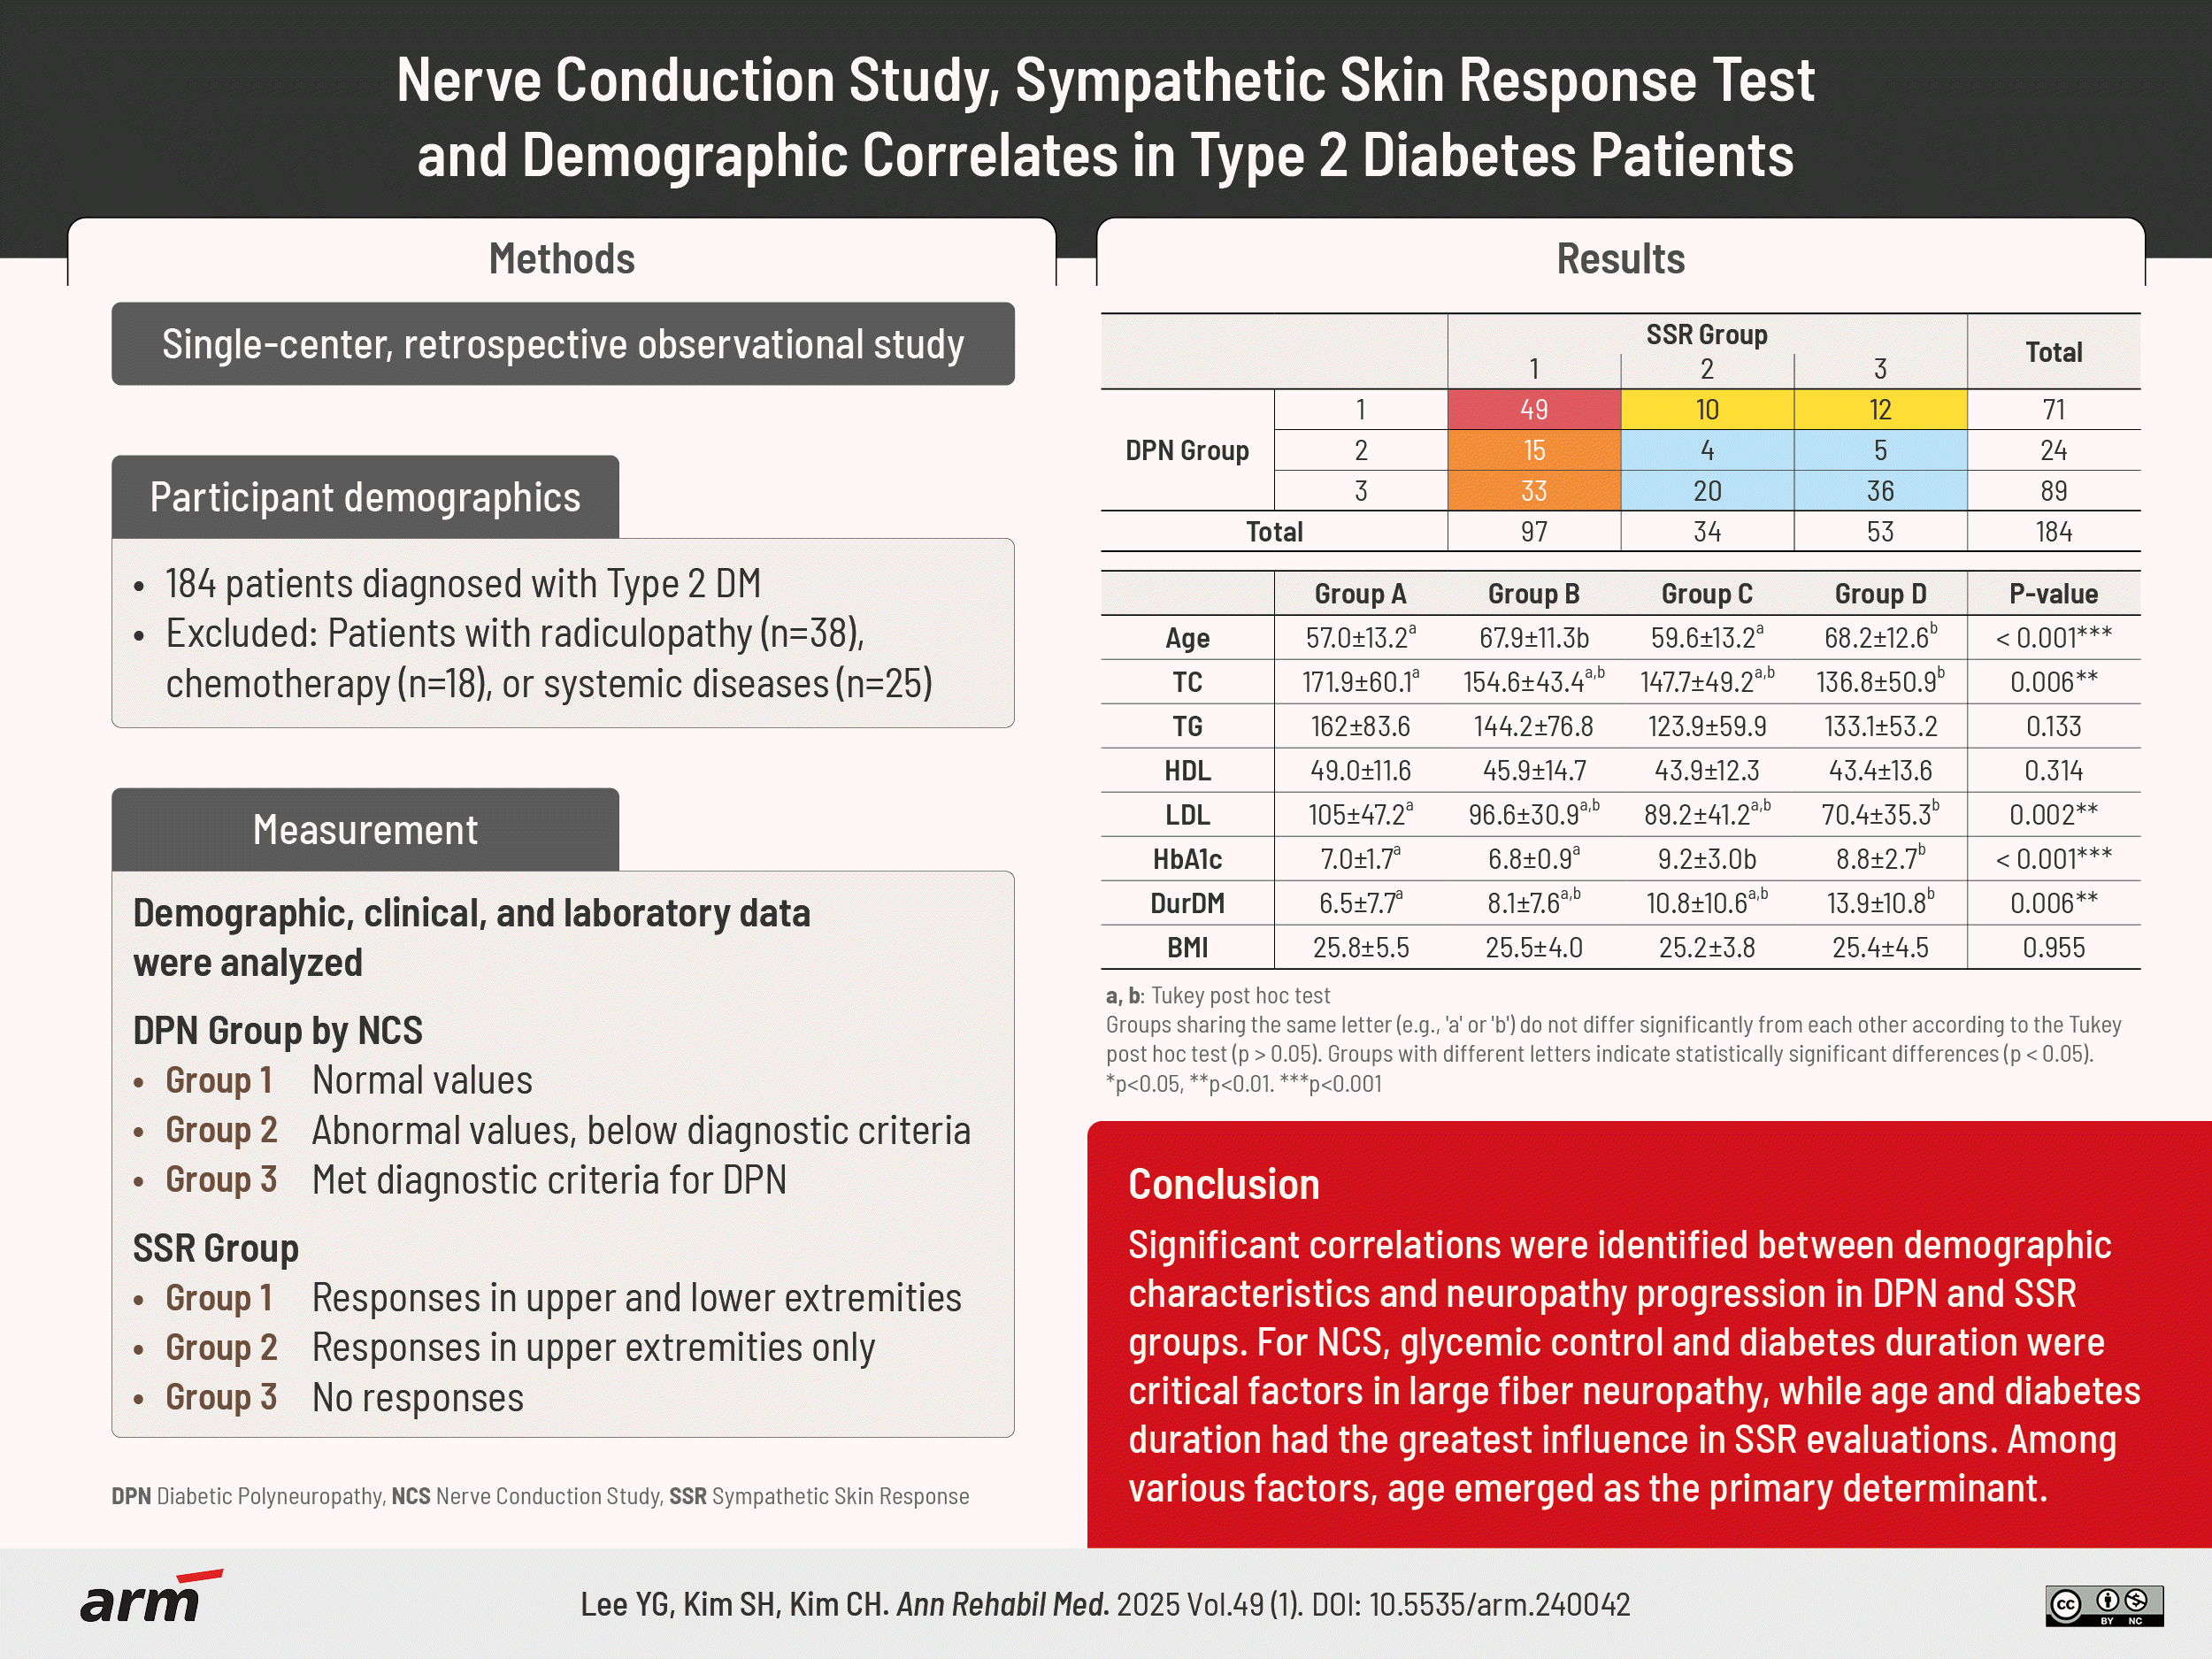
GRAPHICAL ABSTRACT

arm-240042f1.tif
Go to : Goto

INTRODUCTION

Diabetic peripheral neuropathy (DPN) is a common and debilitating complication of diabetes mellitus (DM), affecting a significant proportion of individuals with the disease. It is characterized by peripheral nerve dysfunction, leading to sensory disturbances, motor deficits, and autonomic dysfunction. Understanding the pathophysiology and clinical manifestations of diabetic neuropathy is essential for early diagnosis, appropriate management, and the prevention of further complications.
Nerve conduction study (NCS) and sympathetic skin response (SSR) studies are valuable diagnostic tools for evaluating diabetic neuropathy. NCS measures the speed and amplitude of nerve signals, providing objective assessments of large myelinated nerve function and detecting abnormalities in sensory or motor nerve responses [1,2]. SSR, on the other hand, assesses the sympathetic autonomic response by measuring changes in skin electrical conductivity following a stimulus [3,4]. SSR is influenced by both large-diameter sensory fibers in the afferent pathway and small unmyelinated fibers in the efferent pathway. Together, these studies offer complementary information about the involvement of both sensory and autonomic nerves in diabetic neuropathy. SSR examinations in diabetics with no or only slight clinical signs of neuropathy may detect autonomic disturbances at an early stage [5,6]. Therefore, SSR is a valuable method for assessing unmyelinated axonal damage (small unmyelinated C-fibers) and autonomic involvement, in conjunction with other autonomic function tests, in diabetic neuropathy patients [7].
While NCS and SSR have been extensively studied in diabetic neuropathy, few investigations have explored their relationship with demographic factors and other clinical test results. Demographic factors, including age, sex, duration of diabetes, and glycemic control, have been shown to influence the development and progression of diabetic neuropathy [8,9]. Examining the association between these factors and nerve conduction abnormalities or altered SSR may provide valuable insights into the underlying mechanisms and potential risk factors for diabetic neuropathy.
Therefore, the aim of this study is to assess the relationship between NCS, SSR studies, demographic factors, and other clinical test results in patients with diabetic neuropathy. By comprehensively exploring these factors and their interactions, we hope to deepen our understanding of the multifaceted nature of diabetic neuropathy. Specifically, this study will investigate the progression of DPN, primarily focusing on larger fiber disorders, as well as the progression of sensory-autonomic fiber dysfunction represented by SSR [10].
Go to : Goto

METHODS

Participants

This retrospective study was conducted at a tertiary medical institution (Inha University Hospital). We included patients previously diagnosed with type 2 DM or those newly diagnosed who underwent NCS and SSR tests between 2020 and 2022. Patients with potential causes of neuropathy other than diabetes, such as radiculopathy (n=38), chemotherapy (n=18), or systemic diseases affecting the peripheral nerves (n=25), were excluded.
A comprehensive analysis of NCS and SSR results was conducted on 184 patients, incorporating demographic, clinical, and laboratory data. All participants were informed about the research, and informed consent was obtained. The study protocol was approved by the Inha University Hospital Research Ethics Committee (IRB No: 2022-11-016).

Methods

For the NCS, Keypoint equipment (Dantec) was used. The patients’ skin temperature was maintained above 32°C. Sensory nerve conduction tests were performed using the antidromic technique on the median, ulnar, superficial peroneal, and sural nerves. Motor NCS included assessments of the median, ulnar, deep peroneal, and tibial nerves. Amplitude was measured from baseline to peak, with filtering frequencies ranging from 20 Hz to 10 kHz for motor nerves and 20 Hz to 2 kHz for sensory nerves.
The mean values of 10 recordings were obtained for both sensory and motor NCS, and minimal F-M latencies were determined using supramaximal stimulation. F-waves were recorded by stimulating each motor nerve (median, ulnar, peroneal, and tibial) with more than 10 supramaximal stimuli, documenting the minimal F-M latency. The diagnosis of DPN was based on electrodiagnostic values of the median, ulnar, peroneal, sural, and tibial nerves, following our laboratory’s standards, which were adapted from a diabetes control and complications study group [11]. The presence of more than three abnormal values in at least two different nerves was the minimum requirement for diagnosing DPN. If any abnormal values were observed but did not meet the full diagnostic criteria, the condition was classified as early-stage diabetic neuropathy. We aimed to identify patients with early-stage DPN, characterized by fewer than three abnormal values in at least two nerves. No cases of cubital tunnel syndrome were found in this patient group. In some patients with carpal tunnel syndrome, the neurophysiological examination showed only mild conduction velocity reduction in the wrist area during segmental studies, but they did not present any clinical symptoms of carpal tunnel syndrome.
The SSR was recorded using standard electromyograph equipment. Active surface electrodes were placed on the palms and soles, with reference electrodes on the dorsum of the respective body parts. Before electrode placement, the skin was cleaned, and electrolyte gel was applied. Recordings were made in a quiet, dimly lit room maintained at 22°C–24°C, with a filtering frequency range of 0.5 Hz to 500 Hz. Electrical stimulation was applied to the median nerve at both wrists using a single 20 mA stimulus, with sessions conducted at intervals of at least 30 seconds.
Patients were divided into groups based on DPN stage and SSR progression. For NCS, patients with normal values for all criteria were categorized as Group 1 [8]. Patients with abnormal values who did not meet the diagnostic criteria for DPN were categorized as Group 2, while those meeting the diagnostic criteria were classified as Group 3. In the SSR test, participants were classified as Group 1 if they showed an evoked response in both upper and lower extremities, Group 2 if they had responses only in the upper extremities, and Group 3 if no evoked response was present in either upper extremity.
We analyzed the contrast between the DPN stage, assessing large fiber neuropathy, and the SSR stage, which includes both large and small fiber neuropathy.

Statistical analysis

SPSS software version 26.0 (IBM Corp.) was used for the statistical analysis. Null hypotheses of no difference were rejected if p-values were less than 0.05.
T-tests were employed to assess differences between two independent groups, ANOVA was used to examine variations among multiple independent groups, and ANCOVA was applied to control for covariates and evaluate group differences. These statistical methods were selected to explore various aspects of the data, ensuring a comprehensive analysis of the relationships and differences among the studied variables.
Go to : Goto

RESULTS

A total of 184 patients were included in the study, comprising 84 males and 100 females. The respective values for males and females are recorded in the Table 1.
Table 1.
Physiological and demographic factors of participants
Total Male Female p-value
No. of participants 184 84 100 -
Age (yr) 62.9±13.6 61.0±13.7 64.5±13.4 0.078
TC (mg/dL) 151.1±53.7 146.8±57.4 154.6±50.6 0.334
TG (mg/dL) 138.0±65.8 134.5±61.5 141.7±70.5 0.539
HDL-cholesterol (mg/dL) 45.0±13.0 42.7±12.1 47.5±13.5 0.038*
LDL-cholesterol (mg/dL) 85.9±41.3 80.7±41.8 91.5±40.4 0.149
HbA1c (%) 8.2±2.6 8.6±2.9 7.9±2.3 0.064
DurDM (yr) 10.9±10.2 11.7±10.5 10.2±10.0 0.378
Height (m) 1.61±0.09 1.68±0.06 1.55±0.07 <0.001***
Weight (kg) 66.1±13.9 70.8±12.9 62.0±13.4 <0.001***
Body mass index (kg/m2) 25.5±4.5 25.0±3.6 25.8±5.2 0.205

Values are presented as mean±standard deviation.

TC, total cholesterol; TG, triglyceride; HDL, high density lipoprotein; LDL, low density lipoprotein; DurDM, duration of diabetes.

*p<0.05, ***p<0.001.

Download Table

The initial phase of the study involved categorizing groups based on DPN Group 1, 2, 3, and SSR Group 1, 2, 3 for comparative analysis. The second phase of the study involved dividing participants into four groups based on DPN Group and SSR Group for subsequent analysis. Based on the results of NCS and SSR tests (Table 2), we classified the patients into different groups to examine the significance between them. Group A consisted of patients who belonged to SSR Group 1 and DPN Group 1. Group B included patients who were categorized as SSR Group 2 or 3 and DPN Group 1. Group C consisted of patients who were SSR Group 1 and DPN Group 2 or 3. Finally, Group D comprised patients who fell under SSR Group 2 or 3 and DPN Group 2 or 3.
Table 2.
Classification of patients based on NCS and SSR test results
SSR Group Total
1 2 3
DPN Group 1 49a) 10b) 12b) 71
2 15c) 4d) 5d) 24
3 33c) 20d) 36d) 89
Total 97 34 53 184

NCS, nerve conduction study; SSR, sympathetic skin response; DPN, diabetic peripheral neuropathy.

a)Group A (both normal NCS, SSR), b)Group B (SSR abnormal only), c)Group C (NCS abnormal only), d)Group D (both abnormal NCS, SSR).

Download Table

The rationale behind consolidating the original nine groups into four categories in the table was to facilitate statistical analysis. This grouping strategy was employed to enhance the feasibility and interpretability of the statistical analyses conducted on the data.

DPN groups

We first performed an ANOVA by dividing the participants into DPN groups (Table 3). Significant differences were found between DPN Groups 1 and 3. DPN Group 1 had higher total cholesterol and low density lipoprotein (LDL)-cholesterol levels (p<0.05), while HbA1c levels and the duration of diabetes were significantly higher in DPN Group 3 (p<0.05). Additionally, DPN Group 3 had a greater height compared to DPN Group 1 (p<0.05). After adjusting for sex, age, and duration of diabetes, no significant differences were observed in total cholesterol levels (p>0.05). However, triglyceride levels were higher in DPN Group 1 than in DPN Group 3, although still within the normal range (p<0.05). No significant differences were noted in age, high density lipoprotein (HDL)-cholesterol, weight, or body mass index (BMI) among the groups (p>0.05).
Table 3.
Physiological and demographic factors of participants by DPN stage group
DPN Group p-value
1 2 3
n Mean±SD n Mean±SD n Mean±SD
Sex (male/female) 71 (23/48) - 24 (9/15) - 89 (52/37) - 0.003**
Age (yr) 71 60.4±13.5 24 63.3±13.9 89 64.8±13.5 0.121
TC (mg/dL) 70 166.5±55.7a)  23 146.4±50.7a),b) 88 140.1±50.4b) 0.008**
TG (mg/dL) 40 156.2±80.9 16 134.9±61.7 69 128.1±54.8 0.096
HDL-cholesterol (mg/dL) 40 48.0±12.6  16 44.7±11.1 69 43.4±13.5 0.205
LDL-cholesterol (mg/dL) 40 102.3±42.4a) 16 80.6±40.7a),b) 69 77.6±38.6b) 0.009**
HbA1c (%) 61 6.9±1.4a) 24 8.1±2.2a),b) 88 9.2±2.9b) <0.001***
DurDM (yr) 48 7.2±7.7a) 23 10.0±10.0a),b) 86 13.3±10.9b) 0.003**
Height (m) 67 1.58±0.09a) 22 1.60±0.08a),b) 88 1.63±0.09b) 0.005**
Weight (kg) 67 64.5±14.1 22 67.0±10.8 88 67.1±14.4 0.475
Body mass index (kg/m2) 67 25.7±5.0 22 26.1±3.7 88 25.1±4.3 0.609

Groups sharing the same letter (e.g., a) or b)) do not differ significantly from each other according to the Tukey post hoc test (p>0.05). Groups with different letters indicate statistically significant differences (p<0.05).

DPN, diabetic peripheral neuropathy; SD, standard deviation; TC, total cholesterol; TG, triglyceride; HDL, high density lipoprotein; LDL, low density lipoprotein; DurDM, duration of diabetes.

a)Tukey post hoc test.

b)Tukey post hoc test.

**p<0.01, ***p<0.001.

Download Table

SSR groups

Next, we conducted an ANOVA by dividing the groups based on SSR classifications (Table 4). SSR Groups 2 and 3 were significantly older than Group 1 (p<0.05). Total cholesterol and LDL-cholesterol levels were higher in SSR Group 1 compared to Group 3 (p<0.05), although all values remained within the normal range. The duration of diabetes tended to be longer in groups with advanced SSR, but this was not statistically significant (p=0.053). No significant differences were found in triglyceride, HDL-cholesterol, HbA1c, height, weight, or BMI (p>0.05). After adjusting for sex, age, and duration of diabetes, no significant differences were observed in total cholesterol, triglyceride, HDL-cholesterol, LDL-cholesterol, or HbA1c levels (p>0.05).
Table 4.
Physiological and demographic factors of participants by SSR stage group
SSR Group p-value
1 2 3
n Mean±SD n Mean±SD n Mean±SD
Sex (male/female) 97 (44/53) - 34 (15/19) - 53 (25/28) - 0.958
Age (yr) 97 58.3±13.2a) 34 68.8±9.2b) 53 67.6±13.9b) <0.001***
TC (mg/dL) 95 159.9±56.0a) 34 147.0±59.8a),b) 52 137.6±41.7b) 0.048
TG (mg/dL) 62 140.5±73.1 26 133.3±55.9 37 136.9±60.6 0.892
HDL-cholesterol (mg/dL) 62 46.1±12.2 26 44.6±14.5 37 43.5±13.4 0.622
LDL-cholesterol (mg/dL) 62 96.1±44.3a) 26 80.2±42.5a),b) 37 72.8±30.5b) 0.017*
HbA1c (%) 88 8.2±2.7 34 8.7±2.7 51 8.0±2.4 0.410
DurDM (yr) 74 9.2±9.8 31 10.6±9.8 52 13.6±10.7 0.053
Height (m) 92 1.62±0.09 33 1.59±0.08 52 1.60±0.10 0.217
Weight (kg) 92 67.1±13.9 33 64.2±12.8 52 65.6±14.5 0.554
Body mass index (kg/m2) 92 25.5±4.7 33 25.4±4.9 52 25.4±4.0 0.990

Groups sharing the same letter (e.g., a) or b)) do not differ significantly from each other according to the Tukey post hoc test (p>0.05). Groups with different letters indicate statistically significant differences (p<0.05).

SSR, sympathetic skin response; SD, standard deviation; TC, total cholesterol; TG, triglyceride; HDL, high density lipoprotein; LDL, low density lipoprotein; DurDM, duration of diabetes.

a)Tukey post hoc test.

b)Tukey post hoc test.

*p<0.05, ***p<0.001.

Download Table

Grouped by DPN, SSR groups

We performed an ANOVA after dividing the patients into four groups: Group A (both NCS and SSR normal), Group B (SSR abnormal only), Group C (NCS abnormal only), and Group D (both NCS and SSR abnormal) (Table 5).
Table 5.
Physiological and demographic factors of participants by group
Group A Group B Group C Group D p-value
n Mean±SD n Mean±SD n Mean±SD n Mean±SD
Sex (male/female) 49 (19/30) - 22 (4/18) - 48 (25/23) - 65 (36/29) - 0.012
Age (yr) 49 57.0±13.2a) 22 67.9±11.3b) 48 59.6±13.2a) 65 68.2±12.6b) <0.001***
TC (mg/dL) 48 171.9±60.1a) 22 154.6±43.4a),b) 47 147.7±49.2a),b) 64 136.8±50.9b) 0.006**
TG (mg/dL) 27 162.0±83.6 13 144.2±76.8 35 123.9±59.9 50 133.1±53.2 0.133
HDL-cholesterol (mg/dL) 27 49.0±11.6 13 45.9±14.7 35 43.9±12.3 50 43.4±13.6 0.314
LDL-cholesterol (mg/dL) 27 105.0±47.2a) 13 96.6±30.9a),b) 35 89.2±41.2a),b) 50 70.4±35.3b) 0.002**
HbA1c (%) 40 7.0±1.7a) 21 6.8±0.9a) 48 9.2±3.0b) 64 8.8±2.7b) <0.001***
DurDM (yrs) 28 6.5±7.7a) 20 8.1±7.6a),b) 46 10.8±10.6a),b) 63 13.9±10.8b) 0.006**
Height (m) 46 1.61±0.08a) 21 1.54±0.08b) 46 1.64±0.09a) 64 1.62±0.09a) <0.001***
Weight (kg) 46 66.5±15.1 21 60.1±10.7 46 67.7±12.8 64 66.7±14.4 0.188
Body mass index (kg/m2) 46 25.8±5.5 21 25.5±4.0 46 25.2±3.8 64 25.4±4.5 0.955

Groups sharing the same letter (e.g., a) or b)) do not differ significantly from each other according to the Tukey post hoc test (p>0.05). Groups with different letters indicate statistically significant differences (p<0.05).

SD, standard deviation; TC, total cholesterol; TG, triglyceride; HDL, high density lipoprotein; LDL, low density lipoprotein; DurDM, duration of diabetes.

a)Tukey post hoc test.

b)Tukey post hoc test.

**p<0.01, ***p<0.001.

Download Table

Significant differences were found between the groups: Group D had lower total cholesterol and LDL-cholesterol levels compared to Group A (p<0.05), although all values were within the normal range. HbA1c levels were higher in Groups C and D than in Groups A and B (p<0.05), and Group D had a longer duration of diabetes compared to Group A (p<0.05). Additionally, Group B was shorter in height than Groups A, C, and D (p<0.05). No significant differences were observed in triglyceride, HDL-cholesterol, weight, or BMI among the groups (p>0.05).

ANCOVA analysis

We performed an ANCOVA on Tables 3, 4, and 5 to assess the influence of sex, age, and duration of diabetes as covariates. When comparing the DPN groups, total cholesterol showed no significant differences after adjustment (p>0.05). Triglyceride levels were significantly higher in DPN Group 1 compared to DPN Group 3 (p<0.05), although the values remained within the normal range (50–200 mg/dL). HbA1c levels were significantly higher in DPN Group 3 compared to Groups 1 and 2 (Group 1: 7.2±0.4, Group 2: 8.0±0.5, Group 3: 9.3±0.3; p<0.05). No significant differences were observed in HDL-cholesterol and LDL-cholesterol levels among the DPN groups (p>0.05). For the SSR groups, there were no significant differences in total cholesterol, triglyceride, HDL-cholesterol, LDL-cholesterol, or HbA1c levels after adjustment (p>0.05).
Additionally, using the least significant difference post hoc test, we examined Groups A–D after adjusting for age, duration of diabetes, and sex. Significant differences were observed in triglyceride and HbA1c levels (p<0.05). HbA1c was better controlled in Groups A and B compared to Groups C and D (Group A: 7.3±0.5, Group B: 7.1±0.6, Group C: 9.1±0.4, Group D: 9.0±0.3; p<0.05). While triglyceride levels showed significant differences, the values within each group remained within the normal range. No significant differences were found in total cholesterol, HDL-cholesterol, or LDL-cholesterol levels after adjustment (p>0.05), indicating minimal variation in these parameters.
Go to : Goto

DISCUSSION

Demographic factors

When comparing age among the groups, we observed that Groups B and D were significantly older than Groups A and C. This suggests a tendency for decreased SSR in relatively older diabetic patients.
Some studies have indicated that taller height may be associated with increased vulnerability to diabetic neuropathy in diabetic patients [12,13]. Although research on the relationship between SSR and height is limited, Levy et al. [14] reported no significant correlation between height and SSR latency or amplitude in their study on quantitative measures of SSR in diabetes. Additionally, while not specifically focusing on diabetic patients, Emad et al. [15] found that individuals with a height of 1.7 m or more exhibited significantly longer SSR latency compared to those shorter than 1.7 m. Given that diabetic neuropathy is often related to nerve length, it can be speculated that individuals with shorter limb lengths might experience slower neuropathy progression. In Table 3, DPN groups showed significant progression in individuals with taller heights. However, there was no significant difference observed among the SSR groups in Table 5.
The finding that Group B has a significantly lower height than Groups A, C, and D suggests that further research is needed to draw meaningful conclusions. This difference, along with the fact that Groups C and D had greater heights, could imply that taller individuals might be more susceptible to typical diabetic neuropathy risk factors. On the other hand, when considering the relationship with Group A, we noticed that individuals with shorter height did not show diabetic neuropathy progression but did exhibit a decrease in SSR. This raises the possibility that other factors may be influencing these outcomes. The lower height observed in Group B could be due to the higher proportion of females in this group compared to the others, as gender differences likely have a significant impact on height. Future research with balanced gender ratios is necessary to validate these findings. Additionally, studies exploring the relationship between height and latency/amplitude values could provide valuable insights into the complex interactions among height, diabetic neuropathy, and SSR.
In a study by Oh et al. [16], higher BMI values, which are associated with obesity and insulin resistance, were reported to influence the progression of DPN. However, Smith and Singleton [17] found no significant correlation between BMI and the progression of DPN, highlighting conflicting results that suggest multiple factors influence DPN. In our study, BMI was not used as a covariate in the adjusted analysis (which included age, sex, and duration of diabetes), and no significant differences in BMI were observed between the DPN or SSR groups in the crude analysis. These findings suggest that BMI may not be a key factor in the development or progression of DPN, including both large and small fiber neuropathy, in the population studied. Understanding the relationship between body weight, BMI, and their influence on DPN and SSR groups could provide valuable insights for developing effective diabetes prevention and management strategies. Our study population aligns with other studies that did not include BMI as a control variable, suggesting that the lack of BMI adjustment may contribute to population bias, potentially leading to divergent outcomes across different studies.
In our analysis of differences among SSR groups within DPN Group 1, aside from age, we found that age appears to influence SSR progression in well-controlled DM groups. We observed a tendency for increased age in SSR-deteriorated Groups 2 and 3 compared to Group 1. The limited sample size of this study suggests a need for further research to validate these findings.

The other factors

In previous studies, the relationship between type 2 diabetic neuropathy and total cholesterol or LDL-cholesterol levels has shown conflicting results, with some highlighting the importance of lipid control through medication or therapeutic exercise. While some studies reported a lack of significant association between diabetic neuropathy and total cholesterol or LDL-cholesterol levels [18,19], others suggested that increasing LDL-cholesterol levels may contribute to the progression of diabetic neuropathy [20]. In our study, we observed that total cholesterol and LDL-cholesterol levels in Group D were significantly lower compared to Group A. This significant decrease in cholesterol levels in the group showing neuropathy progression aligns with another study that visualized in vivo findings, demonstrating that lower LDL-cholesterol levels in type 2 diabetic neuropathy patients were associated with peripheral nerve enlargement and a higher lipid-equivalent lesion burden [21]. This finding supports the notion that lower total cholesterol and LDL-cholesterol levels may adversely affect nerve enlargement and regeneration, possibly contributing to peripheral nerve damage.
Although we did not investigate this specifically, it is possible that patients in Group D had better compliance with dyslipidemia medication, which could explain their lower cholesterol levels. However, the ANCOVA results, which adjusted for sex, age, and duration of the disease, did not show significant differences between Groups A to D.
Our study also found that both the progression of DPN stages and the deterioration of SSR were associated with a longer duration of diabetes. Group D, in particular, had a significantly longer duration of diabetes compared to Group A, indicating a link between prolonged diabetes and more advanced neuropathy. This suggests that a longer duration of diabetes may be associated with the simultaneous progression of both DPN and SSR, implying a higher likelihood of neuropathy as the disease persists over time.
Previous studies have demonstrated an association between elevated HbA1c levels and the progression and severity of diabetic neuropathy in type 2 diabetes [22-24]. Ashar et al. [25] also observed a positive correlation between HbA1c and SSR latency. Although not statistically significant, their study reported a trend where decreasing SSR amplitude was associated with higher HbA1c levels. However, research exploring the relationship between SSR testing, small fiber neuropathy, and HbA1c levels remains limited. Therefore, further investigations are needed to clarify this connection, which could provide valuable insights for preventing and managing diabetic neuropathy in individuals with type 2 diabetes.
Our findings suggest that age had a more substantial effect on SSR results than HbA1c levels, as observed in the analysis comparing Groups A–D, where the progression of diabetic neuropathy was more pronounced in groups with higher HbA1c levels, aligning with our DPN classification [26]. When comparing based on DPN groups, we found that higher HbA1c levels had a significant impact on the progression of neuropathy. However, when comparing based on SSR groups, HbA1c levels did not show statistical significance. Additionally, HbA1c levels in Groups C and D were significantly higher than in Groups A and B, suggesting that elevated HbA1c levels may contribute to the worsening of DPN. However, HbA1c levels may not have a substantial impact on the results of the SSR group.
This implies that controlling and managing HbA1c levels may play a crucial role in preventing or mitigating the progression of DPN but might not significantly influence the progression of SSR. Therefore, our study confirms that changes in HbA1c have a significant impact on the progression of DPN. In contrast, no significant differences in HbA1c levels were observed among the SSR groups. Previous studies comparing SSR between healthy individuals and diabetic patients showed changes according to the duration of the disease in uncontrolled DM patients (HbA1c: 11.3±2.8) [14], which differs from our study participants. This suggests that small unmyelinated nerve fibers may be functionally less affected by glucose control than myelinated fibers.

Limitation

Given that our study is cross-sectional, it is important to acknowledge that it does not capture changes in the diabetic condition over time, as a longitudinal study would. Additionally, our study is limited to patients who underwent NCS and SSR testing, introducing the potential for population bias. Demographic factors such as age and gender distribution may slightly differ from the overall diabetic population in Korea.
It is also essential to consider the influence of other physiological factors on the test results, making the establishment of definitive normal ranges challenging. Therefore, fully replacing tests such as the thermoregulatory sweat test and the quantitative sudomotor axon reflex test remains difficult due to these limitations.
Since there were no cases where the SSR response originated exclusively from both upper limbs while being absent in the lower limbs, we did not create a separate category based on this criterion. Additionally, the presence or absence of evoked responses was not asymmetric in either limb.
While the SSR test is a valuable tool for autonomic nervous system evaluation, its results can be influenced by factors such as electrode placement, individual sensitivity, body temperature, and emotional states. Similarly, the use of lipid-lowering medications (67.4% of patients) could have confounded our results. Further research would be needed to control these variables and understand their impact more clearly.
The limited number of studies investigating the correlation between BMI and SSR highlights the need for further research in this area. Future studies should explore this correlation in larger, more diverse populations to better understand how BMI influences SSR.
Additional investigations are warranted to clarify the relationship between HbA1c levels and the progression of DPN and SSR groups. The differential impact of glucose control on small unmyelinated nerve fibers versus myelinated fibers should be explored through histological studies.
Furthermore, including patients who were randomly selected and had undergone treatment for several years, rather than focusing on the onset of type 2 diabetes, may limit the significance of the findings. Including patients at various stages of diabetes management could introduce confounding variables that affect the results. Therefore, caution is necessary when interpreting the outcomes. Future research should target patients in the early stages of type 2 diabetes and conduct long-term follow-up to gain a better understanding of disease progression and treatment effects over time.

Conclusions

In this study, we established correlations between various demographic characteristics among patient groups classified based on DPN and SSR. For NCS, factors such as glycemic control and duration of diabetes played a significant role in neuropathy, particularly in large fiber nerves. In the assessment of SSR, age emerged as the most significant factor in the combined evaluation of both large and small fiber types, while the duration of diabetes also had a notable impact.
Among the various known factors, including age, sex, height, weight, and exercise indicators (cholesterol), only age-related factors showed a significant influence in this study. These findings suggest that multicenter studies or longitudinal follow-up research may be necessary.
Go to : Goto

Notes

CONFLICTS OF INTEREST

No potential conflict of interest relevant to this article was reported.

FUNDING INFORMATION

This study was supported by Inha University research grant.

AUTHOR CONTRIBUTION

Conceptualization: Kim CH. Data curation: Lee Y. Formal analysis: Lee Y. Investigation: Lee Y, Kim CH. Methodology: Lee Y, Kim CH. Visualization: Lee Y. Supervision: Kim CH. Validation: Kim CH. Writing – original draft: Lee Y, Kim CH. Writing – review & editing: Lee Y, Kim SH, Kim CH. Approval of final manuscript: all authors.

Go to : Goto

REFERENCES

1. Vinik AI, Mehrabyan A. Diabetic neuropathies. Med Clin North Am. 2004; 88:947–99. DOI: 10.1016/j.mcna.2004.04.009. PMID: 15308387.
crossref
2. Yang H, Sloan G, Ye Y, Wang S, Duan B, Tesfaye S, et al. New perspective in diabetic neuropathy: from the periphery to the brain, a call for early detection, and precision medicine. Front Endocrinol (Lausanne). 2020; 10:929. DOI: 10.3389/fendo.2019.00929. PMID: 32010062.
crossref
3. Kucera P, Goldenberg Z, Kurca E. Sympathetic skin response: review of the method and its clinical use. Bratisl Lek Listy. 2004; 105:108–16. PMID: 15253529.
4. Vetrugno R, Liguori R, Cortelli P, Montagna P. Sympathetic skin response: basic mechanisms and clinical applications. Clin Auton Res. 2003; 13:256–70. DOI: 10.1007/s10286-003-0107-5. PMID: 12955550.
5. Braune HJ, Horter C. Sympathetic skin response in diabetic neuropathy: a prospective clinical and neurophysiological trial on 100 patients. J Neurol Sci. 1996; 138:120–4. DOI: 10.1016/0022-510x(96)00023-8. PMID: 8791249.
crossref
6. Shin JB, Kim C, Lee JH, Chun S. Sympathetic skin response in diabetic patients. J Korean Acad Rehab Med. 1994; 18:286–92.
7. Lee IS, Kim HS, Ahn KH. Sympathetic skin response in diabetes mellitus. J Korean Acad Rehabil Med. 1993; 17:165–76.
8. Müller G, Parfentyeva E, Olschewsky J, Bornstein SR, Schwarz PE. Assessment of small fiber neuropathy to predict future risk of type 2 diabetes. Prim Care Diabetes. 2013; 7:269–73. DOI: 10.1016/j.pcd.2013.08.001. PMID: 24076379.
crossref
9. Liu X, Xu Y, An M, Zeng Q. The risk factors for diabetic peripheral neuropathy: a meta-analysis. PLoS One. 2019; 14:e0212574. DOI: 10.1371/journal.pone.0212574. PMID: 30785930.
crossref
10. Dyck PJ, Giannini C. Pathologic alterations in the diabetic neuropathies of humans: a review. J Neuropathol Exp Neurol. 1996; 55:1181–93. DOI: 10.1097/00005072-199612000-00001. PMID: 8957441.
11. Han EY, Kim CH. Reproducibility of nerve conduction study parameters: a comparison of normal and diabetic patients with neuropathy. J Korean Acad Rehabil Med. 2007; 31:699–704.
12. Feldman EL, Callaghan BC, Pop-Busui R, Zochodne DW, Wright DE, Bennett DL, et al. Diabetic neuropathy. Nat Rev Dis Primers. 2019; 5:41. DOI: 10.1038/s41572-019-0092-1. PMID: 31197153.
crossref
13. Román-Pintos LM, Villegas-Rivera G, Rodríguez-Carrizalez AD, Miranda-Díaz AG, Cardona-Muñoz EG. Diabetic polyneuropathy in type 2 diabetes mellitus: inflammation, oxidative stress, and mitochondrial function. J Diabetes Res. 2016; 2016:3425617. DOI: 10.1155/2016/3425617. PMID: 28058263.
crossref
14. Levy DM, Reid G, Rowley DA, Abraham RR. Quantitative measures of sympathetic skin response in diabetes: relation to sudomotor and neurological function. J Neurol Neurosurg Psychiatry. 1992; 55:902–8. DOI: 10.1136/jnnp.55.10.902. PMID: 1331334.
crossref
15. Emad M, Roshanzamir S, Dabbaghmanesh A, Ghasempoor MZ, Eivazlou H. Inclusion of height and limb length when interpreting sympathetic skin response. Iran J Med Sci. 2016; 41:48–52. PMID: 26722145.
16. Oh TJ, Lee JE, Choi SH, Jang HC. Association between body fat and diabetic peripheral neuropathy in middle-aged adults with type 2 diabetes mellitus: a preliminary report. J Obes Metab Syndr. 2019; 28:112–7. DOI: 10.7570/jomes.2019.28.2.112. PMID: 31294343.
crossref
17. Smith AG, Singleton JR. Obesity and hyperlipidemia are risk factors for early diabetic neuropathy. J Diabetes Complications. 2013; 27:436–42. DOI: 10.1016/j.jdiacomp.2013.04.003. PMID: 23731827.
crossref
18. Zhang H, Chen Y, Zhu W, Niu T, Song B, Wang H, et al. The mediating role of HbA1c in the association between elevated low-density lipoprotein cholesterol levels and diabetic peripheral neuropathy in patients with type 2 diabetes mellitus. Lipids Health Dis. 2023; 22:102. DOI: 10.1186/s12944-023-01865-5. PMID: 37443036.
crossref
19. Chang KC, Pai YW, Lin CH, Lee IT, Chang MH. The association between hyperlipidemia, lipid-lowering drugs and diabetic peripheral neuropathy in patients with type 2 diabetes mellitus. PLoS One. 2023; 18:e0287373. DOI: 10.1371/journal.pone.0287373. PMID: 37319238.
crossref
20. Cai Z, Yang Y, Zhang J. A systematic review and meta-analysis of the serum lipid profile in prediction of diabetic neuropathy. Sci Rep. 2021; 11:499. DOI: 10.1038/s41598-020-79276-0. PMID: 33436718.
crossref
21. Jende JME, Groener JB, Rother C, Kender Z, Hahn A, Hilgenfeld T, et al. Association of serum cholesterol levels with peripheral nerve damage in patients with type 2 diabetes. JAMA Netw Open. 2019; 2:e194798. DOI: 10.1001/jamanetworkopen.2019.4798. PMID: 31150078.
crossref
22. Nozawa K, Ikeda M, Kikuchi S. Association between HbA1c levels and diabetic peripheral neuropathy: a case-control study of patients with type 2 diabetes using claims data. Drugs Real World Outcomes. 2022; 9:403–14. DOI: 10.1007/s40801-022-00309-3. PMID: 35725984.
crossref
23. Lai YR, Chiu WC, Huang CC, Tsai NW, Wang HC, Lin WC, et al. HbA1C variability is strongly associated with the severity of peripheral neuropathy in patients with type 2 diabetes. Front Neurosci. 2019; 13:90. DOI: 10.3389/fnins.2019.00090. PMID: 30814926.
crossref
24. Lee WJ, Jang S, Lee SH, Lee HS. Correlation between the severity of diabetic peripheral polyneuropathy and glycosylated hemoglobin levels: a quantitative study. Ann Rehabil Med. 2016; 40:263–70. DOI: 10.5535/arm.2016.40.2.263. PMID: 27152276.
crossref
25. Ashar I, Yudiyanta , Asmedi A. Correlation of HbA1c level with electrodiagnostic parameters of diabetic autonomic neuropathy. Berkala Neurosains. 2020; 19:120–5.
26. Drory VE, Korczyn AD. Sympathetic skin response: age effect. Neurology. 1993; 43:1818–20. DOI: 10.1212/wnl.43.9.1818. PMID: 8414038.
Go to : Goto

TOOLS
Similar articles