INTRODUCTION
METHODS
Patient selection and data collection
Definitions and outcomes of interest
RET mutation and screening
Statistical analysis
RESULTS
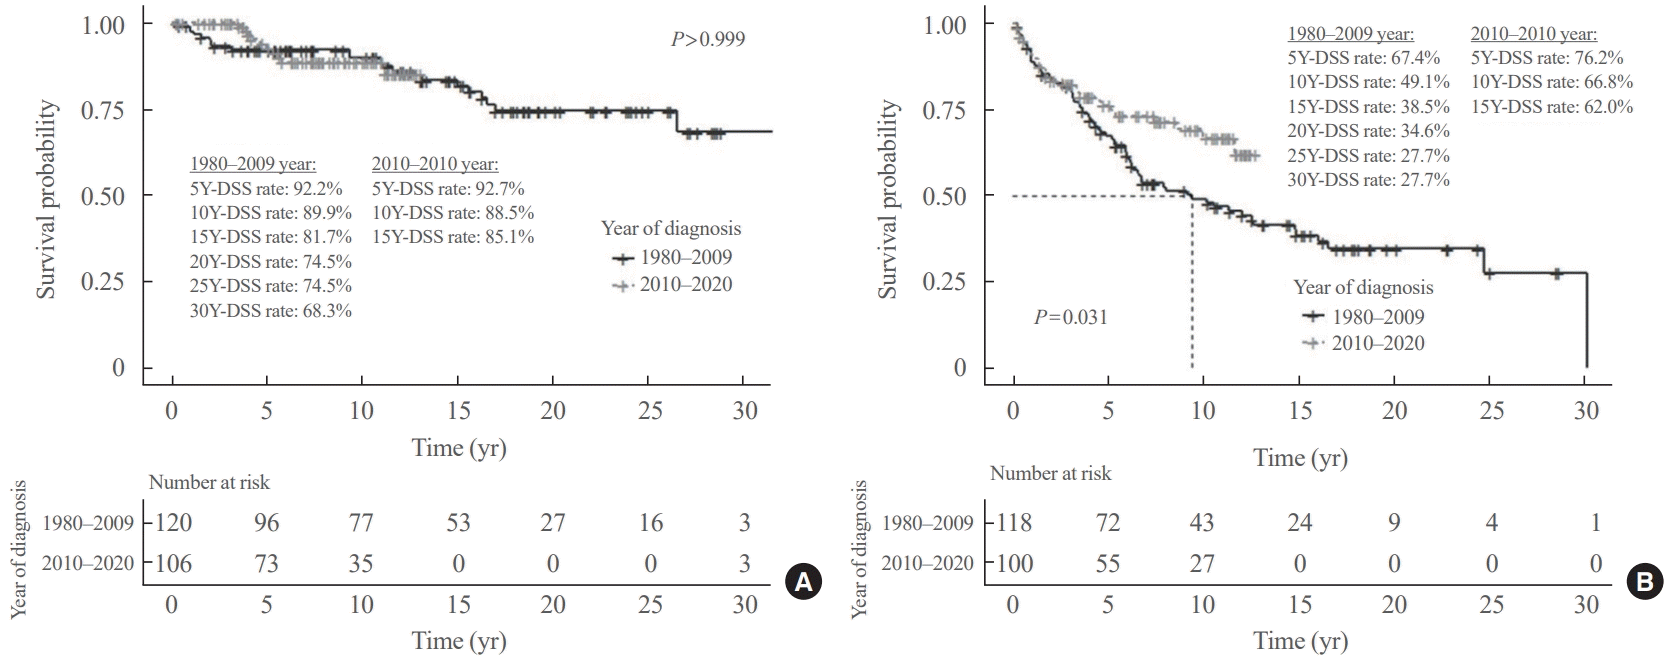
Clinical characteristics and long-term oncologic outcomes over time
Table 1.
| Characteristic | Total (n=226) | 1980–2009 (n=120) | 2010–2020 (n=106) | P value |
|---|---|---|---|---|
| Female sex | 144 (64) | 78 (65) | 66 (62) | 0.669 |
| Age, yr | 48.1±15.5 | 44.9±14.8 | 51.7±15.5 | <0.001 |
| Hereditary | 53 (24) | 27 (23) | 26 (25) | 0.719 |
| RET mutation, positive/tested | 46 (20)/132 (58) | 22 (18)/47 (39) | 24 (23)/85 (80) | 0.524/<0.001 |
| Operation | ||||
| Surgical extent, less than TT/TT | 17 (8)/209 (92) | 15 (13)/105 (88) | 2 (2)/104 (98) | 0.003 |
| Lymph node extenta, CND/LND/none | 88 (42)/83 (40)/39 (19) | 26 (25)/45 (42)/35 (33) | 62 (58)/38 (36)/4 (4) | <0.001 |
| Pathology | ||||
| Tumor size in greatest length, cm | 2.1±1.8 | 2.3±1.5 | 2.0±2.0 | 0.003 |
| Tumor size, <2 cm/≥2 cm | 111 (49)/85 (38) | 43 (36)/52 (43) | 68 (64)/33 (31) | 0.003 |
| ETE, none/microscopic/gross | 129 (68)/41 (22)/19 (10) | 62 (69)/19 (21)/9 (10) | 67 (68)/22 (22)/10 (10) | 0.981 |
| Lymph node metastasisb, none/CN/LN | 64 (28)/42 (19)/56 (25) | 20 (17)/16 (13)/29 (24) | 44 (42)/26 (25)/27 (25) | 0.072 |
| Resection margin positive status | 12 (6) | 7 (8) | 5 (5) | 0.805 |
| Combined pathology, PTC/FTC | 28 (14)/2 (1) | 8 (8)/1 (1) | 20 (19)/1 (1) | 0.006 |
| Initial distant metastasis | 8 (4) | 2 (2) | 6 (6) | 0.151 |
| Postoperative neck radiotherapy | 41 (18) | 22 (18) | 19 (18) | 0.994 |
| Recurrence outcomes | ||||
| Follow-up period, mo | 70.5 (36.0–134.5) | 74.5 (37.75–158.3) | 64.5 (34.5–119.3) | <0.001 |
| Recurrence/persistence | 92 (41)/8 (4) | 65 (54)/2 (2) | 27 (25)/6 (6) | <0.001 |
| Cumulative recurrence rate at 5/10/20/30 years, % | 28.9/43.9/59.8/67.9 | 32.6/50.9/65.4/72.3 | 23.8/33.2/-/- | 0.031 |
| Sites of recurrencec | ||||
| LN/mediastinum/distant organs | 83 (89)/25 (27)/69 (74) | 60 (91)/18 (27)/44 (67) | 23 (85)/7 (26)/25 (93) | 0.265 |
| Single/multiple | 44 (44)/56 (56) | 33 (49)/35 (51) | 11 (34)/21 (66) | 0.186 |
| Final disease status, BCR/BCD/CD | 113 (50)/40 (18)/41 (18) | 50 (42)/26 (22)/22 (18) | 63 (59)/14 (13)/19 (18) | 0.139 |
| Survival outcomes | ||||
| Follow-up period, mo | 116.0 (57.8–170.0) | 157.5 (72.8–227.3) | 89.5 (48.3–132.8) | <0.001 |
| Mortality, MTC-specific/all causes | 32 (14)/43 (19) | 22 (18)/31 (26) | 10 (9)/12 (11) | 0.016/0.005 |
| Cumulative disease specific death rate at 5/10/20/30 years, % | 7.3/10.6/25.7/31.9 | 7.8/10.1/25.5/31.7 | 7.3/11.5/-/- | 0.995 |
Values are expressed as number (%), mean±standard deviation, or median (interquartile range).
RET, rearranged during transfection; TT, total thyroidectomy; CND, central node dissection; LND, lateral node dissection; ETE, extrathyroidal extension; CN, central node; LN, lateral node; PTC, papillary thyroid carcinoma; FTC, follicular thyroid carcinoma; BCR, biochemical remission; BCD, biochemical disease; CD, clinical disease; MTC, medullary thyroid carcinoma.
a Available information for 210 patients (106 patients in the 1980–2009 period and 104 patients in the 2010–2020 period);
b Available information for 166 patients (67 patients in the 1980–2009 period and 99 patients in the 2010–2020 period);
c Percentages are relative to only 93 recurrent patients (66 patients in the 1980–2009 period and 27 patients in the 2010–2020 period). Data includes cases with recurrence at multiple sites, with each site counted separately, which may have resulted in duplicate counts. Specific recurrences to distant organs are summarized in Supplemental Table S2.
Clinical characteristics according to last follow-up status
Prognostic factors for recurrence and survival
Table 2.
OS, overall survival; DSS, disease-specific survival; RFS, recurrence-free survival; DMFS, distant metastasis-free survival; HR, hazard ratio; CI, confidence interval.
a Adjusted for age, sex, hereditary/sporadic, tumor size, resection margin, lymph node metastasis, and initial distant metastasis (summarized data of multivariate analysis of model 2 in Supplemental Tables S4-S7).
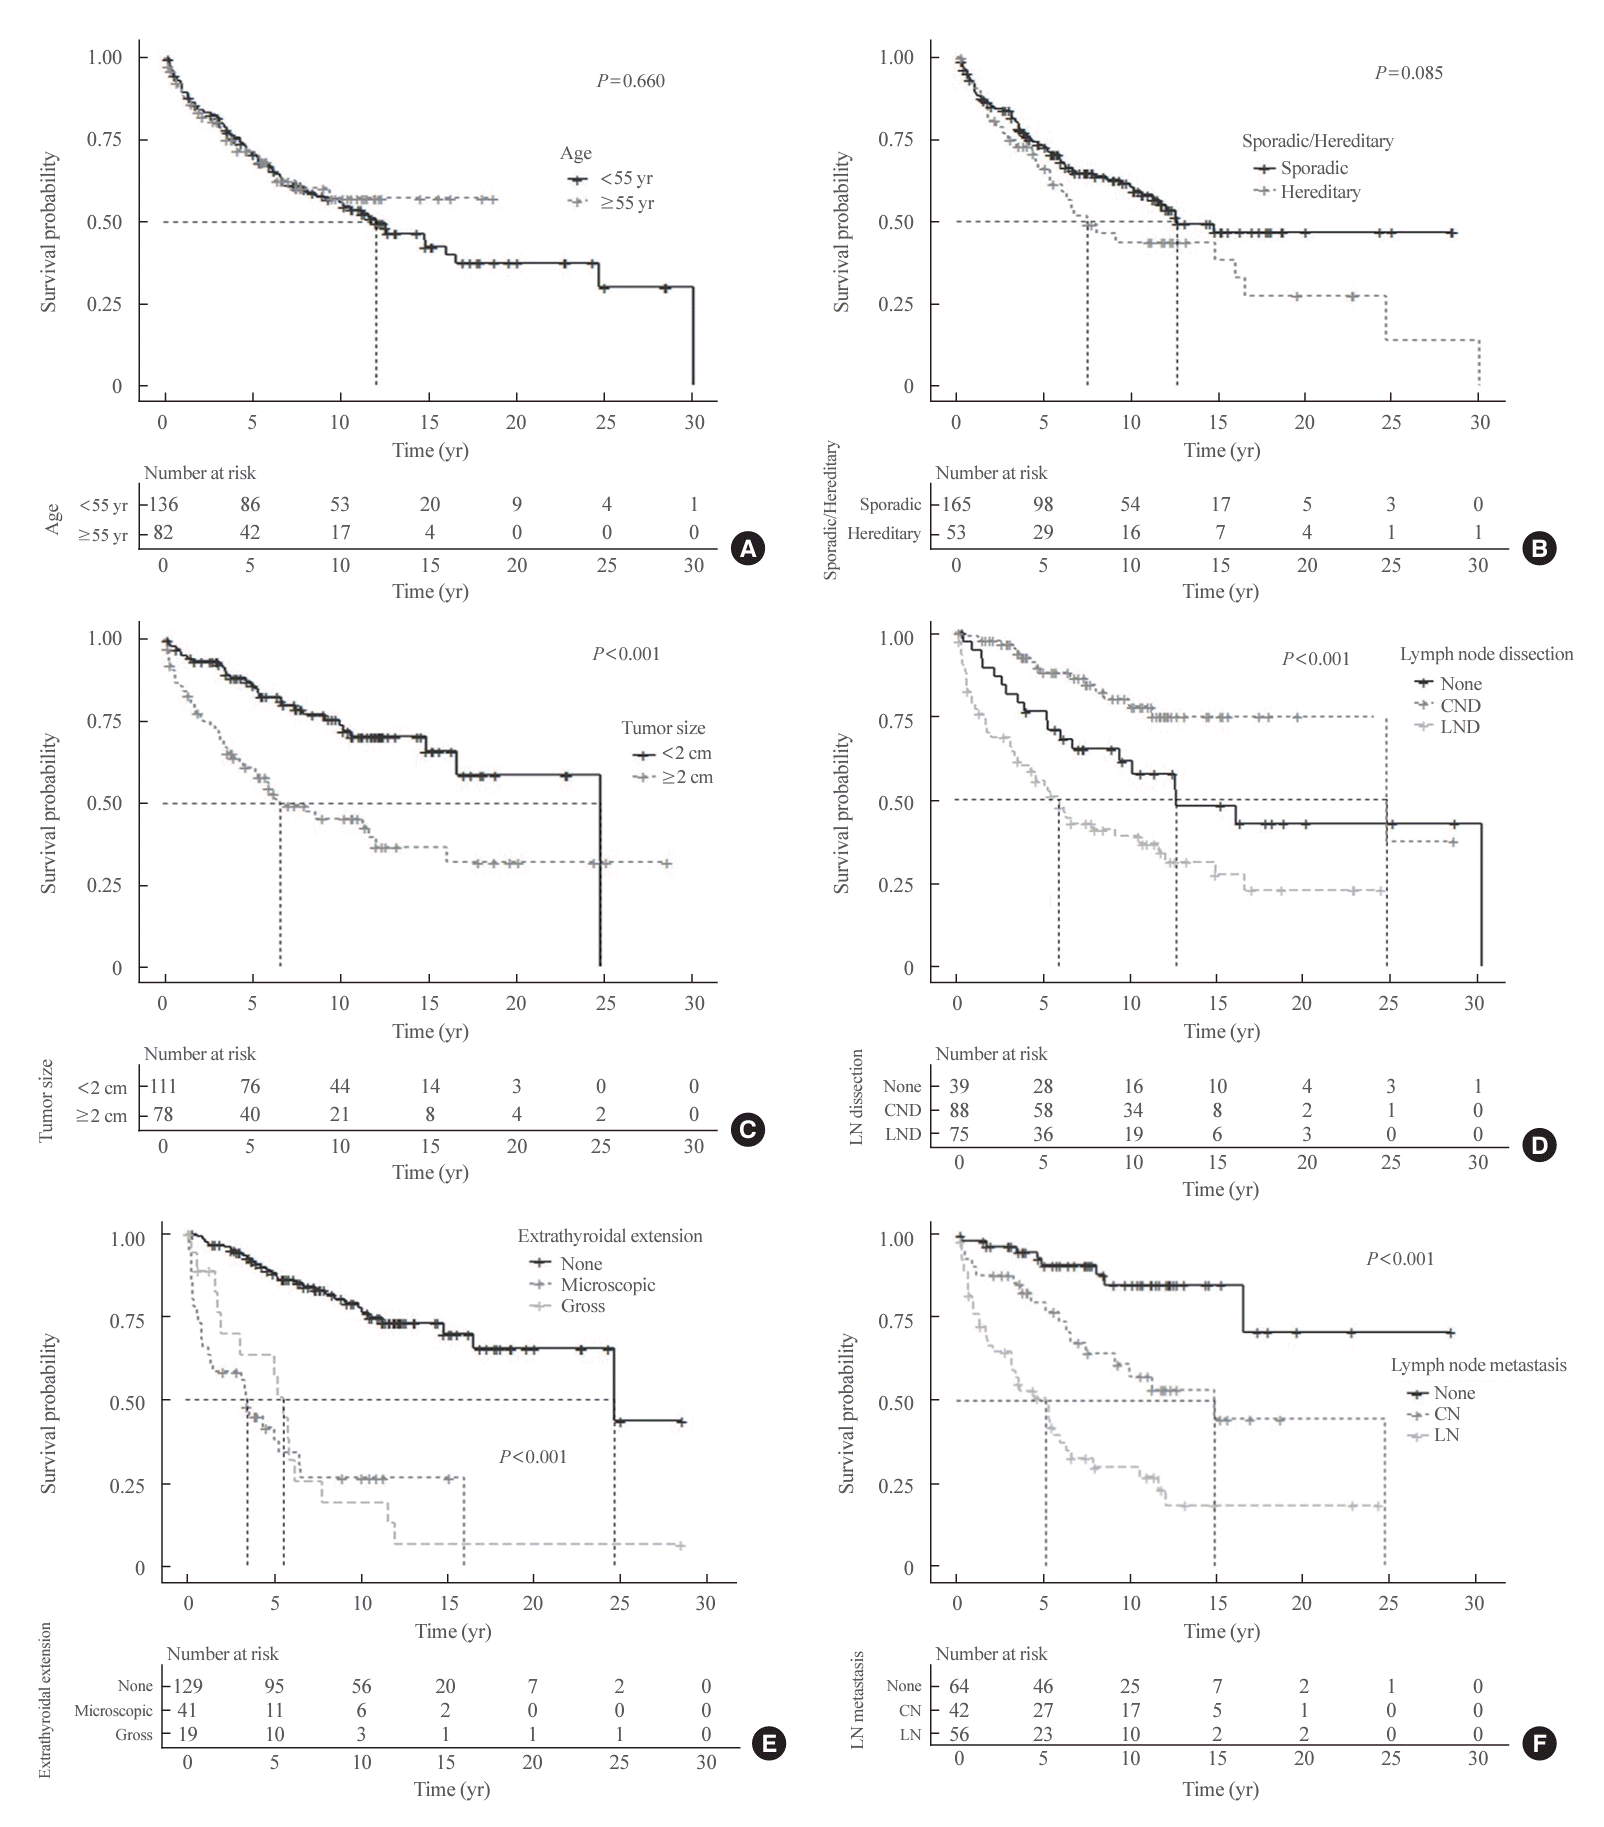
Fig. 2.
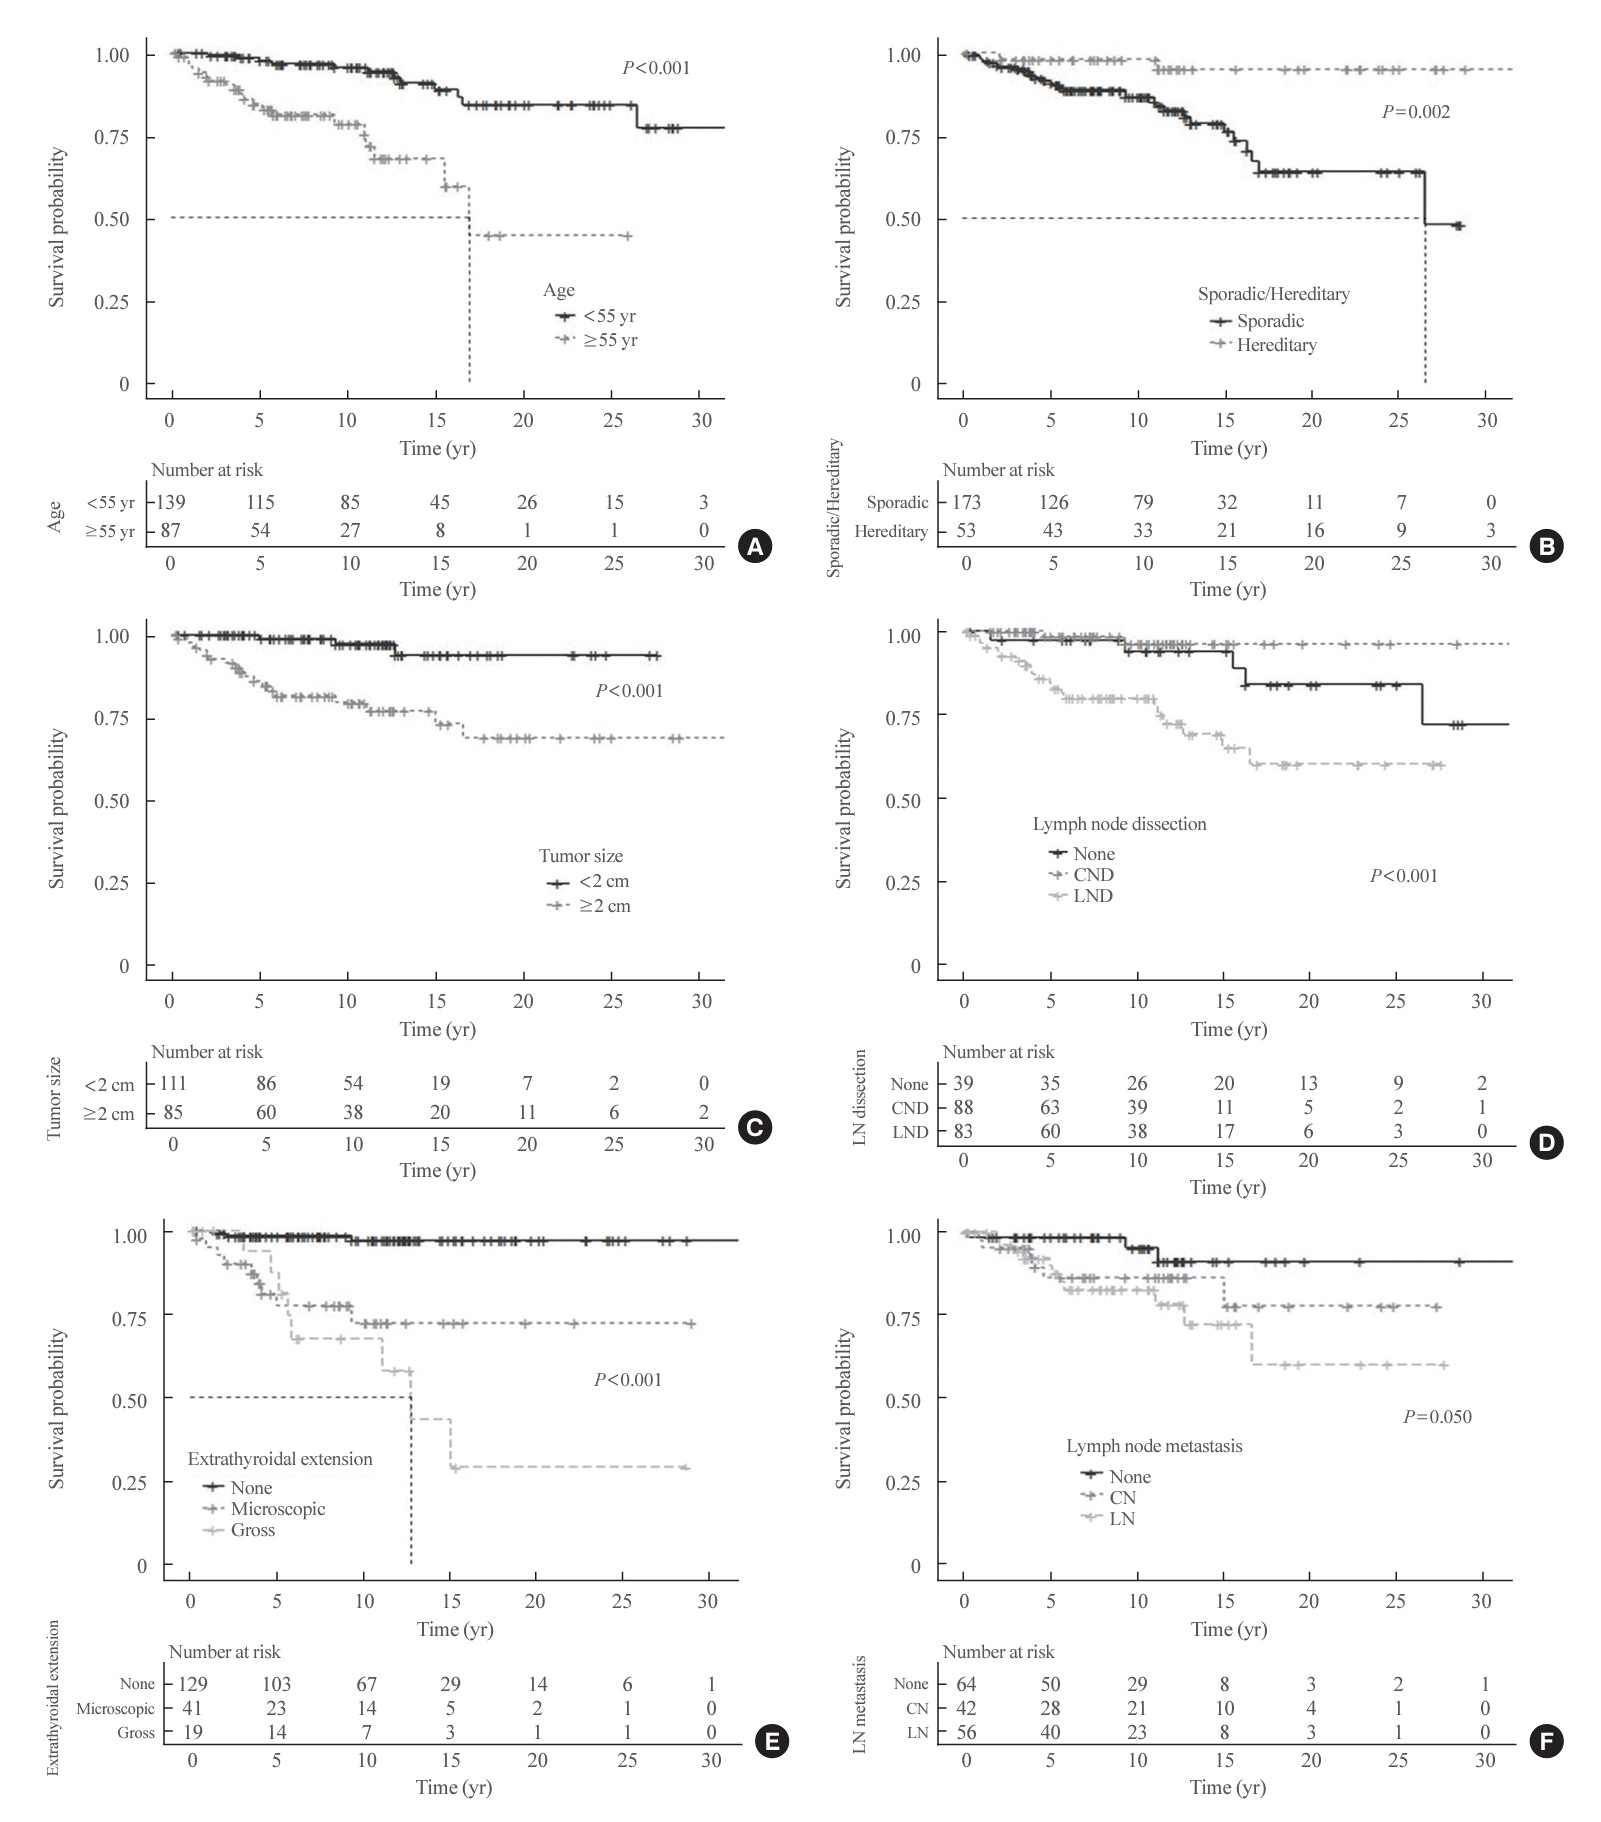
Fig. 3.
Genetic characteristics of MTC patients and clinical characteristics and survival of RET mutation-tested patients
Table 3.
| Characteristic |
Before propensity-score matching |
After propensity-score matching |
|||||||
|---|---|---|---|---|---|---|---|---|---|
| RET-negative (n=86) | RET-positive (non-screened) (n=32) | P valuea | RET-positive (screened) (n=14) | P valueb | P valuec | RET-negative (n=86) | RET-positive (non-screened) (n=32) | P value | |
| Sex | |||||||||
| Male | 28 (33) | 12 (38) | 0.614 | 7 (50) | 0.204 | 0.428 | 12 (38) | 12 (38) | >0.999 |
| Female | 58 (67) | 20 (63) | 7 (50) | 20 (63) | 20 (63) | ||||
| Age, yr | 52.3±11.8 | 39.3±13.2 | <0.001 | 25.2±16.9 | <0.001 | 0.004 | 42.4±10.2 | 39.3±13.2 | 0.216 |
| Follow-up duration, yr | 103 (61–149) | 149 (104–307) | <0.001 | 139 (59–188) | 0.201 | 0.054 | 128 (87–156) | 149 (104–307) | 0.055 |
| Medullary thyroid cancer | |||||||||
| Basal calcitonin, pg/mLd | 1,369±2,950 | 1,469±1,214 | 0.036 | 3,742±12,860 | 0.504 | 0.521 | 2,385±4,396 | 1,469±1,214 | 0.569 |
| Tumor size, cme | 1.8±1.5 | 2.5±1.4 | 0.351 | 0.8±0.6 | <0.001 | <0.001 | 2.4±2.0 | 2.5±1.4 | 0.340 |
| Tumor size >2 cm | 31/84 (37) | 15/26 (58) | 0.099 | 3/14 (21) | 0.411 | 0.062 | 15/30 (50) | 15/26 (58) | 0.759 |
| Extrathyroidal extension | 27/82 (63) | 8/25 (32) | 0.931 | 1/13 (8) | 0.064 | 0.095 | 11/30 (37) | 8/25 (32) | 0.717 |
| Lymph node metastasis | 43/77 (56) | 17/22 (77) | 0.070 | 6/14 (55) | 0.935 | 0.181 | 19/28 (68) | 17/22 (77) | 0.462 |
| Distant metastasis at diagnosis | 3/86 (4) | 0/32 (0) | 0.562 | 0/14 (0) | 0.478 | >0.999 | 2/32 (6) | 0/32 (0) | 0.492 |
| Recur | 26/83 (31) | 26/32 (81) | <0.001 | 1/14 (7) | 0.062 | 0.126 | 14/32 (44) | 26/32 (81) | 0.005 |
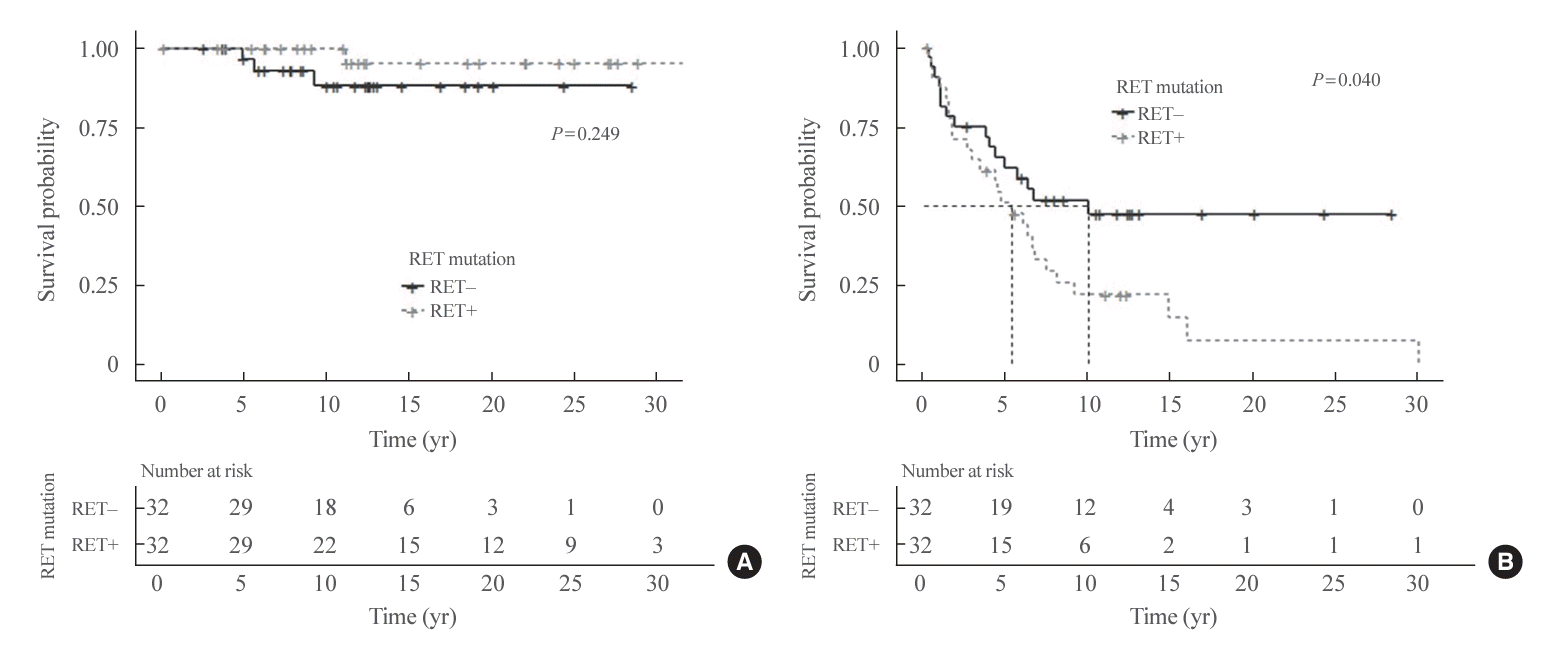
| Cumulative recurrence rate at 5/10/20/30 years, % | 21.9/31.4 /44.1/44.1 | 48.9/78.0 /92.7/92.7 | <0.001 | 0.0/90.0/90.0/90.0 | 0.063 | 0.126 | 38.0/52.5/52.5/52.5 | 48.9/78.0/92.7/92.7 | 0.040 |
| Cumulative disease-specific death rate at 5/10/20/30 years, % | 4.1/9.5/19.6/19.6 | 0.0/0.0/4.8/4.8 | 0.159 | 0.0/0.0/0.0/0.0 | 0.250 | 0.504 | 3.4/11.9/11.9/11.9 | 0.0/0.0/4.8/4.8 | 0.250 |
Values are expressed as number (%), mean±standard deviation, or median (interquartile range).
RET, rearranged during transfection.


 PDF
PDF Citation
 Print
Print


 XML Download