Journal List > Endocrinol Metab > v.39(6) > 1516089100

Hewage, Wijesekara, and Perera: Prevalence of Subclinical Hypothyroidism in a Non-Diabetic Young Female Population and Its Impact on Diabetes and Cardiometabolic Risk

Abstract

Background

We evaluated the influence of subclinical hypothyroidism (SCH) on insulin resistance (IR), cardiometabolic risk, and obesity in childbearing-age women without diabetes.

Methods

This cross-sectional investigation included 282 women, aged 18 to 35 years, from rural and suburban Sri Lanka. Anthropometric and biochemical parameters, including IR and lipid/thyroid profiles, were recorded. Data were compared between SCH and euthyroidism (EU) for controls (normal weight) and cases (overweight/obese).

Results

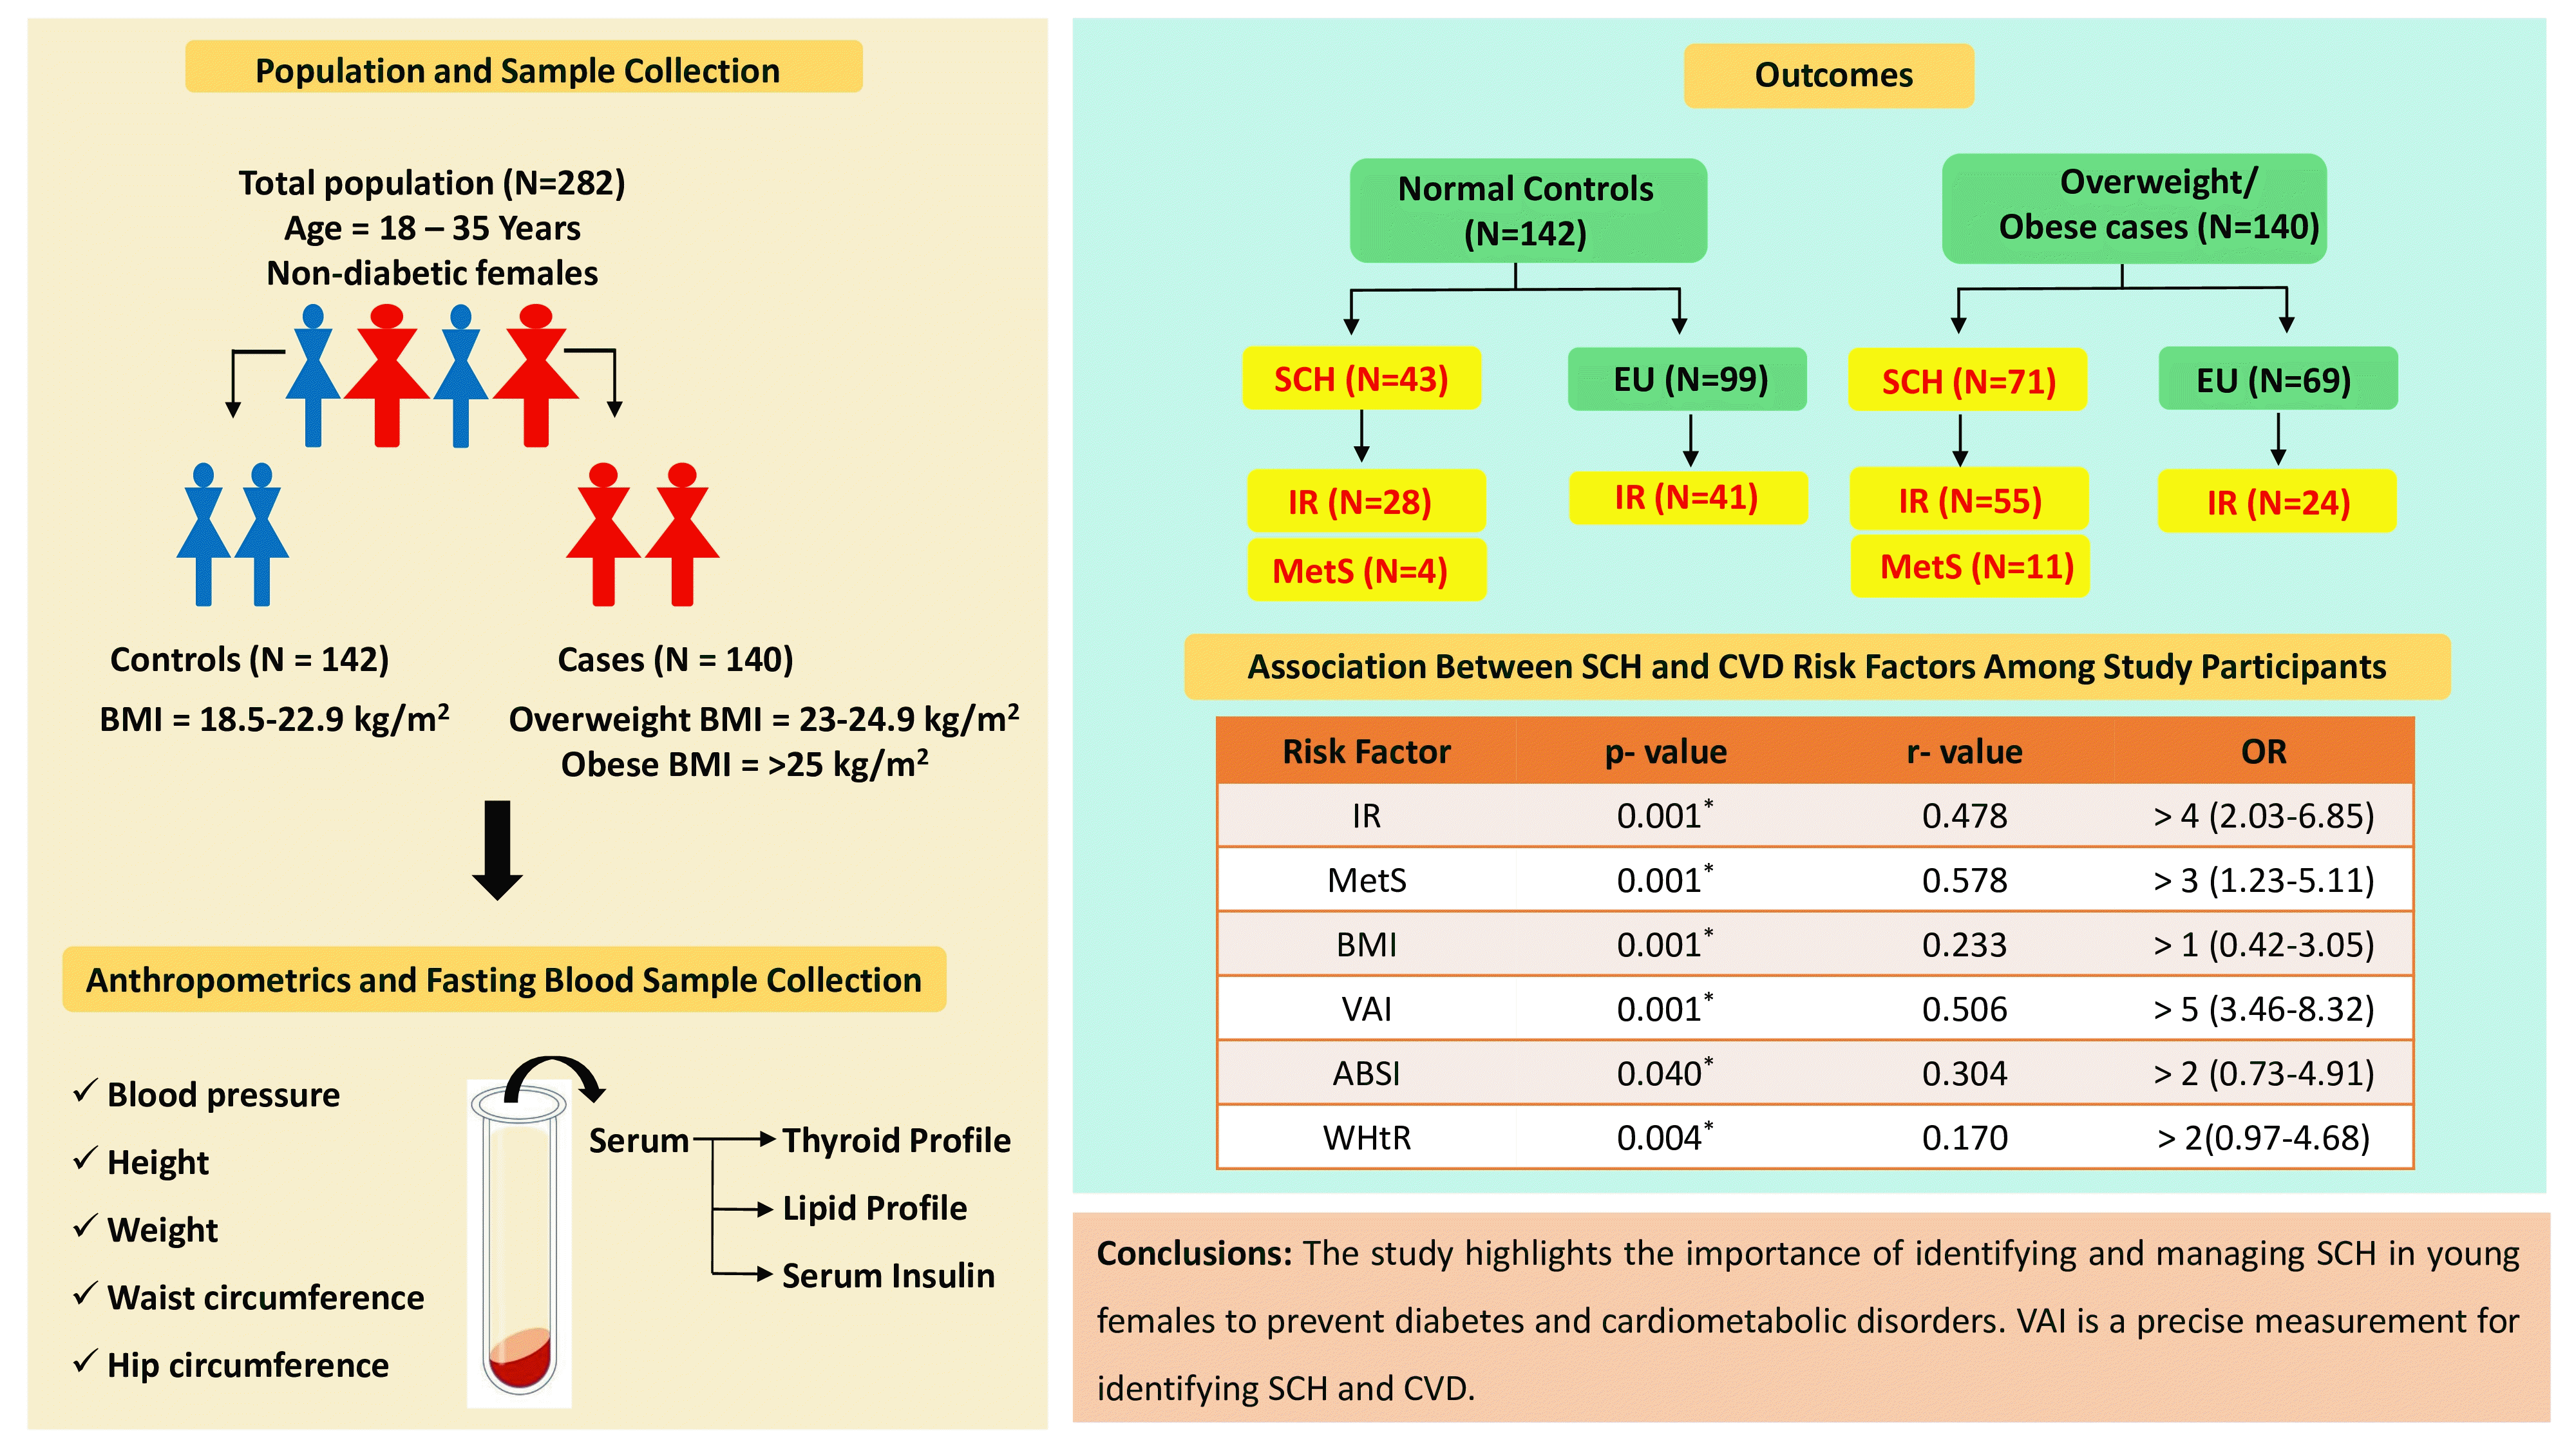
The overall rates of SCH, EU, IR, and metabolic syndrome (MetS) were 40.42%, 59.57%, 73.40%, and 24.46%, respectively. Both controls and cases included individuals with SCH; overall, 168 participants (59.57%) had EU, while 114 (40.42%) exhibited SCH. IR was significantly associated with SCH in both weight groups (P<0.05). Among those with SCH, the odds ratios (ORs) for IR were >2 (95% confidence interval [CI], 0.45 to 3.87) in controls and >6 (95% CI, 3.52 to 8.41) in cases. Similarly, the ORs for MetS were >1 (95% CI, 0.38 to 4.16) in controls and >11 (95% CI, 8.73 to 15.01) in cases. Dyslipidemia and hypertriglyceridemia were significantly more prevalent in the SCH group (P<0.05). Women with SCH exhibited higher mean values for all obesity indices compared to their EU counterparts, surpassing normal thresholds (P<0.05). Among obesity measures, visceral adiposity index (VAI) demonstrated the highest area under the curve and sensitivity for assessing SCH and cardiovascular disease (CVD) risk.

Conclusion

SCH must be identified and managed in young women to help prevent diabetes and cardiometabolic disorders. VAI may aid in precisely detecting SCH and CVD.

GRAPHICAL ABSTRACT

INTRODUCTION

Subclinical hypothyroidism (SCH) is a form of primary hypothyroidism characterized by elevated thyroid-stimulating hormone (TSH) levels ranging from 4.94 to 10 mIU/mL, along with normal serum free thyroxine (FT4) and triiodothyronine (T3) concentrations [1]. Each year, approximately 2% to 5% of SCH cases progress to overt hypothyroidism. Both subclinical and overt hypothyroidism are associated with an increased risk of cardiovascular diseases (CVD) and metabolic disorders [2]. For women, the risk of hypothyroidism is around 10 times that of men [3]. Despite the established links between SCH and diabetes mellitus (DM) in older populations, the influence of SCH on the development of insulin resistance (IR) and cardiometabolic risk among non-diabetic women of childbearing age has not been extensively studied.
Insulin plays a key role in maintaining normal blood glucose levels and regulating the metabolism of carbohydrates, lipids, and proteins [4]. IR is defined by a diminished sensitivity to insulin, leading to impaired glucose disposal despite normal or elevated insulin levels; accordingly, various biological responses are weakened [5]. Persistent IR can lead to the development of DM, dyslipidemia, metabolic disorders, and various other noncommunicable diseases. Hypothyroidism is associated with numerous metabolic abnormalities, including decreased insulin-induced absorption or disposal of glucose by muscles or adipose tissues, hyperlipidemia, weight gain, and increased levels of sex hormone-binding globulin [6]. Consequently, it is essential to identify and diagnose IR and other metabolic issues in women with SCH who do not meet the clinical criteria for DM.
Metabolic syndrome (MetS) is a group of medical conditions that includes central obesity, glucose intolerance or IR, dyslipidemia, low high-density lipoprotein (HDL), and hypertension. This cluster of metabolic disorders is associated with an increased risk of cardiometabolic problems and DM [7]. The prevalence of MetS is rising globally, with evidence indicating a high incidence in Sri Lanka and other South Asian countries [8]. It is crucial to reassess the risk of metabolic and cardiometabolic issues in women and girls with SCH, as this condition is linked to hormonal and metabolic changes. Obesity is characterized by the excessive accumulation and storage of fat in the body. Research indicates that patients with overt hypothyroidism and SCH exhibit reduced thermogenesis and metabolic rates, causing an increase in the proliferation of visceral adipose tissue. This effect is associated with conditions such as MetS, IR, DM, and cardiometabolic diseases [9]. Compared to general obesity, abdominal obesity is a key factor in MetS and also contributes to IR and CVD [10]. Amato et al. [11] introduced the visceral adiposity index (VAI), a mathematical model that quantifies visceral fat and IR and represents an excellent predictor of CVD. The model incorporates basic anthropometric measures such as waist circumference (WC) and body mass index (BMI), along with triglyceride and HDL levels. Notably, women with obesity are more likely to experience CVD than their male counterparts [12]. BMI is commonly used to assess weight in relation to height and is employed by the World Health Organization (WHO), with categories of underweight, normal weight, overweight, or obese. However, BMI primarily reflects excess weight rather than excess body fat [13]. To better identify abdominal obesity, the WHO and various researchers have proposed additional metrics, including waist-to-height ratio (WHtR), waist-to-hip ratio (WHR), and WC [14-16]. Furthermore, a body shape index (ABSI) and body roundness index (BRI) have been developed independently of BMI to assess visceral obesity [17]. Similarly, the hip index (HI) was created to complement hip circumference (HC), a common diagnostic measure of gluteofemoral obesity that is unrelated to BMI [18]. Given the relationship between visceral fat and SCH, these indicators were used to explore the relationship between SCH, SCH-induced IR, and cardiometabolic risk.
This study is the first to examine the application of various obesity markers—including VAI, ABSI, BRI, HI, WHR, WHtR, BMI, WC, and HC—in the identification of SCH among women of childbearing age. Additionally, we aimed to investigate the relationship between SCH and IR, the development of cardiometabolic risk, and body fat accumulation in a population without clinical DM. Previous research in adult populations has shown that SCH can influence MetS and other CVD risk factors. Therefore, it is essential to explore this association in women of reproductive age, who are particularly susceptible to developing cardiometabolic disorders during pregnancy. This study also provides valuable insights into the health status of this demographic, as young women are relatively prone to obesity. Recognizing and managing these risks is particularly crucial since women of this age can constitute a large portion of the national workforce.

METHODS

Study design and participants

A cross-sectional study was conducted from September 2020 to September 2022, involving women recruited from rural, suburban, and urban areas. The sample analysis occurred at the Department of Biochemistry, Faculty of Medical Sciences, University of Sri Jayewardenepura. The study included 282 women aged 18 to 35 years. Of these, 142 participants with BMI values ranging from 18.5 to 22.9 kg/m2 were classified as normal-weight controls. The remaining 140, who had BMIs of 23 to 24.9 kg/m2 (indicating overweight) or exceeding 25 kg/m2 (indicating obesity), were considered the overweight/obese group. The sample size was determined using the formula N=Zα/2+Zβ2pqr+1/r p1-p22, as outlined by Kelsey et al. [19]. To mitigate the influence of confounding factors, randomization and matching of study participants were implemented during the sample collection process.

Data collection

An interviewer-administered questionnaire was used to obtain relevant demographic and clinical information. The study was conducted in accordance with the principles of the Declaration of Helsinki, and volunteers were enrolled after providing consent. Specifically, written informed consent was obtained from each participant to ensure they fully understood the study protocol and the confidentiality of their personal information. Additionally, participants were informed that they could withdraw their consent at any time during the study. The study excluded women with fasting blood glucose levels exceeding 100 mg/dL, diabetes, BMI below 18.5 kg/m2, malignant neoplasia, pregnancy, or a previous diagnosis of a thyroid disorder. Women receiving thyroxine therapy, those who had undergone thyroidectomy, or those being treated for cancers, tumors, heart failure, or viral infections were also excluded. Diagnosis and therapy were verified by reviewing hospital clinic and diagnosis cards during the initial visit to ensure these individuals were not included. Additionally, a small subset of women with hyperthyroidism or overt hypothyroidism was excluded from the study, as they constituted less than 3% of the sample and thus did not reach the level of statistical significance.
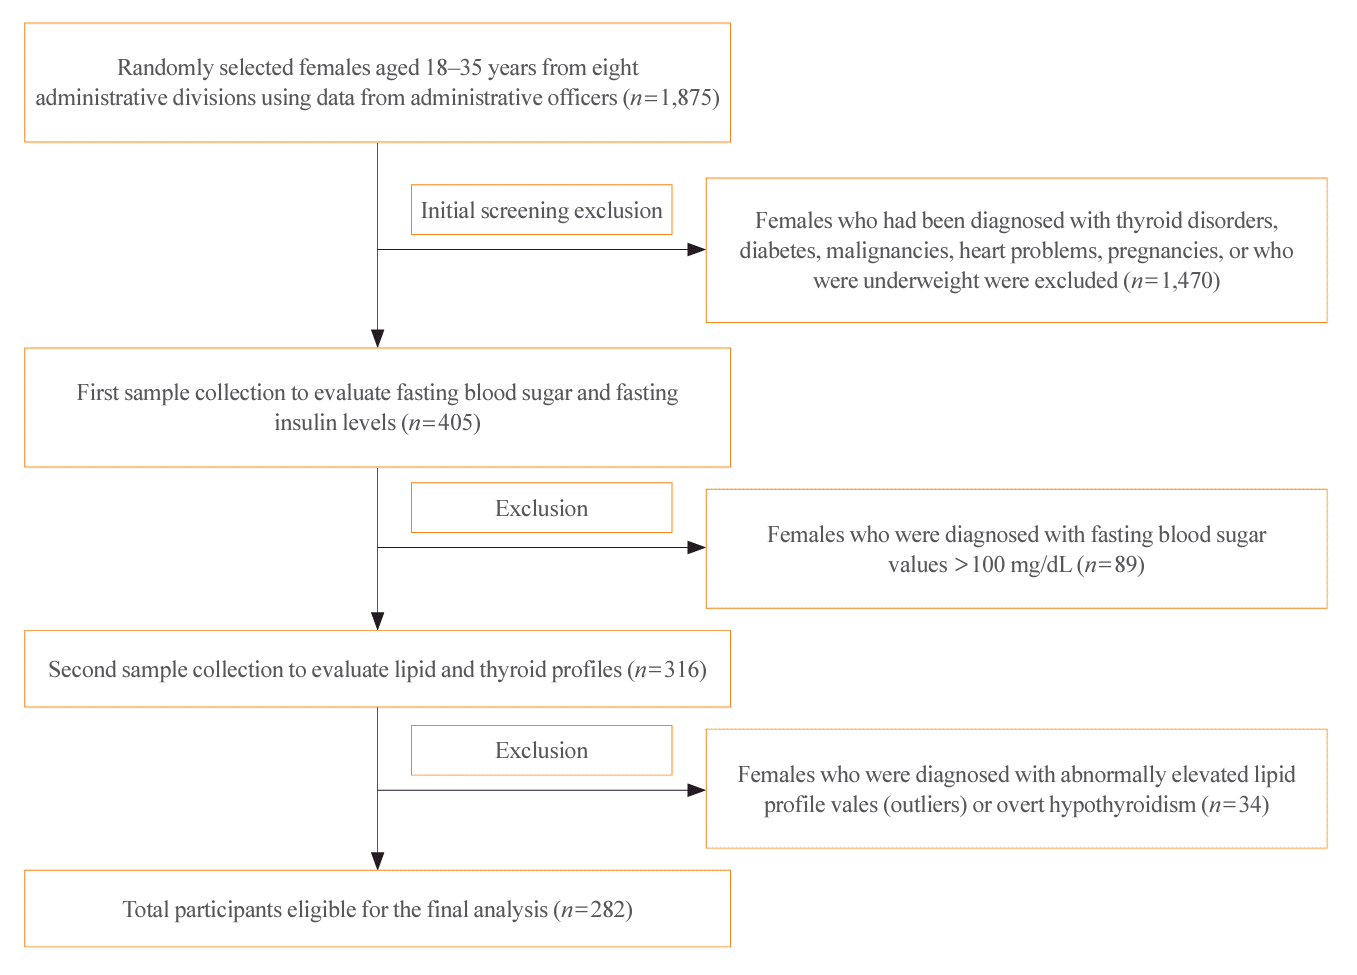
Throughout the participant selection process, female residents of the chosen administrative divisions were sought for enrollment, adhering to the inclusion and exclusion criteria. Considering the administrative divisions as clusters, eight of the 12 divisions were randomly selected using a random number generator. Then, every third house from the administrative list was selected. If two or more eligible participants resided in the same house, only one was chosen, prioritizing the individual whose birth month was closest to January. If two or more participants shared the same birth month and date, the older woman was recruited for the study. Samples were collected during home visits or by asking individuals to report to the regional Medical Officers of Health unit (Fig. 1). Both the initial consultation with participants and the collection of anthropometric data were facilitated by the region’s designated midwife at the medical unit. Prior to sample collection, ethical approval was obtained from the Institutional Review Board (IRB), or Ethics Review Committee, of the Faculty of Medical Sciences, University of Sri Jayewardenepura, Sri Lanka (Approval No: 39/19). This approval was renewed annually from 2020 to 2022, accompanied by the submission of annual reports to the IRB. Potential bias was mitigated by randomizing the sample, adhering to standardized protocols and instruments for sampling, incorporating a control group with the same level of exposure, and subjecting our methodology and protocols to peer review by experts in the field of study.

Anthropometric and blood pressure measurements

Anthropometric measurements were obtained using calibrated equipment in accordance with international standards. Height, WC, and HC were measured with a flexible, non-stretchable tape to the nearest 0.1 cm. Body weight was determined using an electronic scale accurate to 0.1 kg, with participants wearing light clothing. Blood pressure was measured in the seated position after the participant had rested for at least 5 minutes. A digital sphygmomanometer (HEM-7111, OMRON, Kyoto, Japan) was used to record blood pressure from the left arm, at the level of the heart. The mean value from two readings, obtained 5 minutes apart, was used for subsequent analysis.

Blood sample collection

Blood samples from each participant were obtained under aseptic conditions on two separate occasions to measure fasting blood sugar, fasting insulin, thyroid profile, and lipid profile. Participants were instructed to fast for 8 to 10 hours before 3 mL of blood was drawn to assess fasting insulin and blood sugar levels. On a different day, the women were asked to fast for 12 to 14 hours, after which 6 mL of blood was collected for thyroid and lipid profile analysis. The blood samples were transported to the laboratory within 3 hours of collection each day. There, the serum was separated by centrifugation at 3,500 rpm for 10 minutes. For each assay, the serum was aliquoted into Eppendorf tubes (Eppendorf, Hamburg, Germany) and stored at −80°C until analysis. The control and case samples were handled in an identical manner [20-22].

Sample analysis

An analyzer equipped with quality controls and calibrators (Konelab 20XT, BioLabo SAS, Maizy, France) was utilized to process the lipid profile and fasting blood glucose samples within 3 days of collection. Serum TSH, FT4, and free triiodothyronine (FT3) assays were conducted using an automated analyzer (mini-VIDAS, bioMérieux SA, Marcy l’Etoile, France) based on the enzyme-linked fluorescent assay principle. Serum insulin testing was performed using a quantitative sandwich enzyme-linked immunosorbent assay kit provided by R&D Systems (Minneapolis, MN, USA) and a Multiskan FC microplate photometer (Thermo Fisher Scientific, Waltham, MA, USA). The homeostasis model assessment of insulin resistance (HOMA-IR) was employed to assess IR.

Anthropometric indices and their cutoff values

ABSI, VAI, BRI, WHtR, BMI, WC, WHR, and HI were used to assess general adiposity, abdominal adiposity, and gluteofemoral adiposity. Women were classified as having overweight/obesity if their BMI exceeded 23 kg/m2, while those with a BMI below this threshold were considered to have a normal weight [23]. Overweight/obesity was considered to be defined by WHR >0.85 and WC >80 cm, whereas normal weight was indicated by WHR ≤0.85 and WC ≤80 cm [24]. A WHtR cutoff of 0.5 has been recommended for use across racial and cultural backgrounds, and this threshold is applicable to both children and adults [25]. Participants with an ABSI score above 0.076 were considered to have obesity [26,27]. For individuals under 30 years old, the optimal VAI cutoff value was established at 2.52 [28]. An HI of 0.64 or higher was associated with low risk of gluteofemoral obesity [29]. An anthropometric risk indicator (ARI) was employed to estimate mortality risk based on several risk factors. This was determined by summing the log hazard ratios of BMI, ABSI, and HI for each risk factor. An ARI of zero signifies population-average risk, a positive ARI indicates above-average risk, and a negative ARI suggests below-average risk [18].

Blood analyte cutoff values

The normal ranges for the thyroid profile were established according to the guidelines of the American Thyroid Association as follows: 0.38–4.94 mIU/mL for TSH, 0.89–2.44 nmol/L for T3, and 9.01–19.05 pmol/L for FT4. SCH was considered to be indicated by TSH levels ranging from 4.94 to 10 mIU/mL, along with normal FT4 and T3 values [30]. The following formula was used to calculate HOMA-IR: [fasting glucose (mg/dL)×fasting insulin (IU/mL)]/405. A HOMA-IR score of ≥2.5 was used as the cutoff for defining IR [31]. MetS was identified using the criteria from the National Cholesterol Education Program Adult Treatment Panel III [32]. According to these criteria, women with WC ≥80 cm, hypertriglyceridemia ≥150 mg/dL, HDL cholesterol ≤50 mg/dL, blood pressure ≥130 mm Hg systolic and ≥85 mm Hg diastolic, and HOMA-IR >2.5 were classified as positive for MetS. Since all participants with diabetes were excluded from our study, we utilized HOMA-IR for this definition [7].

Statistical analysis

Statistical analysis was conducted using SPSS version 23.0 (IBM Corp., Armonk, NY, USA). The results for the variables in this test were presented as mean±standard deviation. An independent samples t test was employed to compare the mean values of biochemical measurements between the two study groups. Pearson correlation analysis was applied to determine the relationships between TSH levels indicative of SCH and the obesity-defining criteria, as well as the selected CVD risk factors. The chi-square test was used to identify any significant associations among SCH/euthyroidism (EU) status, obesity criteria, and CVD risk factors. A P value less than 0.05 was considered to indicate statistical significance.

RESULTS

The total study cohort consisted of 282 participants, with 140 cases (those with overweight or obesity) and 142 controls (those of normal weight). Most participants were Sinhalese women, accounting for 87.9% of the sample, and 65.2% were housewives. Additionally, 42.9% of participants were between 25 and 30 years old, and 56.2% were married at the time of the study. Regarding income, the largest proportion (57.1%) fell into the middle-income category. Significant differences were observed in the mean values of BMI, WC, IR, and lipid profile parameters when comparing cases to controls. Moreover, a notable difference in TSH levels was observed between the groups (Table 1).
SCH was identified in both the normal-weight controls and the overweight/obesity cases, with 114 women (40.42%) diagnosed with SCH and 168 (59.57%) exhibiting EU. Among the 114 participants with SCH, 43 were normal-weight controls, and 71 had overweight or obesity. Furthermore, 65.11% (n=28) of the normal-weight participants with SCH (n=43) exhibited IR. Additionally, IR was present in 41% (n=41) of the participants with EU in the normal-weight group. A significant association between SCH and IR was observed in both groups. Of the 140 individuals with overweight/obesity, 79 (56.42%) had IR, and 55 (69.62%) of those with IR also had SCH (Table 2).
We assessed the relationship between SCH and MetS in these groups of young women. Among the participants with obesity and SCH, 60 (84.5%) were considered to have MetS, whereas only 11 (15.5%) were not. A strong correlation between SCH and MetS was observed in both groups (Table 3).
In comparison with those exhibiting EU, higher prevalence rates of cardiometabolic risk factors, including dyslipidemia, IR, and MetS, were observed among the women in the SCH group. Additionally, individuals with SCH were more likely to have obesity, as evidenced by higher mean values for various obesity-defining criteria that also surpassed reference thresholds (Table 4).
In addition to the described analysis, we explored the correlations of SCH with altered lipid profiles among all study participants with SCH. We identified significant relationships between SCH and various dyslipidemic conditions, including low HDL levels (P=0.001, r=−0.570), elevated low-density lipoprotein (LDL) levels (P=0.001, r=0.473), and hypertriglyceridemia (P=0.002, r=0.468).
A further analysis examined the correlations between SCH and various cardiometabolic risk factors, as well as criteria for obesity (Tables 5, 6). The associations between TSH levels indicative of SCH and obesity-defining criteria, including BMI, ABSI, BRI, VAI, WHR, WHtR, WC, HC, and HI, were determined. Significant associations were identified among the variables, with VAI displaying the strongest correlation with TSH levels.
Among the study participants, 151 (53.54%) exhibited IR, while 152 (53.9%) were found to have MetS. The prevalence rates of obesity, as determined by the anthropometric indices ABSI, BRI, VAI, BMI, WC, WHR, WHtR, and HI, were 48.93%, 41.84%, 38.29%, 49.64%, 41.13%, 63.12%, 51.06%, and 53.79%, respectively. According to all obesity metrics except WHR and HI, women with SCH exhibited higher odds of developing CVD than participants with EU. This is likely due to the condition’s influence on all other anthropometric indices as well as cardiometabolic risk factors, notably IR and MetS (Table 7).
Receiver operating characteristic analysis was conducted to identify the obesity criterion with the highest accuracy for detecting SCH and assessing CVD risk in the context of MetS. In both analyses, VAI demonstrated the greatest accuracy, as indicated by the highest area under the curve (AUC) values (Table 8, Figs. 2, 3).

DISCUSSION

In this cross-sectional study, we examined the role of SCH in the development of DM among young women without clinical hyperglycemia. We analyzed the incidence of IR and evaluated the impact of SCH on the development of cardiometabolic risk. This investigation is the first of its kind. The prevalence of SCH among the study participants was 40.42%, which significantly exceeds that reported in other studies. Notably, 151 of the participants (53.54%) were diagnosed with IR, while 152 (53.9%) were confirmed to have MetS. Accordingly, our study indicates that women with SCH face an increased risk of developing DM and cardiometabolic disorders, even in the absence of clinical symptoms.
The impact of thyroid hormone activity on insulin levels has recently attracted considerable attention. However, data regarding insulin fluctuations in thyroid dysfunction are inconsistent. Indeed, IR is responsible for many metabolic issues. Although clinical hypothyroidism is associated with IR, the behavior of insulin in SCH is not well understood. Research has established that IR represents the principal pathophysiological mechanism behind “glucose intolerance, dyslipidemia, abdominal obesity, and hypertension” [33]. DM is characterized by IR, which also increases the risk of dyslipidemia and is often associated with minor thyroid dysfunction [34]. Finally, hypothyroidism is the second most common endocrine disorder after DM. All of these factors may contribute to the development of IR. In the present study, the mean HOMA-IR value for participants of normal weight was 2.68±1.30, while among those with overweight/obesity, it was 3.56±1.57. As the HOMA-IR cutoff value for Asian people is between 2.2 and 2.5, both control and case groups displayed comparatively high levels. Among study participants, significantly higher levels of HOMA-IR, LDL, and triglycerides were noted in the SCH group compared to the EU group (P<0.05). Additionally, HDL levels were significantly lower among women with SCH (P<0.05). These results align with a study conducted by Handisurya et al. [35], which included female patients from a tertiary care hospital. In that report, the mean TSH level among women with SCH was 11.08±6.65 mIU/mL, and the mean HOMA-IR was 3.9±1.92. The correlation coefficient between SCH and HOMA-IR was 0.835 (P<0.01), higher than that found in our study. While these findings largely support the present results, other studies have reported conflicting evidence regarding the relationship between SCH or thyroid disease and IR [36]. This includes a study by Weerakkody and Lokuliyana [37], which involved 42 female participants, including 27 patients with overt hypothyroidism and 15 healthy EU controls. Their results indicated no significant differences in fasting plasma glucose, fasting insulin, IR, total cholesterol, or triglycerides between patients with hypothyroidism and those with EU. Two other investigations in adult populations also reported a high prevalence of DM among individuals with SCH [38,39]. Thus, these studies support our suggestion that SCH may represent a causative factor in the development of DM with IR. The value of our study’s findings lies in the identification of these relationships in women of childbearing age, marking the first analysis of SCH risk within this demographic. Further research to explore similar correlations in hypothyroidism or overt hyperthyroidism would be invaluable in confirming this association.
In both study groups, we observed a significant correlation between MetS and SCH (P<0.05). Additionally, FT4 levels were significantly correlated with MetS among cases. A recent study compared individuals with and without SCH who attended a clinic at a hospital. Their research revealed that 5.8% of individuals without SCH and 16.4% of those with SCH had MetS (P<0.05). Notably, the only significant factor associated with MetS was female sex; approximately one-sixth of patients with SCH also exhibited MetS [40]. In our study, 114 of the 282 participants had SCH, and 69.52% of those women were found to have MetS. Tuomi et al. [40] reported odds ratios of >1 among normal-weight controls and >11 among overweight or obese individuals for developing MetS in the presence of SCH. In our study, overweight/obesity demonstrated a significant association between MetS and both systolic and diastolic blood pressure, with P values <0.05. However, no significant association was noted between MetS and the systolic or diastolic blood pressures of normal-weight controls (P>0.05). Among the study population, a significant association was found between MetS and hypertension (P=0.023). Several studies from around the world have established a link between MetS and blood pressure, and our findings align with these results.
Individuals with hypothyroidism commonly experience dyslipidemia, a typical cardiometabolic risk factor. In our study, when examining the relationship between lipid profile parameters and thyroid status in participants with SCH, we found that all lipid profile parameters were significantly associated with SCH (P<0.05). A similar study in China yielded consistent results, demonstrating the impact of elevated TSH levels on abnormal lipid profiles with P values <0.001 for all parameters [41]. Furthermore, among the present participants, SCH exhibited a significant association with hypercholesterolemia and dyslipidemia relative to the EU group. This result is supported by a 2017 Iranian study in which patients with SCH displayed significantly higher LDL and lower HDL levels compared to control participants (P<0.001), although no significant differences were found in triglyceride or total cholesterol levels (P>0.05) [42]. In a separate study by Ejaz et al. [43], participants with SCH had substantially higher total cholesterol and LDL levels than those without SCH. Therefore, our research on SCH and altered lipid metabolism aligns with studies conducted on adult populations in various countries. The present study reveals the prevalence of dyslipidemia and MetS among women aged 18 to 35 years, representing a younger demographic than those previously studied. This is a notable finding, as prior research has primarily documented these conditions in elderly populations with SCH, whether male or female. Consequently, our study identifies a younger demographic with SCH who are at risk of developing dyslipidemia, metabolic disorders, and other cardiometabolic diseases. It also offers valuable insights for managing cardiometabolic risk in individuals with SCH during early adulthood.
Many investigations have established a link between thyroid hormone dysfunction and obesity, and numerous studies have identified an association between adipogenesis and decreased FT4, as well as elevated TSH, levels. Furthermore, a proposed relationship links gradual weight gain over time with TSH levels in individuals with EU and mild overweight [44]. Research indicates that among people with obesity, TSH levels are often at the upper limits of normal or slightly elevated, FT4 levels are reduced, FT3 levels are marginally increased, and TSH and BMI are positively associated [45]. Additional studies have shown that the concentrations of FT3 and FT4 are associated with both WC and BMI, and that a link exists between the levels of TSH and FT3 and the gradual accumulation of fat in those with obesity [46]. These findings align with ours, in which women with SCH displayed higher mean values for obesity measures than their EU counterparts, while also surpassing normal threshold values. This observation provides valuable insight into the management of two current global health concerns—SCH and obesity—among young women. Moreover, the risk of developing various cardiometabolic disorders may be heightened among women in the earlier stages of adulthood due to the impact of SCH on weight gain, as suggested by the present findings.
Multiple factors, including elevated BMI, high blood pressure, hypertriglyceridemia, and dyslipidemia, accelerate the onset of CVD in patients with hypothyroidism [47]. While WC is a straightforward and reliable tool for evaluating visceral obesity and CVD risk, it is insufficient for distinguishing between subcutaneous fat tissue and the more atherogenic visceral fat tissue [11]. In addition to other risk factors such as BMI, biochemical parameters that affect cardiovascular endpoints—such as HDL cholesterol and triglyceride concentrations—are also considered when calculating VAI, which is proposed to be more precise. In our investigation seeking the best obesity-related parameter for identifying CVD risk, VAI demonstrated the highest AUC in the receiver operating characteristic analysis, with an AUC of 0.655, a sensitivity of 53.3%, and a 1-specificity of 29.2%. BMI and BRI displayed AUC values of 0.593 (sensitivity=36.2%, 1-specificity=29.2%) and 0.571 (sensitivity=24.3%, 1-specificity=20.8%), respectively. Furthermore, WHtR showed a sensitivity of 50.7% and an AUC of 0.571 in this analysis. Pekgor et al. [3] similarly demonstrated that VAI is significantly associated with MetS and CVD risk.
The primary limitations of this study arise from its cross-sectional design, which does not enable the identification of long-term patterns or causal relationships. Furthermore, the hyperinsulinemic euglycemic clamp, considered the gold standard for assessing IR, was substituted with the HOMA-IR method. This decision was based on practical considerations, including cost, time, and suitability for this research. Additionally, due to financial constraints, glycated hemoglobin levels were not measured in participants, precluding an evaluation of DM prevalence. Another limitation is that anthropometric measurements, which can lack sensitivity, may fail to capture short-term changes in nutritional status. Conversely, a key strength of this study is the investigation of the effects of SCH on the development of DM and the associated cardiometabolic risks in reproductive-aged women. To our knowledge, this is the first study to evaluate the risk of CVD and SCH using a comprehensive set of obesity indices, including VAI, ABSI, BRI, BMI, WHR, WHtR, WC, HC, and HI. Based on the findings presented, SCH in young women poses a serious concern and must be effectively managed to reduce the risk of developing DM and CVD.
In conclusion, our findings underscore the importance of identifying and managing SCH in young women of childbearing age to mitigate the risk of DM and cardiometabolic disorders. Additionally, this study offers valuable insights into the development of MetS and obesity in young women with SCH. Regarding the optimal method for detecting obesity, VAI appears to represent a precise tool for identifying SCH and CVD in this demographic, outperforming BMI, BRI, and WHR in terms of accuracy. ABSI and WHtR are also reliable metrics for assessing SCH and the risk of CVD. To reduce the risk of developing DM, CVD, and other metabolic disorders, appropriate management for young women with both SCH and obesity is advisable. We recommend further longitudinal studies to confirm the causal relationship between SCH and cardiometabolic diseases in young women of childbearing age, which would strengthen our findings.

Notes

CONFLICTS OF INTEREST

No potential conflict of interest relevant to this article was reported.

AUTHOR CONTRIBUTIONS

Conception or design: N.H., U.W., R.P. Acquisition, analysis, or interpretation of data: N.H., U.W., R.P. Drafting the work or revising: N.H., U.W., R.P. Final approval of the manuscript: N.H., U.W., R.P.

ACKNOWLEDGMENTS

The authors wish to express their gratitude for the financial support provided by the University of Sri Jayewardenepura (university grant–ASP/01/RE/MED/2018/51).

REFERENCES

1. Biondi B, Cooper DS. The clinical significance of subclinical thyroid dysfunction. Endocr Rev. 2008; 29:76–131.
2. Vanderpump MP. The epidemiology of thyroid disease. Br Med Bull. 2011; 99:39–51.
3. Pekgor S, Duran C, Kutlu R, Solak I, Pekgor A, Eryilmaz MA. Visceral adiposity index levels in patients with hypothyroidism. J Natl Med Assoc. 2018; 110:606–13.
4. Wilcox G. Insulin and insulin resistance. Clin Biochem Rev. 2005; 26:19–39.
5. Reaven G. The metabolic syndrome or the insulin resistance syndrome: different names, different concepts, and different goals. Endocrinol Metab Clin North Am. 2004; 33:283–303.
6. Enzevaei A, Salehpour S, Tohidi M, Saharkhiz N. Subclinical hypothyroidism and insulin resistance in polycystic ovary syndrome: is there a relationship? Iran J Reprod Med. 2014; 12:481–6.
7. Eckel RH, Grundy SM, Zimmet PZ. The metabolic syndrome. Lancet. 2005; 365:1415–28.
8. Amarasekara P, de Silva A, Swarnamali H, Senarath U, Katulanda P. Knowledge, attitudes, and practices on lifestyle and cardiovascular risk factors among metabolic syndrome patients in an urban tertiary care institute in Sri Lanka. Asia Pac J Public Health. 2016; 28(1 Suppl):32S–40S.
9. Tsou MT. Subclinical hypothyroidism represents visceral adipose indices, especially in women with cardiovascular risk. J Endocr Soc. 2021; 5:bvab028.
10. Aziz M, Kandimalla Y, Machavarapu A, Saxena A, Das S, Younus A, et al. Effect of thyroxin treatment on carotid intima-media thickness (CIMT) reduction in patients with subclinical hypothyroidism (SCH): a meta-analysis of clinical trials. J Atheroscler Thromb. 2017; 24:643–59.
11. Amato MC, Giordano C, Galia M, Criscimanna A, Vitabile S, Midiri M, et al. Visceral adiposity index: a reliable indicator of visceral fat function associated with cardiometabolic risk. Diabetes Care. 2010; 33:920–2.
12. Cercato C, Fonseca FA. Cardiovascular risk and obesity. Diabetol Metab Syndr. 2019; 11:74.
13. Freedman DS, Ogden CL, Berenson GS, Horlick M. Body mass index and body fatness in childhood. Curr Opin Clin Nutr Metab Care. 2005; 8:618–23.
14. World Health Organization. Obesity: preventing and managing the global epidemic. Geneva: WHO;2000. [cited 2024 Jul 23]. Available from: https://iris.who.int/handle/10665/42330.
15. Hsieh SD, Yoshinaga H. Abdominal fat distribution and coronary heart disease risk factors in men-waist/height ratio as a simple and useful predictor. Int J Obes Relat Metab Disord. 1995; 19:585–9.
16. Ashwell M, Lejeune S, McPherson K. Ratio of waist circumference to height may be better indicator of need for weight management. BMJ. 1996; 312:377.
17. Krakauer NY, Krakauer JC. A new body shape index predicts mortality hazard independently of body mass index. PLoS One. 2012; 7:e39504.
18. Krakauer NY, Krakauer JC. An anthropometric risk index based on combining height, weight, waist, and hip measurements. J Obes. 2016; 2016:8094275.
19. Kelsey JL, Whittemore AS, Evans AS, Thompson WD. Methods in observational epidemiology. Vol 10. New York: Oxford University Press;1996. [cited 2024 Jul 23]. Available from: https://books.google.lk/books?hl=en&lr=&id=Xnz6VgL22osC&oi=fnd&pg=PA3&dq=Kelsey+JL.+Methods+in+observational+epidemiology:+Monographs+in+Epidemiology+and%3B+1996.&ots=kOI5-22zNh&sig=sNWplJpmZTicQmop68dLM1arew4&redir_esc=y#v=onepage&q&f=false.
20. Evans K, Mitcheson J, Laker MF. Effect of storage at -70 degrees C on lipid, lipoprotein and apolipoprotein concentrations. Clin Chim Acta. 1997; 258:219–29.
21. Nwosu OK, Nwani CD. Stability of serum/plasma glucose for the diagnosis of diabetes mellitus. Bio Res. 2008; 6:380–3.
22. Nishi I, Okada Y, Hayashi J, Takeoka K, Amino N, Miyai K. Effect of various sampling condition on the measurement of circulating TSH and free thyroxine. Rinsho Byori. 1992; 40:417–22.
23. WHO Expert Consultation. Appropriate body-mass index for Asian populations and its implications for policy and intervention strategies. Lancet. 2004; 363:157–63.
24. Misra A, Chowbey P, Makkar BM, Vikram NK, Wasir JS, Chadha D, et al. Consensus statement for diagnosis of obesity, abdominal obesity and the metabolic syndrome for Asian Indians and recommendations for physical activity, medical and surgical management. J Assoc Physicians India. 2009; 57:163–70.
25. Yoo EG. Waist-to-height ratio as a screening tool for obesity and cardiometabolic risk. Korean J Pediatr. 2016; 59:425–31.
26. Wang F, Chen Y, Chang Y, Sun G, Sun Y. New anthropometric indices or old ones: which perform better in estimating cardiovascular risks in Chinese adults. BMC Cardiovasc Disord. 2018; 18:14.
crossref
27. Kim B, Kim GM, Kim E, Park J, Isobe T, Mori Y, et al. The anthropometric measure ‘a body shape index’ may predict the risk of osteoporosis in middle-aged and older Korean people. Int J Environ Res Public Health. 2022; 19:4926.
28. Oh JY, Sung YA, Lee HJ. The visceral adiposity index as a predictor of insulin resistance in young women with polycystic ovary syndrome. Obesity (Silver Spring). 2013; 21:1690–4.
crossref
29. Konstantynowicz J, Abramowicz P, Jamiolkowski J, Kadziela-Olech H, Bialokoz-Kalinowska I, Kierus-Jankowska K, et al. Thigh circumference as a useful predictor of body fat in adolescent girls with anorexia nervosa. Ann Nutr Metab. 2011; 58:181–7.
30. Jonklaas J, Bianco AC, Bauer AJ, Burman KD, Cappola AR, Celi FS, et al. Guidelines for the treatment of hypothyroidism: prepared by the American Thyroid Association Task Force on Thyroid Hormone Replacement. Thyroid. 2014; 24:1670–751.
31. Singh Y, Garg MK, Tandon N, Marwaha RK. A study of insulin resistance by HOMA-IR and its cut-off value to identify metabolic syndrome in urban Indian adolescents. J Clin Res Pediatr Endocrinol. 2013; 5:245–51.
32. Alberti KG, Eckel RH, Grundy SM, Zimmet PZ, Cleeman JI, Donato KA, et al. Harmonizing the metabolic syndrome: a joint interim statement of the International Diabetes Federation Task Force on Epidemiology and Prevention; National Heart, Lung, and Blood Institute; American Heart Association; World Heart Federation; International Atherosclerosis Society; and International Association for the Study of Obesity. Circulation. 2009; 120:1640–5.
33. Meier C, Staub JJ, Roth CB, Guglielmetti M, Kunz M, Miserez AR, et al. TSH-controlled L-thyroxine therapy reduces cholesterol levels and clinical symptoms in subclinical hypothyroidism: a double blind, placebo-controlled trial (Basel Thyroid Study). J Clin Endocrinol Metab. 2001; 86:4860–6.
crossref
34. Perros P, McCrimmon RJ, Shaw G, Frier BM. Frequency of thyroid dysfunction in diabetic patients: value of annual screening. Diabet Med. 1995; 12:622–7.
35. Handisurya A, Pacini G, Tura A, Gessl A, Kautzky-Willer A. Effects of T4 replacement therapy on glucose metabolism in subjects with subclinical (SH) and overt hypothyroidism (OH). Clin Endocrinol (Oxf). 2008; 69:963–9.
crossref
36. Kordonouri O, Klinghammer A, Lang EB, Gruters-Kieslich A, Grabert M, Holl RW. Thyroid autoimmunity in children and adolescents with type 1 diabetes: a multicenter survey. Diabetes Care. 2002; 25:1346–50.
37. Weerakkody RM, Lokuliyana PN. Severe hypothyroidism presenting as reversible proteinuria: two case reports. J Med Case Rep. 2019; 13:270.
crossref
38. Alsulami SS, Baig M, Albeladi AH, Alyoubi SB, Alsubaie SA, Albeladi SA, et al. Correlation between subclinical hypothyroidism and metabolic syndrome: a retrospective study. Saudi J Med Med Sci. 2023; 11:250–6.
crossref
39. Diez JJ, Iglesias P. Prevalence of diabetes in people with thyroid dysfunction. Med Clin (Barc). 2023; 160:333–40.
crossref
40. Tuomi T, Groop LC, Zimmet PZ, Rowley MJ, Knowles W, Mackay IR. Antibodies to glutamic acid decarboxylase reveal latent autoimmune diabetes mellitus in adults with a non-insulin-dependent onset of disease. Diabetes. 1993; 42:359–62.
crossref
41. Kouidhi S, Berhouma R, Ammar M, Rouissi K, Jarboui S, Clerget-Froidevaux MS, et al. Relationship of thyroid function with obesity and type 2 diabetes in euthyroid Tunisian subjects. Endocr Res. 2013; 38:15–23.
crossref
42. Rastgooye Haghi A, Solhjoo M, Tavakoli MH. Correlation between subclinical hypothyroidism and dyslipidemia. Iran J Pathol. 2017; 12:106–11.
crossref
43. Ejaz M, Kumar P, Thakur M, Bachani P, Naz S, Lal K, et al. Comparison of lipid profile in patients with and without subclinical hypothyroidism. Cureus. 2021; 13:e17301.
crossref
44. Reinehr T, de Sousa G, Andler W. Hyperthyrotropinemia in obese children is reversible after weight loss and is not related to lipids. J Clin Endocrinol Metab. 2006; 91:3088–91.
crossref
45. Biondi B. Thyroid and obesity: an intriguing relationship. J Clin Endocrinol Metab. 2010; 95:3614–7.
crossref
46. Chomard P, Vernhes G, Autissier N, Debry G. Serum concentrations of total T4, T3, reverse T3 and free T4, T3 in moderately obese patients. Hum Nutr Clin Nutr. 1985; 39:371–8.
47. Polat Canbolat I, Belen E, Bayyigit A, Helvaci A, Kilickesmez K. Evaluation of daily blood pressure alteration in subclinical hypothyroidism. Acta Cardiol Sin. 2017; 33:489–94.
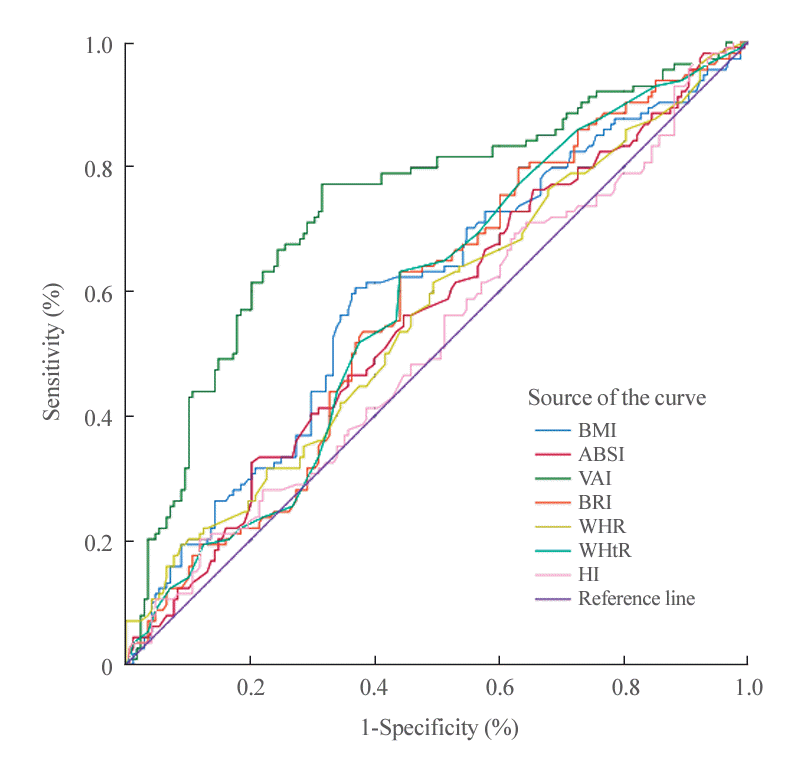
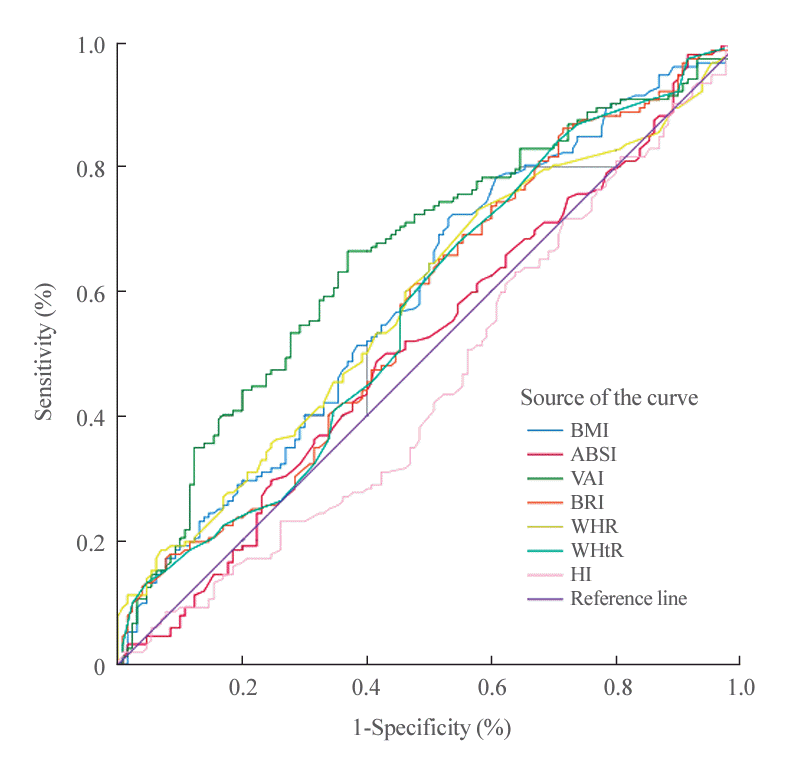
Fig. 1.
Flow diagram of study participant selection.
enm-2024-2015f1.tif
Fig. 2.
Receiver operating characteristic curves of obesity indices in the prediction of subclinical hypothyroidism. BMI, body mass index; ABSI, a body shape index; VAI, visceral adiposity index; BRI, body roundness index; WHR, waist-to-hip ratio; WHtR, waist-to-height ratio; HI, hip index.
enm-2024-2015f2.tif
Fig. 3.
Receiver operating characteristic curves of obesity indices in the prediction of cardiometabolic risk in women with metabolic syndrome. BMI, body mass index; ABSI, a body shape index; VAI, visceral adiposity index; BRI, body roundness index; WHR, waist-to-hip ratio; WHtR, waist-to-height ratio; HI, hip index.
enm-2024-2015f3.tif
enm-2024-2015f4.tif
Table 1.
Mean Values, Standard Deviations, and Significant Differences for Biochemical Variables in Study Groups
Parameter Normal (n=142) Overweight/obese (n=140) P value
Age, yr 26.21±4.26 28.21±3.95 0.093
Waist circumference, cm 69.27±5.36 85.74±7.78 0.000a
Hip circumference, cm 87.31±7.29 99.74±5.93 0.001a
Body mass index, kg/m2 20.58±1.67 26.87±2.82 0.002a
A body shape index 0.7469±0.005 0.7774±0.004 0.305
Body roundness index 2.42±0.55 4.49±1.03 0.001a
Visceral adiposity index 1.80±0.80 2.56±0.87 0.001a
Waist-to-hip ratio 0.78±0.05 0.84±0.12 0.003a
Waist-to-height ratio 0.44±0.03 0.55±0.04 0.001a
Hip index 101.59±8.51 102.89±4.31 0.171
Thyroid-stimulating hormone, mIU/mL 3.34±2.67 5.13±2.58 0.000a
Free thyroxine, pmol/L 14.90±3.10 14.33±3.21 0.124
Free triiodothyronine, pmol/L 5.01±1.18 5.78±1.33 0.000a
Fasting blood sugar, mg/dL 86.06±8.43 84.80±10.35 0.261
HOMA-IR 2.68±1.30 3.56±1.57 0.000a
Triglycerides, mg/dL 126.07±34.95 165.96±33.35 0.000a
Low-density lipoprotein, mg/dL 133.27±42.51 157.03±39.00 0.005a
High-density lipoprotein, mg/dL 47.31±7.34 45.32±7.04 0.021a
Total cholesterol, mg/dL 181.92±44.94 207.55±40.04 0.002a
Systolic blood pressure, mm Hg 112.94±10.33 121.05±11.37 0.002a
Diastolic blood pressure, mm Hg 69.19±9.11 75.82±7.61 0.001a

Values are expressed as mean±standard deviation.

HOMA-IR, homeostasis model assessment-insulin resistance.

a P<0.05.

Table 2.
Association between SCH and IR among Study Participants
Thyroid status Normal-weight controls (n=142)
Overweight/obese cases (n=140)
With IR Without IR P value r value OR (95% CI) With IR Without IR P value r value OR (95% CI)
SCH 28 15 0.009a 0.216 >2 (0.45–3.87) 55 16 0.001a 0.430 >6 (3.52–8.41)
EU 41 58 24 45

SCH, subclinical hypothyroidism; IR, insulin resistance; OR, odds ratio; CI, confidence interval; EU, euthyroidism.

a P<0.05.

Table 3.
Association between SCH and MetS among Study Participants
Thyroid status Normal-weight controls (n=142)
Overweight/obese cases (n=140)
With MetS Without MetS P value r value OR (95% CI) With MetS Without MetS P value r value OR (95% CI)
SCH 4 39 0.002a 0.258 >1 (0.38–4.16) 60 11 0.0001a 0.775 >11 (8.73–15.01)
EU 0 99 5 64

SCH, subclinical hypothyroidism; MetS, metabolic syndrome; OR, odds ratio; CI, confidence interval; EU, euthyroidism.

a P<0.05.

Table 4.
Comparative Analysis of Cardiometabolic Risk Variables and Obesity-Defining Parameters in Women with SCH versus EU
Risk factor Mean value of risk factor in SCH group (n=114) Mean value of risk factor in EU group (n=168) P value
HOMA-IR 3.72±1.63 2.41±1.35 0.006a
HDL, mg/dL 41.38±7.44 50.32±6.41 0.016a
LDL, mg/dL 165.35±28.77 97.60±37.76 0.001a
TC, mg/dL 212.35±28.71 164.79±33.68 0.001a
Triglycerides, mg/dL 171.03±30.53 99.61±28.77 0.040a
Systolic BP, mm Hg 117.57±11.03 116.55±11.95 0.311
Diastolic BP, mm Hg 73.24±9.22 71.96±8.86 0.921
BMI, kg/m2 26.43±3.96 22.24±3.73 0.001a
Waist circumference, cm 83.07±11.03 75.66±9.94 0.001a
A body shape index 0.0796±0.0047 0.0756±0.0049 0.033a
Body roundness index 3.64±1.31 3.31±1.32 0.043a
Visceral adiposity index 2.54±0.86 1.78±0.76 0.001a
Hip circumference, cm 95.78±8.21 92.15±8.71 0.004a
Waist-to-hip ratio 0.83±0.075 0.80±0.09 0.081
Waist-to-height ratio 0.51±0.066 0.49±0.069 0.031a
Hip index 63.43±3.33 62.81±4.66 0.318

Values are expressed as mean±standard deviation.

SCH, subclinical hypothyroidism; EU, euthyroidism; HOMA-IR, homeostasis model assessment-insulin resistance; HDL, high-density lipoprotein; LDL, low-density lipoprotein; TC, total cholesterol; BP, blood pressure; BMI, body mass index.

a P<0.05.

Table 5.
Correlations between SCH and Cardiometabolic Risk Factors among Study Participants
Variable SCH vs. cardiometabolic risk factors
SI HOMA-IR HDL TG LDL TC SBP DBP
r value 0.284 0.311 −0.361 0.579 0.458 0.471 0.045 0.096
P value 0.001a 0.001a 0.001a 0.001a 0.001a 0.001a 0.450 0.108

SCH, subclinical hypothyroidism; SI, serum insulin; HOMA-IR, homeostasis model assessment-insulin resistance; HDL, high-density lipoprotein; TG, triglyceride; LDL, low-density lipoprotein; TC, total cholesterol; SBP, systolic blood pressure; DBP, diastolic blood pressure.

a P<0.05.

Table 6.
Correlations between SCH and Obesity-Defining Criteria (BMI, ABSI, BRI, VAI, WC, HC, WHR, WHtR, and HI) among Study Participants
Variable SCH vs. obesity-defining criteria
BMI ABSI BRI VAI WC HC WHR WHtR HI
r value 0.267 0.138 0.222 0.433 0.302 0.269 0.169 0.228 0.098
P value 0.001a 0.021a 0.001a 0.001a 0.001a 0.001a 0.004a 0.001a 0.099

SCH, subclinical hypothyroidism; BMI, body mass index; ABSI, a body shape index; BRI, body roundness index; VAI, visceral adiposity index; WC, waist circumference; HC, hip circumference; WHR, waist-to-hip ratio; WHtR, waist-to-height ratio; HI, hip index.

a P<0.05.

Table 7.
Association between SCH and CVD Risk Factors among Study Participants
Risk factor Risk category SCH-EU status
P value r value OR (95% CI)
EU SCH
Insulin resistance Low risk 102 29 0.001a 0.478 >4 (2.03–6.85)
High risk 66 85
MetS Low risk 105 25 0.001a 0.578 >3 (1.23–5.11)
High risk 63 89
Body mass index Low risk 99 43 0.001a 0.233 >1 (0.42–3.05)
High risk 69 71
A body shape index Low risk 93 51 0.040a 0.304 >2 (0.73–4.91)
High risk 75 63
Body roundness index Low risk 107 57 0.022a 0.136 >1 (0.48–3.74)
High risk 61 57
Visceral adiposity index Low risk 131 43 0.001a 0.506 >5 (3.46–8.32)
High risk 37 71
Waist circumference Low risk 113 53 0.001a 0.207 >1 (0.09–2.81)
High risk 55 61
Waist-to-hip ratio Low risk 75 46 0.098 0.034 <1 (0.05–3.01)
High risk 93 68
Waist-to-height ratio Low risk 94 44 0.004a 0.170 >2 (0.97–4.68)
High risk 74 70
Hip index Low risk 77 55 0.690 0.024 <1 (0.08–4.02)
High risk 91 59

SCH, subclinical hypothyroidism; CVD, cardiovascular disease; EU, euthyroidism; OR, odds ratio; CI, confidence interval; MetS, metabolic syndrome.

a P<0.05.

Table 8.
Accuracy of Various Obesity Indices in the Identification of SCH and CVD Risk among Study Participants, with Recommended Cutoff Values
Obesity index Cutoff value AUC Sensitivity, % 1-Specificity, %
Obesity indices in the prediction of SCH
 BMI, kg/m2 25 0.596 (0.582–0.664) 36.8 31.5
 ABSI 0.0076 0.561 (0.493–0.629) 56.1 45.8
 VAI 2.52 0.735 (0.674–0.796) 66.7 25.6
 BRI 5.16 0.578 (0.512–0.646) 38.6 32.7
 WHR 0.85 0.562 (0.494–0.631) 36.1 31.5
 WHtR 0.50 0.562 (0.515–0.649) 55.3 43.5
 HI 0.64 0.562 (0.451–0.589) 42.8 51.5
Obesity indices in the prediction of CVD
 BMI, kg/m2 25 0.593 (0.527–0.660) 36.2 29.2
 ABSI 0.0076 0.516 (0.449–0.585) 52.6 51.1
 VAI 2.52 0.655 (0.591–0.719) 53.3 29.2
 BRI 5.16 0.571 (0.504–0.639) 24.3 20.8
 WHR 0.85 0.581 (0.515–0.648) 37.5 28.5
 WHtR 0.50 0.571 (0.504–0.639) 50.7 45.4
 HI 0.64 0.454 (0.387–0.523) 42.8 51.5

SCH, subclinical hypothyroidism; CVD, cardiovascular disease; AUC, area under the curve; BMI, body mass index; ABSI, a body shape index; VAI, visceral adiposity index; BRI, body roundness index; WHR, waist-to-hip ratio; WHtR, waist-to-height ratio; HI, hip index.

TOOLS
Similar articles