Journal List > J Korean Neurosurg Soc > v.67(6) > 1516088952

Park, Han, Heo, Lee, Lee, Lee, Lee, Lim, Kim, and Oh: High-Volume Hospital Had Lower Mortality of Severe Intracerebral Hemorrhage Patients

Abstract

Objective

Intracerebral hemorrhage (ICH) accompanies higher mortality rates than other type of stroke. This study aimed to investigate the association between hospital volume and mortality for cases of ICH.

Methods

We used nationwide data from 2013 to 2018 to compare high-volume hospitals (≥32 admissions/year) and low-volume hospitals (<32 admissions/year). We tracked patients’ survival at 3-month, 1-year, 2-year, and 4-year endpoints. The survival of ICH patients was analyzed at 3-month, 1-year, 2-year, and 4-year endpoints using Kaplan-Meier survival analysis. Multivariable logistic regression analysis and Cox regression analysis were performed to determine predictive factors of poor outcomes at discharge and death.

Results

Among 9086 ICH patients who admitted to hospital during 18-month period, 6756 (74.4%) and 2330 (25.6%) patients were admitted to high-volume and low-volume hospitals. The mortality of total ICH patients was 18.25%, 23.87%, 27.88%, and 35.74% at the 3-month, 1-year, 2-year, and 4-year, respectively. In multivariate logistic analysis, high-volume hospitals had lower poor functional outcome at discharge than low-volume hospitals (odds ratio, 0.80; 95% confidence interval, 0.72–0.91; p<0.001). In the Cox analysis, high-volume hospitals had significantly lower 3-month, 1-year, 2-year, and 4-year mortality than low-volume hospitals (p<0.05).

Conclusion

The poor outcome at discharge, short- and long-term mortality in ICH patients differed according to hospital volume. High-volume hospitals showed lower rates of mortality for ICH patients, particularly those with severe clinical status.

INTRODUCTION

Stroke remains the second-largest cause of death and the third-largest cause of death and disability combined in the world [5]. Intracerebral hemorrhage (ICH) accounts for 14.5% of strokes in Korea, and the 3-year mortality rate is the highest among stroke types at 38.7% [16]. The relationship between hospital volume and patients’ outcomes is a particularly relevant topic [2]. Recently, several studies have been conducted to investigate the relationships between various outcome indices, including volume of admission and mortality [11]. These studies found that a large volume of admission is positively associated with reduction of mortality and medical costs [3,11,30]. However, previous studies have tended to focus on patients with subarachnoid hemorrhage (SAH), whose treatments require a highly sophisticated technique : craniotomy [32]. Therefore, the existing literature has fundamental limitations in explaining cases of hemorrhagic stroke, including acute stroke. Since SAH patients are not representative of all hemorrhagic stroke patients, studies specific to ICH are needed. This study aims to investigate the association between hospital volume of admission and mortality in ICH patients, which has been relatively neglected in the literature [19].

MATERIALS AND METHODS

The study was conducted according to the guidelines of the Declaration of Helsinki and approved by the Research Ethics Committee of The Catholic University of Korea Uijeongbu St. Mary’s Hospital (IRB number : UC23ZISE0023). This study was performed under the joint project of the National Stroke Quality Assessment Research with the National Health Insurance Administration. The requirement for informed consent was waived due to the retrospective nature of the study.
Since 2013, Acute Stroke Assessment Registry (ASAR) is developed to assess the quality of stroke care management in South Korea. The ASAR is a nationwide database from 248 pre-selected hospitals collected nationwide prospectively to evaluate the quality of medical services in nursing homes and inform quality improvement. This registry is collected by invoices, questionnaires submitted to medical institutions, and death data from the Ministry of Public Administration and Security in March to May 2013, June to August 2014, June to December 2016, and June to December 2018. It is a registry that evaluates the quality of health care services in nursing homes and induces quality improvement by extracting patient data once every 2 years. ASAR includes tertiary hospitals and general hospitals nationwide with 10 or more acute stroke hospitalizations during the evaluation period. The records from ASAR can be linked with the Health Insurance Review and Assessment Service (HIRA) database using an encrypted personal identification number to determine survival outcomes among ICH patients. Skilled medical staff at preselected hospitals are responsible for collecting detailed data from patients visiting the emergency room for stroke, all of which are encrypted and stored in the HIRA database. The reliability of ASAR and HIRA data has been validated by previous studies of stroke patients [14,19]. This study was conducted in partnership with HIRA under the National Joint Registry Research Project.
We collected data from the patient registries on all patients ≥18 years with a national identity number who were admitted to hospitals in Korea. ICH patients were defined as patients with intracerebral hemorrhagic stroke as the primary disease (International Classification of Disease, 10th version [ICD-10] : I61) and who were admitted emergency department within days of the symptom onset. To rule out traumatic hemorrhagic stroke, patients with traumatic injuries were excluded from the study. To minimize possible confusion with multiple cases from the same patient, we limited the data set to patients with the first hemorrhagic stroke who were not hospitalized for primary or secondary disease related to hemorrhagic stroke in the past year. The type of surgery studied was limited to burr hole, trephination, craniotomy, and craniectomy, which are the main surgical techniques used to treat ICH (N0322, N0323, N0324, N0333, S4621, S4622). We analyzed these selected patients and tracked the data during the follow-up period. Patients included in this study were monitored until April 2021. The main outcome of this study was short-term mortality, evaluated at 3-month and 1-year timepoints; and long-term mortality, evaluated at 2-year and 4-year timepoints after onset of ICH. Mortality was identified based on ASAR data, and records were linked between the ASAR data and HIRA database using the previously described anonymized identification codes.

Study population

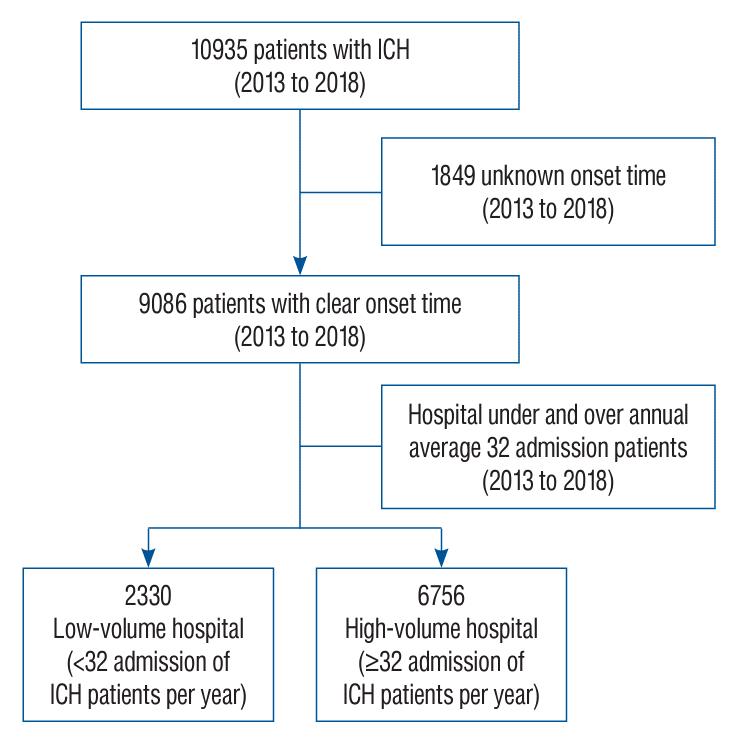
During the study period, which totaled 18 months, 10935 ICH patients were admitted to emergency departments. To analyze and compare treatment effects, patients receiving conservative treatment for ICH were excluded. In addition, 1849 patients were excluded due to unknown onset times. Hospitals were placed in order from those with low volume of admission to those with high volume of admission and were divided into two groups according to the number of patients admission to avoid intentional cut-off level bias. The cut-off value of two groups—high-volume hospitals (≥32 admissions of ICH patients per year) and low-volume hospitals (<32 admissions of ICH patients per year (Fig. 1).
The severity of patients was divided into two groups according to the Glasgow coma scale (GCS) on admission : 1) mild clinical status (GCS ≥10) and 2) severe clinical status (GCS ≤ 9) [34]. Patients were also stratified by economic status by using the type of health insurance coverage : standard health insurance and medical aid. Patients were divided into groups based on smoking history : current smokers, ex-smokers, and nonsmokers. The Charlson comorbidity index (CCI) was divided into four groups with using the ICD-10 code : CCI scores of 0, 1, 2, and ≥3. The use of emergency medical services (EMS) before arrival at the hospital was collected. Patients’ onset-to-door time and door-to-image time were also calculated. Functional outcome at discharge was defined as good functional outcome and poor functional outcome; the good functional outcome was defined as 75 to 99 points on the Korean version of modified Barthel index, modified Barthel index, or Barthel index [9]; 90 or higher on Functional independence measure [27]; 2 or lower on the modified Rankin scale [31] and patients with Glasgow outcome scale 5 [28]. The mortality rate after admission was determined at four timepoints : at within 3 months, 1 year, 2 years, and 4 years after onset.

Hospital costs

Data on hospital costs were collected from HIRA data, with information concerning all direct medical costs for beds, staff, surgeries, medications, rehabilitation, and other minor expenses such as commissions. The total amount of claim care benefit expenses and total amount of drug details of medical institutions of those patients with main disease ICH was defined as hospital cost. The cost was calculated on the Korean Won (₩) then converted to the United States dollar (USD; $) using an exchange rate of $1 = ₩808 according to the exchange rate provided by the Purchasing Power Parities of 2022 from the OECD [36].

Statistical analysis

We compared the difference between high- and low-volume hospitals using the chi-squared test for categorical variables. Descriptive data were expressed as numbers and percentages. receiver operating characteristic (ROC) curve analysis with Youden’s index was performed to calculate optimal cut-off values for yearly admission of patients by hospitals [20]. The Youden’s index (sensitivity + specificity − 1) was calculated from the cut-off point of the number of patients admission. We obtained the best cut-off point of the number of patients admission at the largest Youden’s index [10,25]. We conducted Kaplan-Meier survival estimates and the difference between survival curves was tested using the log-rank test stratified by matched sets. The hazard ratio (HR) of ICH associated with the treatment method and 95% confidence intervals (CIs) were estimated by using Cox proportional hazard models. Potential confounding factors were adjusted in the Cox regression analysis. Data analysis was performed with using SAS version 9.3 (SAS Institute Inc., Cary, NC, USA). A two-sided test with p<0.05 was considered statistically significant.

RESULTS

Baseline characteristics

The baseline characteristics of ICH patients who were hospitalized during the tracking period were demonstrated in Table 1. A total of 9086 patients were treated during 18-month period. The 5167 patients (56.87%) were aged over 60 years old and 5086 patients (55.98%) were male. The 2271 patients (25.81%) had severe clinical status on admission. The 4558 patients (92.27%) had health insurance, and 382 patients (7.73%) had medical aid. The 6431 patients (70.78%) were admitted within 4.5 hours after symptom onset. The 6747 patients (74.36%) arrived at the hospital via EMS. The 7216 patients (93.22%) were scanned computed tomography or magnetic resonance image within 1 hour after admission to the emergency department. The 4090 patients (45.01%) were treated in tertiary hospitals, and 4996 patients (54.99%) were treated in general hospitals. The 1003 patients (11.04%) underwent surgery, while 8083 patients (88.96%) did not undergo surgery. The 5552 patients (62.17%) were discharged with good functional outcomes, while 3379 patients (37.83%) were discharged with poor functional outcomes.

Mortality of ICH patients

The 3-month, 1-year, 2-year, and 4-year mortality of ICH patients were 18.25% (1658 patients), 23.87% (2169 patients), 27.88% (2533 patients), and 35.74% (2004 patients), respectively.
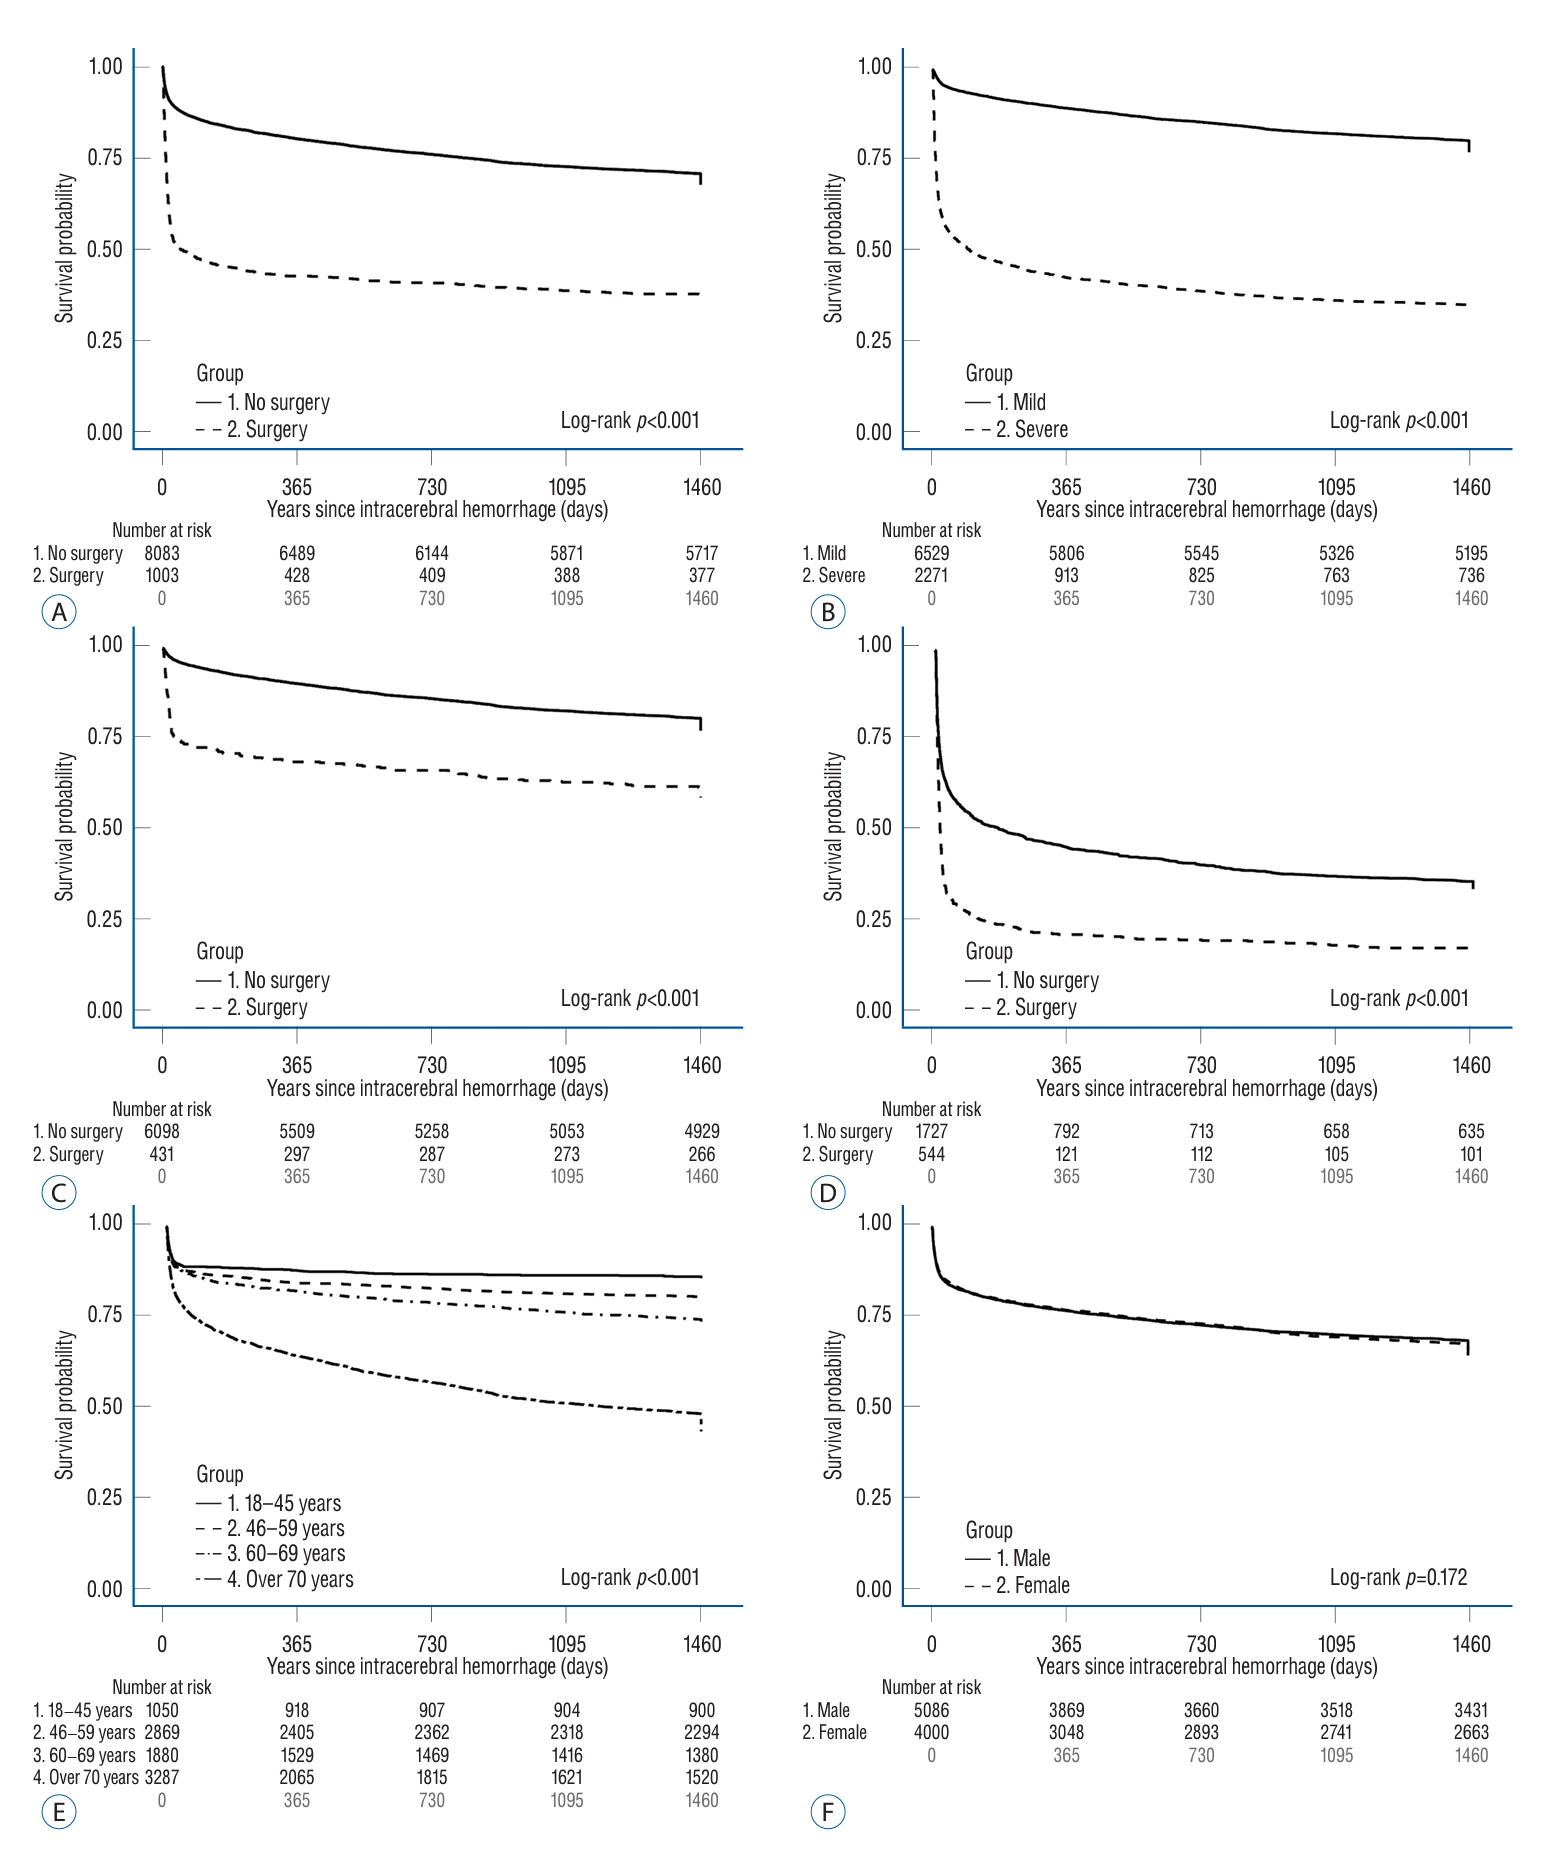
Kaplan-Meier survival analysis was performed to determine the survival rate according to the hospital volume or treatment method in ICH patients who underwent surgery. Patients who underwent surgery had a significantly higher survival rate than patients who did not undergo surgery (log-rank test, p<0.001; Fig. 2A). Patients with severe clinical status had a significantly lower survival rates than patients with mild clinical status (log-rank test, p<0.001; Fig. 2B). In both mild and severe clinical status, patients who underwent surgery had a significantly higher survival rates than patients who did not undergo surgery (log-rank test, p<0.001; Fig. 2C and D). Older aged patients had a significantly lower survival rates than younger aged patients when comparing patients groups who were aged 18–45, 46–59, 60–69, and over 70 (log-rank test, p<0.001; Fig. 2E). There was no statistically significant difference in survival rate between male and female patients (log-rank test, p=0.172; Fig. 2F).

Baseline characteristics by medical facility type

From our study of 263 hospitals, thirty percent of hospitals (78 hospitals) were high-volume hospitals, and 70% of hospitals (185 hospitals) were low-volume hospitals. Seventy-four percent of ICH patients (6756 patients) were admitted to high-volume hospitals and 26% of ICH patients (2330 patients) were admitted to low-volume hospitals. Eleven percent of patients (747/6756) underwent surgery in high-volume hospitals, and 11% of patients (256/2330) underwent surgery in low-volume hospitals. There was no significant difference in the proportion of patients who underwent surgery and those that did not undergo surgery between the two hospital volume groups (p=0.926). There was also no significant difference between the high-volume group and the low-volume group for onset-to-door time (p=0.798). The number of patients over 70 years of age was higher in low-volume hospitals (n=944; 40.5%) than that in high-volume hospitals (n=2343; 34.7%) (p<0.001). The number of patients with severe clinical status was higher in low-volume hospitals (n=604; 28.4%) than high-volume hospitals (n=1667; 25.0%) (p=0.002). The distribution of sex ratio, CCI between high-volume hospitals and low-volume hospitals did not differ significantly (p>0.05).

Mortality according to medical facility type

The result in univariate analysis showed that ICH patients in high-volume hospitals had significantly lower short- and long-term mortality than those of low-volume hospitals (p<0.05). When comparing low-volume hospitals and high-volume hospitals, mortality at all timepoints was significantly lower in the high-volume hospitals, for 3-month mortality (21.0% vs. 17.3%), 1-year mortality (26.8% vs. 22.9%), 2-year mortality (31.7% vs. 26.6%), and 4-year mortality (41.6% vs. 33.7%) (p<0.05).
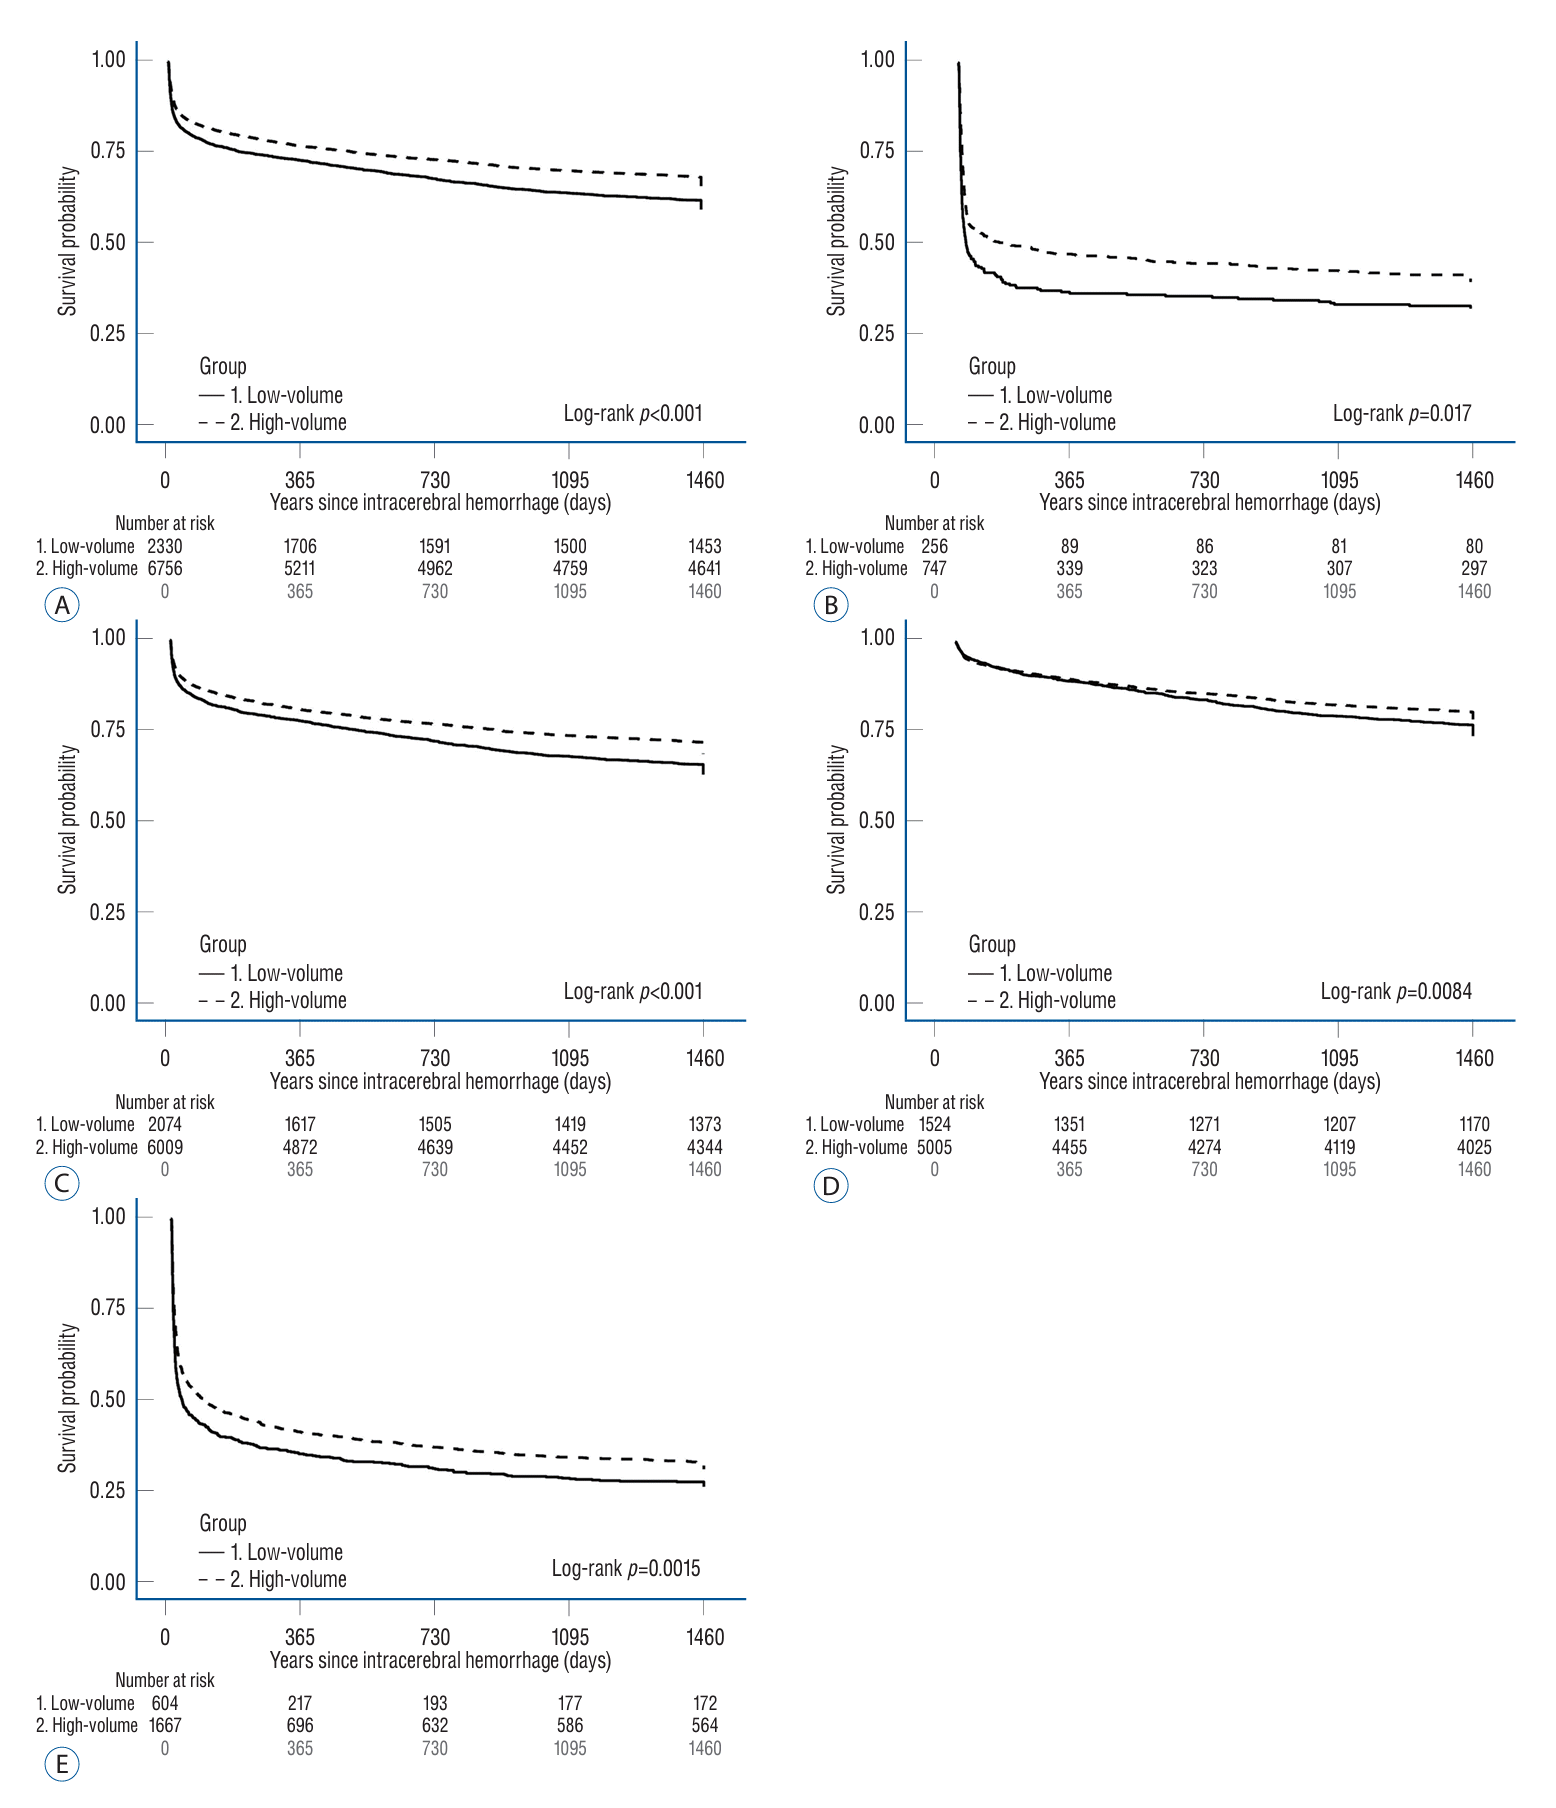
In Kaplan-Meier survival analysis, high-volume hospitals had significantly higher survival rates compared to low-volume hospitals when compared for all patients (log-rank test, p<0.001; Fig. 3A). Patients who underwent surgery in the high-volume hospitals had a significantly higher survival rates than low-volume hospitals (log-rank test, p=0.017; Fig. 3B). Patients who did not undergo surgery in high-volume hospitals had a significantly higher survival rates than patients in low-volume hospitals (log-rank test, p<0.001; Fig. 3C). For patients with mild clinical status, the high-volume hospitals had a significantly higher survival rate than low-volume (log-rank test, p=0.0084; Fig. 3D). Also, for patients with severe clinical status, high-volume hospitals had a significantly higher survival rate than low-volume hospitals (log-rank test, p=0.015; Fig. 3E).

Multivariate logistic regression of functional outcome at discharge

Logistic regression analysis was performed with the variables corrected since the patient’s poor outcome at discharge differed by hospital volume, and the distribution according to the patient’s baseline characteristics was also significantly different. The results of multivariate logistic analysis are displayed in Table 2. After adjusting for all covariates in the model, including the severity of ICH and whether surgery was performed or not, high-volume hospitals were associated with lower odds for poor outcomes at discharge compared with the low-volume hospitals (odds ratio [OR], 0.81; 95% CI, 0.72–0.91; p<0.001). Surgery for ICH was strongly associated with poor outcomes at discharge compared with non-surgery (OR, 2.31; 95% CI, 1.90–2.81; p<0.001). Patients with severe clinical status were associated with poor outcome at discharge compared with mild clinical status (OR, 8.50; 95% CI, 7.20–10.02; p<0.001). Patients aged over 70 was associated with OR for poor outcome at discharge compared with patients aged between 18 and 45 (OR, 2.24; 95% CI, 1.89–2.66; p<0.001). Sex difference was not associated with poor outcome at discharge (OR, 1.01; 95% CI, 0.91–1.12; p=0.893). Patients who arrived hospital without EMS was associated with poor outcome at discharge compared with patients with EMS (OR, 0.40; 95% CI, 0.36–0.45; p<0.001). Patients with CCI over 3 were associated with poor outcomes at discharge compared with CCI 0 (OR, 2.84; 95% CI, 2.48–3.25; p<0.001).

Cox analysis of death of ICH patients

Supplementary Table 1 shows results from Cox analysis of ICH patient mortality during short- and long-term follow-up. High-volume hospitals had significantly lower 3-month (HR, 0.90; 95% CI, 0.83–0.98; p=0.0121), 1-year (HR, 0.89; 95% CI, 0.82–0.97; p=0.0046), and 4-year mortality (HR, 0.89; 95% CI, 0.81–0.98; p=0.0181) than low-volume hospitals. High-volume hospitals had lower 3-month mortality than low-volume hospitals. However, difference was not statistically significant (HR, 0.97; 95% CI, 0.89–1.05; p=0.3754). Patients who underwent surgery had significantly higher 3-month (HR, 1.30; 95% CI, 1.18–1.42; p<0.0001), 1-year (HR, 1.49; 95% CI, 1.36–1.63; p<0.0001), 2-year (HR, 1.61; 95% CI, 1.47–1.77; p<0.0001), and 4-year (HR, 1.59; 95% CI, 1.42–1.78; p<0.0001) mortality compared with patients who did not undergo surgery. Patients aged over 70 had significantly higher 3-month (HR, 3.33; 95% CI, 2.81–3.96), 1-year (HR, 2.33; 95% CI, 1.96–2.77), 2-year (HR, 1.67; 95% CI, 1.41–1.99) mortality rate than patients aged between 18 and 45. Female had significantly lower 3-month (HR, 0.83; 95% CI, 0.78–0.90; p<0.0001), 1-year (HR, 0.89; 95% CI, 0.83–0.96; p=0.0025) mortality rate than male. Patients who did not arrive at the hospital through EMS had lower 3-month (HR, 0.81; 95% CI, 0.73–0.90; p<0.0001), 1-year (HR, 0.85; 95% CI, 0.77–0.94; p=0.0017), 2-year (HR, 0.85; 95% CI, 0.77–0.94; p=0.0011), and 4-year (HR, 0.86; 95% CI, 0.77–0.97; p=0.0142) mortality than patients who arrived at the hospital through EMS. CCI difference did not show significant statistical differences at the 3-month follow-up. However, patients with CCI over 3 had significantly lower 1-year (HR, 0.68; 95% CI, 0.61–0.75; p<0.0001), 2-year (HR, 0.67; 95% CI, 0.61–0.74; p<0.0001), and 4-year (HR, 0.62; 95% CI, 0.55–0.70; p<0.0001) mortality than patients with a CCI of 0.

Cox analysis of death according to patients’ severity

We performed Cox analysis according to the severity of clinical status (Table 3). In Cox analysis of death for patients with mild clinical status, high-volume hospitals had a significantly lower 1-year mortality than low-volume hospitals. However, there was no statistical difference in 3-month, 2-year, and 4-year mortality between high-volume and low-volume hospitals in mild clinical status (p>0.05). Patients who underwent surgery had significantly higher mortality than patients who did not get surgery during short- and long-term follow-up (p<0.05). Very old age (≥70 years) had significantly higher short- and long-term mortality than patients aged 18–45 (p<0.05). Females had significantly lower mortality than males during both short- and long-term follow-up. Patients who did not arrive at the hospital via EMS had lower 3-month, 1-year, and 2-year mortality than patients who arrived at the hospital via EMS (p<0.05).
In severe clinical status, high-volume hospitals had significantly lower mortality for short- and long-term follow-up (p<0.05). Very old age patients (≥70 years old) had a significantly higher 3-month, 4-year mortality than patients aged 18–45 (p<0.05). However, the difference was not statistically significant in 1-year and 2-year (p>0.05). Females had significantly lower 3-month mortality than males. However, there was no statistical difference in 1-year, 2-year, and 4-year mortality in sex difference (p>0.05). There was no statistical difference in the use of EMS during short- and long-term follow-up (p>0.05).

Hospital costs of ICH patients

Supplementary Table 2 shows the hospital cost by hospital volume and surgical treatment of ICH patients. The cost was presented as mean±standard deviation. The total hospital cost was $10650.01±$16713.25 (range, $560.93–$333688.04). Total hospital cost was higher in high-volume hospitals compared with low-volume hospitals ($9798.82±$16259.93 vs. $10967.41 ±$16870.39; p=0.0288).
As a result of cost analysis according to surgery, total hospital cost was higher in patients underwent surgery compared with patients who did not undergo surgery ($18587.50±$20239.47 vs. $8628.35±$15036.66; p<0.001).

DISCUSSION

The 3-month, 1-year, 2-year, and 4-year mortality rates for Korean ICH patients were each 18.25%, 23.87%, 27.88%, and 35.74%, respectively, which was lower than the previous study showing the 1-year mortality rate of 53% in Kentucky [6]. In this Korean study, 58.6% of patients arrived at the hospital within 4.5 hours after symptom onset, which is significantly higher than in the Netherlands, where 28–44% of patients arrived within 4.5 hours [18]. In Korea, patients have the freedom to go to any doctor or any medical institution, including general hospitals. In a previous research investigating medical accessibility in Korea, 61% of all patients resided within 30 minutes from the hospital, 78% resided within 60 minutes, and 92% resided within 120 minutes [15]. As medical accessibility in Korea is well-known, the distribution of 263 hospitals nationwide was typically evenly distributed. And because national insurance coverage was relatively high, emergency patients can receive timely treatment at hospitals [33].
We calculated the optimal cut-off value of inpatients for hospital classification through ROC curve analysis. ROC curve analysis is used to evaluate the usefulness of diagnostic/test tools or compare their discriminability with other tools. Youden index is one of the methods to find the cut-off point with the highest score on the ROC curve [10,25], and is used as a method to find the optimal threshold value when conducting research according to hospital volume [23]. Sensitivity, specificity, and Youden’s index through ROC curve analysis were the highest when the number of annual admission of patients was 32. Therefore, the cutoff value for classifying high-volume hospitals and low-volume hospitals was selected as the annual admission of 32 patients.
Mortality rates of ICH patients were separately investigated in high-volume hospitals and low-volume hospitals at 3-month, 1-year, 2-year, and 4-year timepoints. We found that at all timepoints—3-month, 1-year, 2-year, and 4-year—mortality was significantly lower in high-volume hospitals (p<0.05). Like acute ischemic stroke and SAH, ICH also showed lower mortality in high-volume hospitals [19,21,22]. Previous studies about acute ischemic stroke and SAH have reported that medical facilities, including stroke units and skilled neurosurgeons, are important for patient functional outcomes or hospital mortality [11,14,21]. Another study investigating stroke treatment in Korea showed that higher admission number of patients was associated with better quality of stroke treatment, and that inpatient count is also associated with quality of care [19]. Although there are limited studies investigating the relationship between hospital volume and mortality in ICH, our study has demonstrated that high-volume hospitals are more likely to lead to positive outcomes.
In baseline characteristics, the proportion of poor functional outcomes at discharge was higher in high-volume hospitals than low-volume hospitals (39.90% vs. 31.71%). However, in logistic regression analysis that corrected confounding factors, high-volume had lower OR of poor outcome at discharge than low-volume hospitals (OR, 0.80; 95% CI, 0.72–0.91). Patients who treated at high-volume hospitals had better outcomes and this contributed to the lower mortality rates at high-volume hospitals. Patients with poor functional outcomes in early ICH have higher probability of complications, which is thought to result in high long-term mortality [24].
The general theory for the differences in mortality with respect to hospital volume—practice-makes-perfect theory and selective-referral pattern theory—are constantly discussed [26]. Some theories say that treatment outcomes improve as the skills of surgeons and other assistants improve by performing numerous surgeries [12]. Other theories suggest that skilled surgeons and hospitals with better outcomes attract more patients [4,26]. We found that the mortality rate was lower in high-volume hospitals, which have many specialists, such as neurosurgeons, neurologist units, and stroke units, that attract patients. By practice-makes-perfect theory, surgeons in high-volume hospitals can also improve their surgical techniques. In addition, the proportion of stroke units and tertiary hospital was significantly higher in high-volume hospitals compared to low-volume hospitals. In the current study, 4658 patients (68.95%) were treated in high-volume hospitals that included a stroke unit, and 664 patients (28.50%) were treated in low-volume hospitals that included a stroke unit. Also, 3947 patients (58.42%) were treated in high-volume hospital which were tertiary hospital, and 143 patients (6.14%) were treated in low-volume hospital which were tertiary hospital (p<0.001). As in previous studies, where treatment in stroke units was associated with better functional outcomes and lower mortality compared to non-specialized intensive care units and normal wards, mortality rates were lower in high-volume hospitals with a higher proportion of stroke units [35]. The difference in patient prognosis in high-volume hospitals and low-volume hospitals can also be explained by staffing levels. In a research that analyzed medical personnel of hospital in Korea’s Medical Care Institution Database, the number of beds and number of nursing assistants per beds in tertiary hospitals was higher than that in general hospitals [17]. In this study, the proportion of hospitals with more than 500 beds was 95.2% in tertiary hospitals and 16.6% in general hospitals. Also, the number of trainees (interns and residents) was higher in tertiary hospitals than general hospitals (22.3±5.6 vs. 4.1±5.2). Furthermore, in a study investigating the relationship between medical staff and patient outcomes, the proportion of hospital personnel was significantly associated with in-hospital mortality [29]. Differences in medical environment between high-volume hospitals and low-volume hospitals influenced the differences in patient prognosis.
Low-volume hospitals also had a higher proportion of patients with severe clinical status and elder patients than high-volume hospitals. This may be the result of getting patients with less chance of recovery to be treated in closer hospitals, or it may be because patients often prefer to be treated in smaller hospitals closer to home. A study in the USA also found that elderly people over the age of 65 often preferred to be treated at home rather than in a hospital for treatment of acute illness, and this tendency may have emerged in low-volume hospitals [8]. Given that the proportion of stroke units (68.95% vs. 28.50%) and tertiary hospitals (58.42% vs. 6.14%) were higher in high-volume hospitals, this may have also had an effect on the difference in mortality rate. Cox analysis was performed to correct for the factors acting as confounding variables. In the Cox analysis of mortality, high-volume hospitals had significantly lower 3-month, 1-year, and 4-year mortality (p<0.05). We linked clinical data to adjust for severity as a confounding factor, as treatment for severe clinical status patients is more difficult [1]. Cox analysis for mild clinical status patients only showed difference in 1-year mortality by hospital volume, but for severe clinical status patients, high-volume hospitals showed significantly lower 3-month, 1-year, 2-year, and 4-year mortality compared to low-volume hospitals. Our analyses also showed that the difference in the volume of patient admission was not significantly associated with mortality in patients with mild clinical status, while the increased volume of admission significantly lowered mortality in severe clinical status patients. This effect may be a result of better treatment of severe clinical status patients in high-volume hospitals, where there are more neurosurgeons and neurologists.
A previous study estimating the cost-effectiveness of transferring patients with ICH from a small hospital without stroke care units to a larger hospital with stroke care units showed that there was no significant difference in medical cost between high-volume hospitals and low-volume hospitals [7]. However, in our study, we found that in Korea, high-volume hospitals had significantly higher medical costs than low-volume hospitals. These results may reflect the characteristics of Korean medical system and infrastructure. The difference between skilled surgeons and assistants in the stroke care facility may be one factor driving the difference in cost. In addition, larger hospitals may have more diagnostic tests and prescribed medications per patient, which can increase costs.
Length of hospital stay was different between high-volume hospital and low-volume hospital. Length of hospital stay on high-volume hospital was shorter than that on low-volume hospital (9±2 vs. 15±4; p<0.05). Shorter length of hospital stay on high-volume hospital means that high-volume hospital had ICH patients with a poorer neurological status.
Despite we used nationwide data to overcome the limitation of previous studies, our study has a few limitations. First, the result of the imaging tests could not be confirmed, so location, volume of hemorrhage, and risk of impending cerebral injury could not be included in our data. The results of imaging tests are important factors in determining patient severity for accurate and fast diagnosis and treatment of ICH [13]. In this study, GCS, a tool for reflecting clinical severity that can be obtained from HIRA data, were used to divide patients by severity. Since analyses of imaging test results are more precise than GCS, a follow-up study using the results from image analysis is needed. Second, there is insufficient reference research regarding the division of hospitals into high-volume and low-volume hospitals. In our study, we conducted the analysis by ROC curve analysis based on tertiary hospitals and general hospitals. However, the criteria for classifying hospital volumes according to inpatients are not clear. Thus, a standardized approach for creating the two groups is necessary.
Our study analyzed the mortality rates within 3 months, 1 year, 2 years, and 4 years after admission in ICH patients in relation to the volume of admission. Mortality was significantly lower among patients who were treated in high-volume hospitals. In mild clinical status, the data only showed significant differences in 1-year mortality, but the differences in mortality for patients with severe clinical status were statistically significant in 3-month, 1-year, 2-year, and 4-year mortality. Although this study was limited to South Korea, it is meaningful in that it partially addresses the shortcomings of previous studies by analyzing a unified nationwide database and examining ICH patients.

CONCLUSION

This study has provided a national perspective on ICH patient mortality after hospitalization according to hospital volume in South Korea. Based on our national database study, it can be inferred that ICH should be treated by experienced neurosurgeons in hospitals with better facilities. Our results showed that ICH patients who were admitted to high-volume hospitals had significantly lower mortality rates than patients who were admitted to low-volume hospitals. In particular, we found that for patients who exhibited severe clinical ICH status, the difference in poor outcome at discharge, short-, and long-term mortality between low- and high-volume hospitals was statistically significant.

Notes

Conflicts of interest

No potential conflict of interest relevant to this article was reported.

Informed consent

This type of study does not require informed consent.

Author contributions

Conceptualization : BCL, YWL, GOK, JSO; Data curation : SWP, JJH, NHH, JSO; Formal analysis : SWP, JJH, NHH, JSO; Funding acquisition : JSO; Methodology : SWP, JJH, NHH, JSO; Project administration : BCL, YWL, GOK, JSO; Visualization : ECL, DHL, JYL, JSO; Writing - original draft : SWP, JJH, NHH, JSO; Writing - review & editing : SWP, JJH, JSO

Data sharing

None

Preprint

None

ACKNOWLEDGMENTS

This research was supported by a grant of Patient-Centered Clinical Research Coordinating Center (PACEN) funded by the Ministry of Health & Welfare, Republic of Korea (grant number : HC22C0043) by the Bio & Medical Technology Development Program of the National Research Foundation funded by the Korean government (2023RA1A2C100531).
The authors wish to acknowledge the financial support of The Catholic University of Korea Uijeongbu St. Mary’s Hospital Clinical Research Laboratory Foundation and Korea Neuroendovascular Society.
The funding sources had no role in the design and conduct of the study; collection, management, analysis, and interpretation of the data; preparation, review, or approval of the manuscript; and decision to submit the manuscript for publication.

Supplementary materials

The online-only data supplement is available with this article at https://doi.org/10.3340/jkns.2023.0205.
Supplementary Table 1.
cox analysis of death according to total 9086 intracerebral hemorrhage patients for 4 years
jkns-2023-0205-Supplementary-Table-1.pdf
Supplementary Table 2.
Hospital costs according to hospital volume and surgical treatment of intracerebral hemorrhage patients
jkns-2023-0205-Supplementary-Table-2.pdf

References

1. Chiu D, Peterson L, Elkind MSV, Rosand J, Gerber LM, Silverstein MD, et al. Comparison of outcomes after intracerebral hemorrhage and ischemic stroke. J Stroke Cerebrovasc Dis. 19:225–229. 2010.
crossref
2. Dudley RA, Johansen KL, Brand R, Rennie DJ, Milstein A. Selective referral to high-volume hospitals: estimating potentially avoidable deaths. JAMA. 283:1159–1166. 2000.
3. Durairaj L, Torner JC, Chrischilles EA, Vaughan Sarrazin MS, Yankey J, Rosenthal GE. Hospital volume-outcome relationships among medical admissions to ICUs. Chest. 128:1682–1689. 2005.
crossref
4. Farley DE, Ozminkowski RJ. Volume-outcome relationships and in-hospital mortality: the effect of changes in volume over time. Med Care. 30:77–94. 1992.
crossref
5. Feigin VL, Brainin M, Norrving B, Martins S, Sacco RL, Hacke W, et al. World Stroke Organization (WSO): global stroke fact sheet 2022. Int J Stroke. 17:18–29. 2022.
crossref
6. Flaherty ML, Haverbusch M, Sekar P, Kissela B, Kleindorfer D, Moomaw CJ, et al. Long-term mortality after intracerebral hemorrhage. Neurology. 66:1182–1186. 2006.
crossref
7. Fletcher JJ, Kotagal V, Mammoser A, Peterson M, Morgenstern LB, Burke JF. Cost-effectiveness of transfers to centers with neurological intensive care units after intracerebral hemorrhage. Stroke. 46:58–64. 2015.
crossref
8. Fried TR, van Doorn C, O’Leary JR, Tinetti ME, Drickamer MA. Older person’s preferences for home vs hospital care in the treatment of acute illness. Arch Intern Med. 160:1501–1506. 2000.
crossref
9. Hacke W, Albers G, Al-Rawi Y, Bogousslavsky J, Davalos A, Eliasziw M, et al. The Desmoteplase in Acute Ischemic Stroke Trial (DIAS): a phase II MRI-based 9-hour window acute stroke thrombolysis trial with intravenous desmoteplase. Stroke. 36:66–73. 2005.
crossref
10. Hajian-Tilaki K. The choice of methods in determining the optimal cutoff value for quantitative diagnostic test evaluation. Stat Methods Med Res. 27:2374–2383. 2018.
crossref
11. Hall RE, Fang J, Hodwitz K, Saposnik G, Bayley MT. Does the volume of ischemic stroke admissions relate to clinical outcomes in the ontario stroke system? Circ Cardiovasc Qual Outcomes. 8(6 Suppl 3):S141–S147. 2015.
crossref
12. Hamilton BH, Ho V. Does practice make perfect? Examining the relationship between hospital surgical volume and outcomes for hip fracture patients in Quebec. Med Care. 36:892–903. 1998.
13. Heit JJ, Iv M, Wintermark M. Imaging of intracranial hemorrhage. J Stroke. 19:11–27. 2017.
crossref
14. Heo NH, Lee MR, Yang KH, Hong OR, Shin JH, Lee BY, et al. Short- and long-term mortality after intravenous thrombolysis for acute ischemic stroke: a propensity score-matched cohort with 5-year follow-up. Medicine (Baltimore). 100:e27652. 2021.
15. Jang WM, Lee J, Eun SJ, Yim J, Kim Y, Kwak MY. Travel time to emergency care not by geographic time, but by optimal time: a nationwide cross-sectional study for establishing optimal hospital access time to emergency medical care in South Korea. PLoS One. 16:e0251116. 2021.
crossref
16. Kim JY, Kang K, Kang J, Koo J, Kim DH, Kim BJ, et al. Executive summary of stroke statistics in Korea 2018: a report from the Epidemiology Research Council of the Korean Stroke Society. J Stroke. 21:42–59. 2019.
crossref
17. Kim YM, June KJ, Cho SH. Factors related to nurse staffing levels in tertiary and general hospitals. Taehan Kanho Hakhoe Chi. 35:1493–1499. 2005.
crossref
18. Lahr MM, Luijckx GJ, Vroomen PC, van der Zee DJ, Buskens E. Proportion of patients treated with thrombolysis in a centralized versus a decentralized acute stroke care setting. Stroke. 43:1336–1340. 2012.
crossref
19. Lee BY, Ha S, Lee YH. Association between volume of surgery for acute hemorrhagic stroke and mortality. Medicine (Baltimore). 97:e12105. 2018.
crossref
20. Lee DW, Moon HJ, Heo NH; KoCARC. Association between ambulance response time and neurologic outcome in patients with cardiac arrest. Am J Emerg Med. 37:1999–2003. 2019.
crossref
21. Lee JY, Heo NH, Lee MR, Ahn JM, Oh HJ, Shim JJ, et al. Short and long-term outcomes of subarachnoid hemorrhage treatment according to hospital volume in Korea: a nationwide multicenter registry. J Korean Med Sci. 36:e146. 2021.
crossref
22. Lee KJ, Kim JY, Kang J, Kim BJ, Kim SE, Oh H, et al. Hospital volume and mortality in acute ischemic stroke patients: effect of adjustment for stroke severity. J Stroke Cerebrovasc Dis. 29:104753. 2020.
crossref
23. Leifer D, Fonarow GC, Hellkamp A, Baker D, Hoh BL, Prabhakaran S, et al. Association between hospital volumes and clinical outcomes for patients with nontraumatic subarachnoid hemorrhage. J Am Heart Assoc. 10:e018373. 2021.
crossref
24. Lindner A, Kofler M, Rass V, Ianosi B, Gaasch M, Schiefecker AJ, et al. Early predictors for infectious complications in patients with spontaneous intracerebral hemorrhage and their impact on outcome. Front Neurol. 10:817. 2019.
crossref
25. Liu X, Zhou M, Zhao J, Gao Y, Wang Y, Zhou J, et al. Functional independence and disability evaluation in stroke patients: optimal cutoff scores for a pictorial-based longshi scale, barthel index, and modified rankin scale. Front Neurol. 13:710852. 2022.
crossref
26. Luft HS, Hunt SS, Maerki SC. The volume-outcome relationship: practice-makes-perfect or selective-referral patterns? Health Serv Res. 22:157–182. 1987.
27. Luk JK, Cheung RT, Ho SL, Li L. Does age predict outcome in stroke rehabilitation? A study of 878 Chinese subjects. Cerebrovasc Dis. 21:229–234. 2006.
crossref
28. Mailles A, De Broucker T, Costanzo P, Martinez-Almoyna L, Vaillant V, Stahl JP, et al. Long-term outcome of patients presenting with acute infectious encephalitis of various causes in France. Clin Infect Dis. 54:1455–1464. 2012.
crossref
29. Sasichay-Akkadechanunt T, Scalzi CC, Jawad AF. The relationship between nurse staffing and patient outcomes. J Nurs Adm. 33:478–485. 2003.
crossref
30. Singla A, Simons J, Li Y, Csikesz NG, Ng SC, Tseng JF, et al. Admission volume determines outcome for patients with acute pancreatitis. Gastroenterology. 137:1995–2001. 2009.
crossref
31. Sobrino T, Hurtado O, Moro MA, Rodríguez-Yáñez M, Castellanos M, Brea D, et al. The increase of circulating endothelial progenitor cells after acute ischemic stroke is associated with good outcome. Stroke. 38:2759–2764. 2007.
crossref
32. Solomon RA, Mayer SA, Tarmey JJ. Relationship between the volume of craniotomies for cerebral aneurysm performed at New York state hospitals and in-hospital mortality. Stroke. 27:13–17. 1996.
crossref
33. Song SO, Jung CH, Song YD, Park CY, Kwon HS, Cha BS, et al. Background and data configuration process of a nationwide population-based study using the Korean national health insurance system. Diabetes Metab J. 38:395–403. 2014.
crossref
34. Starke RM, Komotar RJ, Kim GH, Kellner CP, Otten ML, Hahn DK, et al. Evaluation of a revised glasgow coma score scale in predicting long-term outcome of poor grade aneurysmal subarachnoid hemorrhage patients. J Clin Neurosci. 16:894–899. 2009.
crossref
35. Ungerer MN, Ringleb P, Reuter B, Stock C, Ippen F, Hyrenbach S, et al. Stroke unit admission is associated with better outcome and lower mortality in patients with intracerebral hemorrhage. Eur J Neurol. 27:825–832. 2020.
36. Yoneda Y, Okuda S, Hamada R, Toyota A, Gotoh J, Watanabe M, et al. Hospital cost of ischemic stroke and intracerebral hemorrhage in Japanese stroke centers. Health Policy. 73:202–211. 2005.
crossref

Fig. 1.
flow chart of study population and patients included in linear model of longitudinal changes in hospital volume. ICH : intracerebral hemorrhage.
jkns-2023-0205f1.tif
Fig. 2.
Kaplan-Meier estimates for survival probability based on specific conditions of intracerebral hemorrhage patients. A : Total patients stratified by surgery status. B : Total patients stratified by disease severity. C : Patients with mild clinical status stratified by surgery status. D : Patients with severe clinical status stratified by surgery status. E : Total patients stratified by age groups. F : Total patients stratified by sex.
jkns-2023-0205f2.tif
Fig. 3.
Kaplan-Meier estimate for survival probability based on specific conditions of intracerebral hemorrhage patients according to hospital volume. A : Total patients according to hospital type. B : Total patients undergo surgery according to hospital type. C : Total patients did not undergo surgery according to hospital type. D : Mild clinical status according to hospital type. E : Severe clinical status according to hospital type.
jkns-2023-0205f3.tif
Table 1.
Baseline characteristics of 9086 intracerebral hemorrhage patients
Variable Total Low volume hospital High volume hospital p-value
Total number of patients 9086 (100.00) 2330 (25.64) 6756 (74.36)
Total number of hospitals 263 (100.00) 185 (70.34) 78 (29.66)
Age
 18–45 years 1050 (11.55) 240 (10.30) 810 (11.99) <0.001*
 46–59 years 2869 (31.58) 672 (28.84) 2197 (32.52)
 60–69 years 1880 (20.69) 474 (20.34) 1406 (20.81)
 ≥70 years 3287 (36.18) 944 (40.52) 2343 (34.68)
Gender
 Male 5086 (55.98) 1268 (54.42) 3818 (56.51) 0.079
 Female 4000 (44.02) 1062 (45.58) 2938 (43.49)
Health insurance type
 Health insurance 4558 (92.27) 1216 (90.68) 3342 (92.86) 0.011*
 Medical aid 382 (7.73) 125 (9.32) 257 (7.14)
GCS score
 13–15 5528 (62.82) 1287 (60.48) 4241 (63.56) 0.008
 9–12 1404 (15.95) 340 (15.98) 1064 (15.95)
 0–8 1868 (21.23) 501 (23.54) 1367 (20.49)
Severity
 Mild 6529 (74.19) 1524 (71.62) 5005 (75.01) 0.002*
 Severe 2271 (25.81) 604 (28.38) 1667 (24.99)
Medical history
 Smoker
  Current smoker 1052 (19.59) 247 (19.30) 805 (19.68) 0.395
  Ex-smoker 418 (7.78) 111 (8.67) 307 (7.51)
  Non-smoker 3900 (72.63) 922 (72.03) 2978 (72.81)
 CCI score
  0 1737 (19.12) 416 (17.85) 1321 (19.55) 0.187
  1 1413 (15.55) 370 (15.88) 1043 (15.44)
  2 1548 (17.04) 421 (18.07) 1127 (16.68)
  ≥3 4388 (48.29) 1123 (48.20) 3265 (48.33)
Arrival mode
 EMS 6747 (74.36) 1680 (72.51) 5067 (75.00) 0.018*
 No EMS 2326 (25.64) 637 (27.49) 1689 (25.00)
Onset to door time
 ≤4.5 hours 6431 (70.78) 1654 (70.99) 4777 (70.71) 0.798
 >4.5 hours 2655 (29.22) 676 (29.01) 1979 (29.29)
Facility type
 Tertiary hospital 4090 (45.01) 143 (6.14) 3947 (58.42) <0.001*
 General hospital 4996 (54.99) 2187 (93.86) 2809 (41.58)
Door to image time
 ≤1 hour 7216 (93.22) 1814 (93.65) 5402 (93.07) 0.383
 >1 hour 525 (6.78) 123 (6.35) 402 (6.93)
Stroke unit
 Yes 5322 (58.57) 664 (28.50) 4658 (68.95) <0.001
 No 3764 (41.43) 1666 (71.50) 2098 (31.05)
Surgery type
 No surgery 8083 (88.96) 2074 (89.01) 6009 (88.94) 0.926
 Surgery 1003 (11.04) 256 (10.99) 747 (11.06)
Functional outcome at discharge
 Good outcome 3379 (37.83) 1538 (68.29) 4014 (60.10) <0.001
 Poor outcome 5552 (62.17) 714 (31.71) 2665 (39.90)
mRS (52.60%)
 0 389 (8.14) 78 (7.25) 311 (8.40) 0.012*
 1 1153 (24.13) 257 (23.88) 896 (24.20)
 2 755 (15.80) 158 (14.68) 597 (16.12)
 3 579 (12.12) 126 (11.71) 453 (12.23)
 4 966 (20.21) 211 (19.62) 755 (20.39)
 5 620 (12.97) 148 (13.75) 472 (12.75)
 6 317 (6.63) 98 (9.11) 219 (5.91)
GOS (20.04%)
 1 179 (9.83) 32 (10.16) 147 (9.76) 0.002*
 2 123 (6.75) 28 (8.89) 95 (6.31)
 3 356 (19.55) 78 (24.76) 278 (18.46)
 4 477 (26.19) 87 (27.62) 390 (25.90)
 5 686 (37.68) 90 (28.57) 596 (39.57)
Number of deaths
 3-month (2013, 2014, 2016, 2018) 1658 (18.25) 490 (21.03) 1168 (17.29) <0.001*
 1-year (2013, 2014, 2016, 2018) 2169 (23.87) 624 (26.78) 1545 (22.87) <0.001*
 2-year (2013, 2014, 2016, 2018) 2533 (27.88) 739 (31.72) 1794 (26.55) <0.001*
 4-year (2013, 2014, 2016; n=5607) 2004 (35.74) 600 (41.64) 1404 (33.70) <0.001*

Values are presented as number (%). Mild severity = NIHSS ≤15, GCS ≥10; severe severity = NIHSS ≥16, GCS ≤9. Good outcome : K-MBI (75–99), MBI (75–99), BI (75–99), mRS (0–2), FIM (90–126), GOS (5). Patients who had no record of functional outcome at discharge were excluded. mRS was used in 52.6%, and GOS was 20.4%.

* p<0.05 significance.

GCS : Glasgow coma scale, CCI : Charlson comorbidity index, EMS : emergency medical services, mRS : modified Rankin scale, GOS : Glasgow outcome scale, NIHSS : National Institutes of Health Stroke Scale, K-MBI : Korean version of modified Barthel index, MBI : modified Barthel index, BI : Barthel index, FIM : Functional independence measure

Table 2.
Multivariate logistic analysis outcome of poor outcome at discharge
Poor outcome at discharge
OR (95% CI) p-value
Medical facility type
 Low-volume hospital 1.0
 High-volume hospital 0.81 (0.72–0.91)* <0.001
Surgery type
 No surgery 1.0
 Surgery 2.31 (1.90–2.81)* <0.001
Severity
 Mild 1.0
 Severe 8.50 (7.20–10.02)* <0.001
Age
 18–45 years 1.0
 46–59 years 1.08 (0.91–1.28) 0.386
 60–69 years 1.28 (1.07–1.53)* 0.007
 ≥70 years 2.24 (1.89–2.66)* <0.001
Gender
 Male 1.0
 Female 1.01 (0.91–1.12) 0.893
Arrival mode
 EMS 1.0
 No EMS 0.40 (0.36–0.45)* <0.001
Medical history
 CCI score
  0 1.0
  1 1.09 (0.92–1.29) 0.325
  2 1.56 (1.33–1.83)* <0.001
  ≥3 2.84 (2.48–3.25)* <0.001

Mild severity = NIHSS ≤15, GCS ≥10; severe severity = NIHSS ≥16, GCS ≤9.

* p<0.05 significance.

OR : odds ratio, CI : confidence interval, EMS : emergency medical services, CCI : Charlson comorbidity index, NIHSS : National Institutes of Health Stroke Scale, GCS : Glasgow coma scale

Table 3.
Cox analysis of death according to mild and severe clinical status of intracerebral hemorrhage patients for 4 years
3-month
1-year
2-year
4-year
Mild
Severe
Mild
Severe
Mild
Severe
Mild
Severe
HR (95% CI) HR (95% CI) HR (95% CI) HR (95% CI) HR (95% CI) HR (95% CI) HR (95% CI) HR (95% CI)
Medical facility type
 Low-volume hospital 1.0 1.0 1.0 1.0 1.0 1.0 1.0 1.0
 High-volume hospital 0.93 (0.83–1.04) 0.87 (0.77–0.97)* 0.89 (0.79–1.00)* 0.87 (0.77–0.97)* 1.03 (0.91–1.15) 0.89 (0.79–0.99)* 1.02 (0.89–1.17) 0.78 (0.68–0.89)
Surgery type
 No surgery 1.0 1.0 1.0 1.0 1.0 1.0 1.0 1.0
 Surgery 1.63 (1.38–1.91) 1.15 (1.03–1.29)* 1.88 (1.60–2.21) 1.28 (1.14–1.44) 2.25 (1.91–2.64) 1.34 (1.19–1.50) 1.71 (1.41–2.07) 1.46 (1.27–1.68)
Age
 18–45 years 1.0 1.0 1.0 1.0 1.0 1.0 1.0 1.0
 46–59 years 2.04 (1.45–2.86) 1.10 (0.89–1.36) 1.91 (1.36–2.69) 0.96 (0.78–1.19) 1.84 (1.31–2.59) 0.94 (0.76–1.17) 1.50 (1.01–2.23)* 0.80 (0.62–1.03)
 60–69 years 3.25 (2.32–4.57) 1.34 (1.07–1.67)* 2.84 (2.02–3.99) 1.18 (0.94–1.47) 2.45 (1.74–3.44) 1.05 (0.84–1.32) 1.59 (1.06–2.38)* 0.77 (0.59–1.00)
 ≥70 years 9.03 (6.53–12.48) 1.50 (1.22–1.84) 6.55 (4.73–9.08) 1.10 (0.90–1.36) 4.39 (3.16–6.10) 0.90 (0.74–1.11) 2.45 (1.67–3.61) 0.72 (0.56–0.92)
Gender
 Male 1.0 1.0 1.0 1.0 1.0 1.0 1.0 1.0
 Female 0.80 (0.72–0.88) 0.90 (0.81–1.00)* 0.81 (0.73–090) 0.97 (0.88–1.08) 0.89 (0.81–0.99)* 1.08 (0.97–1.20) 0.88 (0.78–0.99)* 1.03 (0.91–1.18)
Arrival mode
 EMS 1.0 1.0 1.0 1.0 1.0 1.0 1.0 1.0
 No EMS 0.86 (0.77–0.97)* 0.90 (0.74–1.09) 0.87 (0.77–0.98)* 0.94 (0.77–1.14) 0.89 (0.79–1.00)* 0.93 (0.77–1.13) 0.90 (0.78–1.03) 0.94 (0.74–1.18)
Medical history
 CCI score
  0 1.0 1.0 1.0 1.0 1.0 1.0 1.0 1.0
  1 1.04 (0.86–1.26) 0.92 (0.79–1.07) 1.02 (0.84–1.23) 0.82 (0.70–0.96)* 1.03 (0.86–1.25) 1.03 (0.88–1.20) 0.99 (0.79–1.23) 0.96 (0.79–1.16)
  2 0.96 (0.80–1.15) 0.79 (0.67–0.93) 0.97 (0.81–1.16) 0.64 (0.55–0.76) 0.98 (0.82–1.17) 0.74 (0.63–0.87) 1.05 (0.85–1.30) 0.68 (0.56–0.83)
  ≥3 1.29 (1.11–1.49) 0.67 (0.58–0.77) 1.05 (0.91–1.22) 0.45 (0.39–0.52) 0.95 (0.82–1.10) 0.48 (0.42–0.55) 0.89 (0.75–1.05) 0.44 (0.38–0.52)

Mild severity = NIHSS ≤15, GCS ≥10; severe severity = NIHSS ≥16, GCS ≤9.

* p<0.05 significance.

p<0.001 significance.

HR : hazard ratio, CI : confidence interval, EMS : emergency medical services, CCI : Charlson comorbidity index, NIHSS : National Institutes of Health Stroke Scale, GCS : Glasgow coma scale

TOOLS
Similar articles