Journal List > J Pathol Transl Med > v.58(6) > 1516088933

Pyo, Cha, and Hong: TERT mutations and aggressive histopathologic characteristics of radioiodine-refractory papillary thyroid cancer

Abstract

Background

Radioiodine (RI) ablation following thyroid-stimulating hormone suppression is an effective treatment for papillary thyroid cancer (PTC), typically leading to favorable outcomes. However, RI-refractory tumors exhibit aggressive behavior and poor prognoses. Recent studies highlight the role of genetic abnormalities in PTC signaling pathways, including the activation of telomerase reverse transcriptase (TERT), and the correlation of mutations with adverse outcomes.

Methods

This study analyzed mutations in BRAF V600E and the TERT-promoter genes, comparing clinicopathological features between RI-refractory and RI-responsive PTCs. Among 82 RI-refractory patients, formalin-fixed, paraffin-embedded tissues from initial surgeries were available for 26. Another 89 without distant metastasis over 5 years formed a matched RI-responsive control group.

Results

Histopathologically, RI-refractory PTCs showed increased frequencies of small tumor clusters without fibrovascular cores, hobnail features, and a high height-to-width ratio of tumor cells. These tumors were more likely to exhibit necrosis, mitosis, lymph node metastasis, extrathyroidal extension, and involvement of resection margins. TERT-promoter mutations were statistically significantly associated with these aggressive clinicopathologic features. Immunohistochemically, decreased expression of sodium iodide symporter and thyroglobulin stimulating hormone receptor proteins was common in RI-refractory PTCs, along with lower levels of oncogenic proteins such as vascular endothelial cell growth factor, vascular endothelial cell growth factor receptor 2, and nuclear factor kappa-light-chain-enhancer of activated B cells. Total loss of PTEN expression was occasionally observed. In contrast, all cases tested positive for cytoplasmic β-catenin.

Conclusions

RI-refractory PTCs are linked to TERT mutations and exhibit specific aggressive histopathologic features, particularly in tumor centers.

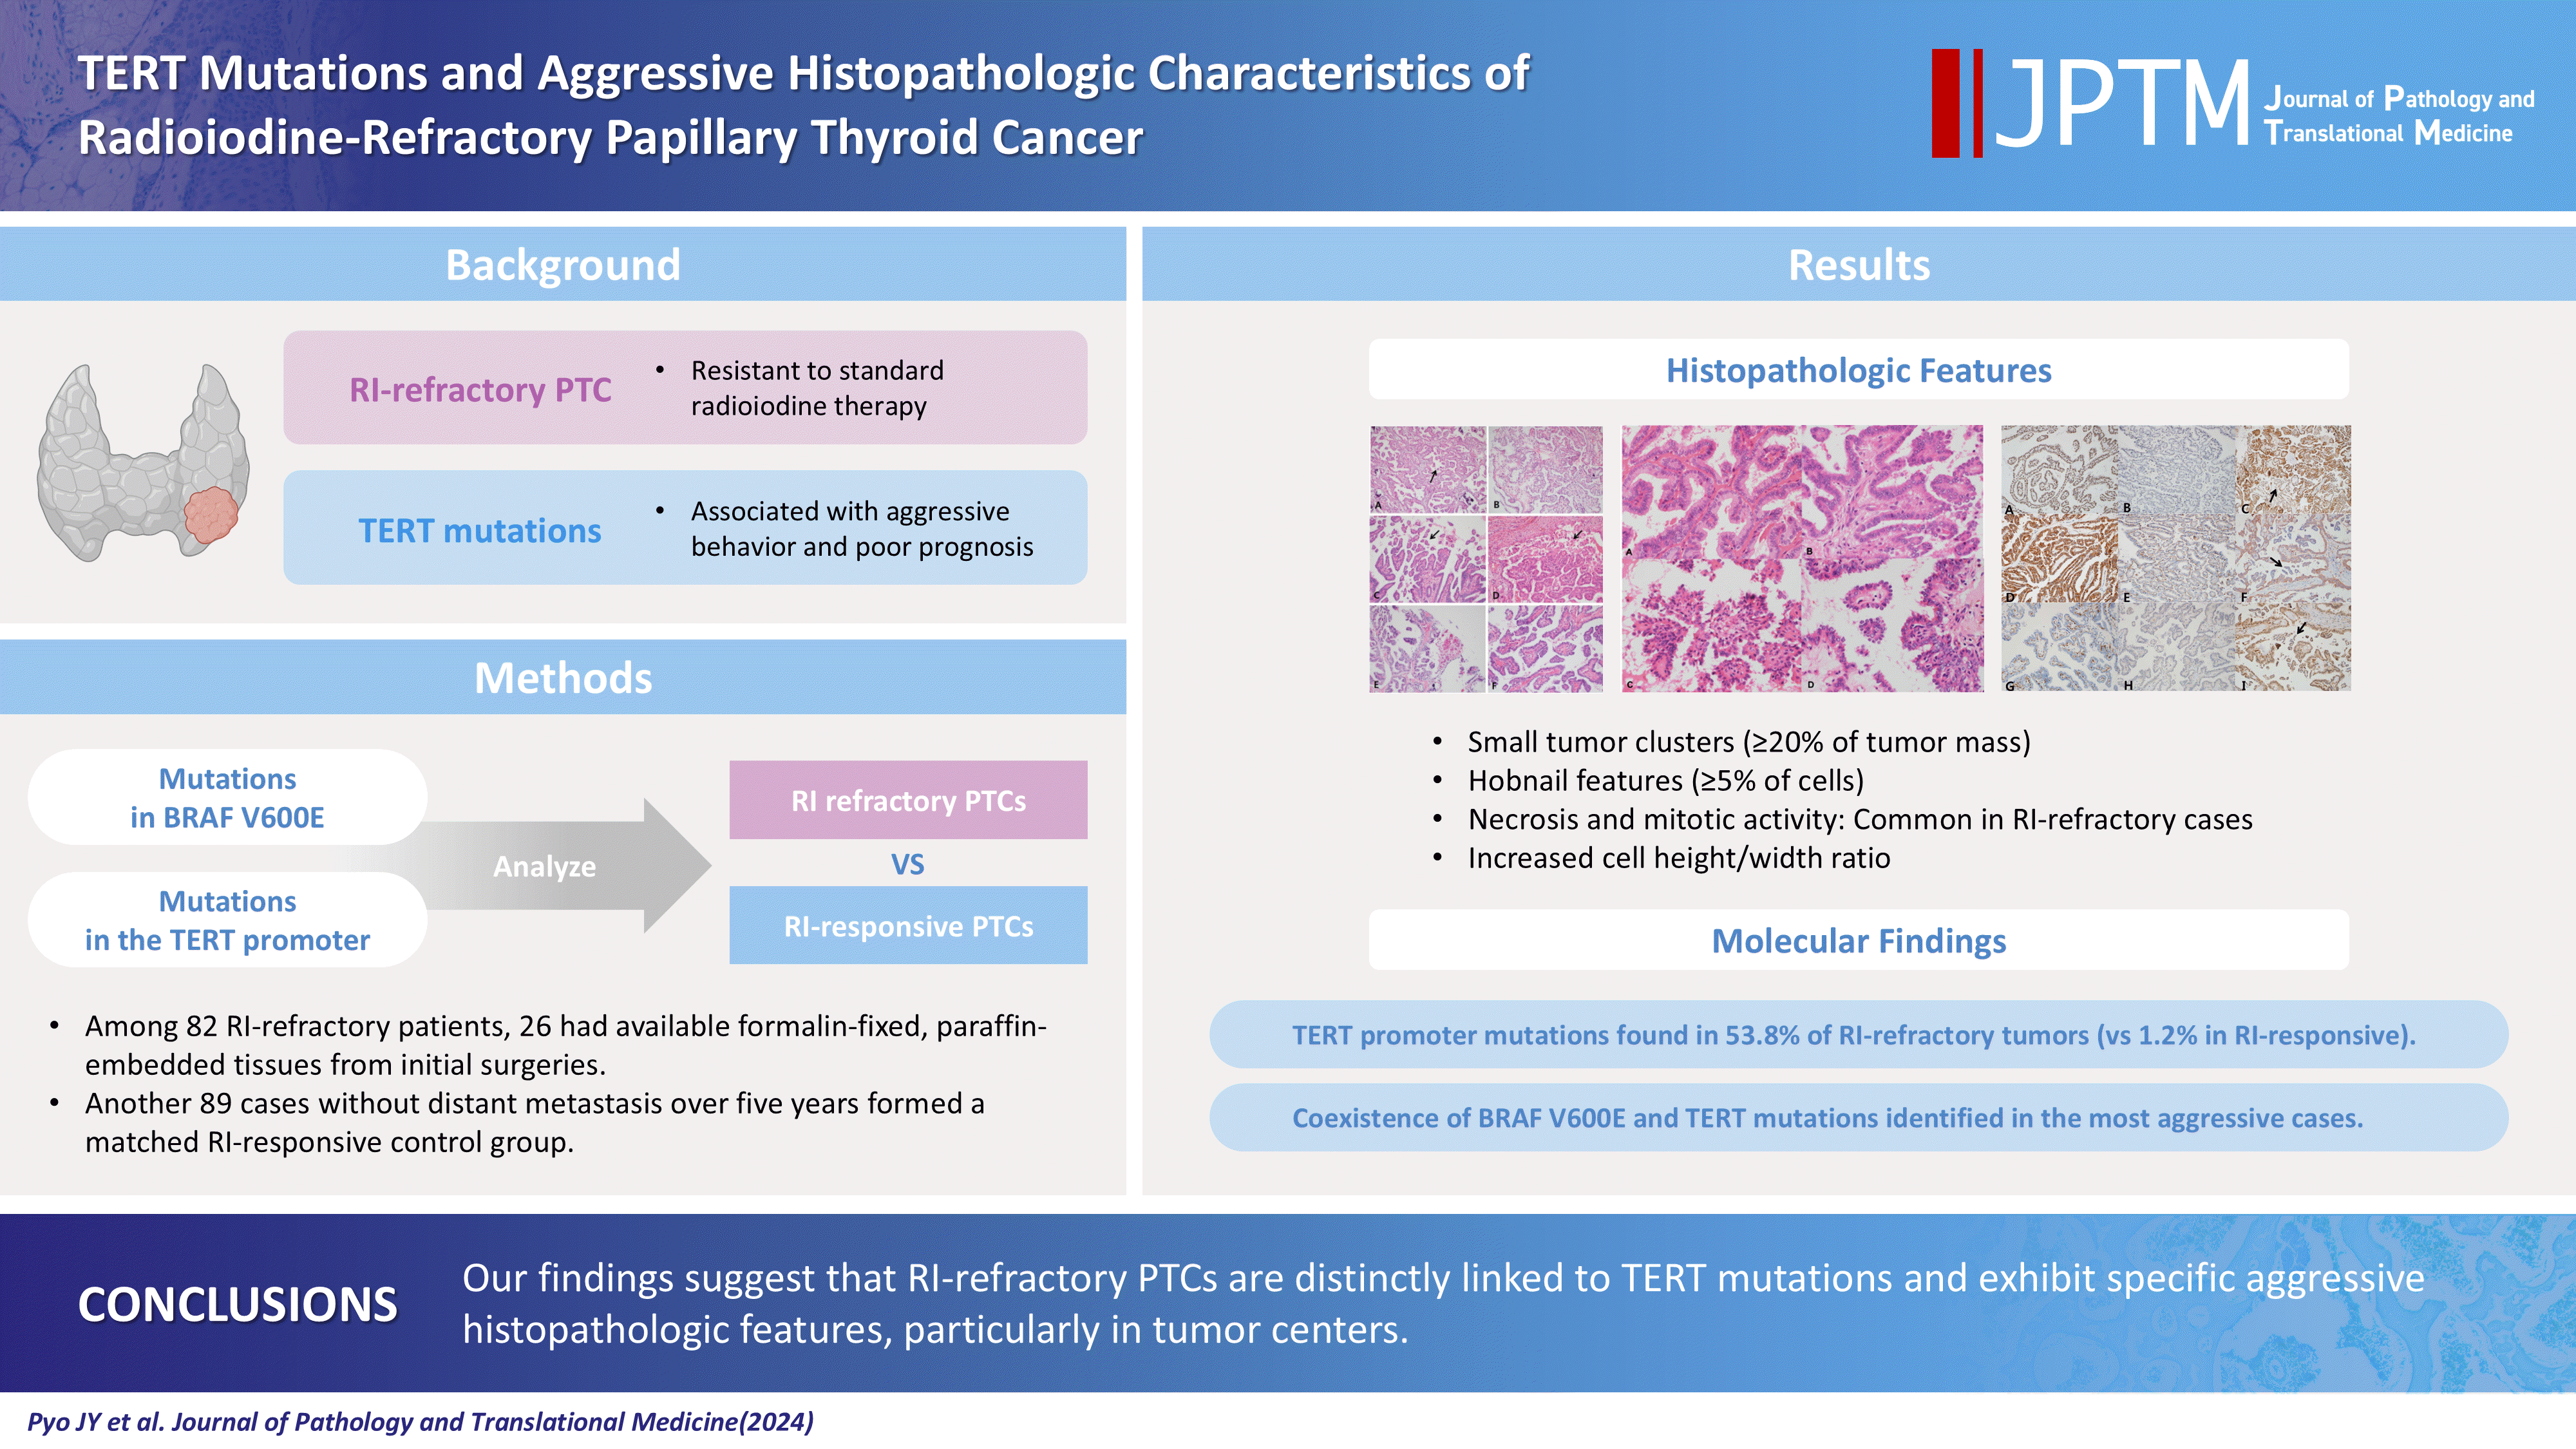
GRAPHICAL ABSTRACT

Papillary thyroid carcinoma (PTC) is the most common type of malignant thyroid neoplasm, with incidence rates increasing significantly in recent years [1,2]. Guidelines for the management of thyroid cancer recommend active surveillance and conservative treatments, such as lobectomy, while standard treatment includes a total or near-total thyroidectomy and adjuvant radioactive iodine (RI) ablation with thyroid-stimulating hormone (TSH) suppression [3].
Thyroid follicular cells use a sodium iodide symporter (NIS) to trap iodine, a process regulated by TSH. Iodine-131 (131I) is effective for therapy and the imaging of differentiated thyroid cancer (DTC), but dedifferentiated, poorly differentiated, and anaplastic thyroid tumors often lose the ability to trap iodine, leading to aggressive behavior and poor prognoses [4]. Classic treatment is generally effective for DTC, which has an excellent prognosis in most cases. However, some patients develop aggressive disease with distant metastases and loss of 131I avidity, leading to poor long-term survival outcomes in patients with RI-resistant DTC [5].
Recent advances in research on molecular pathogenesis have improved our understanding of thyroid cancers and led to the development of effective targeted therapies, particularly tyrosine-kinase inhibitors. This progress stems primarily from the identification of molecular alterations involved in thyroid cancer, including genetic and epigenetic alterations and dysregulation of signaling pathways such as the, phosphoinositide 3-kinase (PI3K)–AKT, and Wnt–β-catenin pathways, as well as gene rearrangements of RET::PTC (RET translocations) and TRK. These mutations are found in more than 70% of PTCs and include BRAF and RAS mutations; RET::PTC (CCDC6::RET, NCOA4::RET, etc.) and PAX8::PPARG gene rearrangements; and alterations in the mitogen-activated protein kinase (MAPK), PI3K, p53, and nuclear factor kappa-light-chain-enhancer of activated B cells (NF-κB) signaling pathways [6].
The BRAF V600E mutation, which results in the expression of mutant BRAF-V600E proteins, is the most common genetic alteration associated with PTC and poor clinicopathologic outcomes, including aggressive pathological features, increased recurrence, and loss of RI avidity. Activation of the PI3K/Akt signaling pathway, often through mutations or deletions of the PTEN tumor suppressor gene, leads to tumorigenesis and is linked with aggressive thyroid tumors. Activation of telomerase, particularly through TERT-promoter mutations, has been increasingly reported in thyroid cancers and is associated with more aggressive tumor behavior and poor outcomes [7,8].
This study focuses on well-known genetic abnormalities and their associated histopathologic features in PTCs. We conducted a comparative analysis of molecular changes and histopathologic differences between RI-responsive and RI-refractory PTCs to identify clinicopathological features linked with the prognosis and treatment outcomes of RI-refractory PTCs.

MATERIALS AND METHODS

Case selection and clinicopathologic review

Samples of formalin-fixed, paraffin-embedded (FFPE) tissues from PTC patients who underwent thyroidectomy and subsequent RI treatment at Gangnam Severance Hospital (Seoul, Korea) between July 2006 and October 2014 were analyzed.
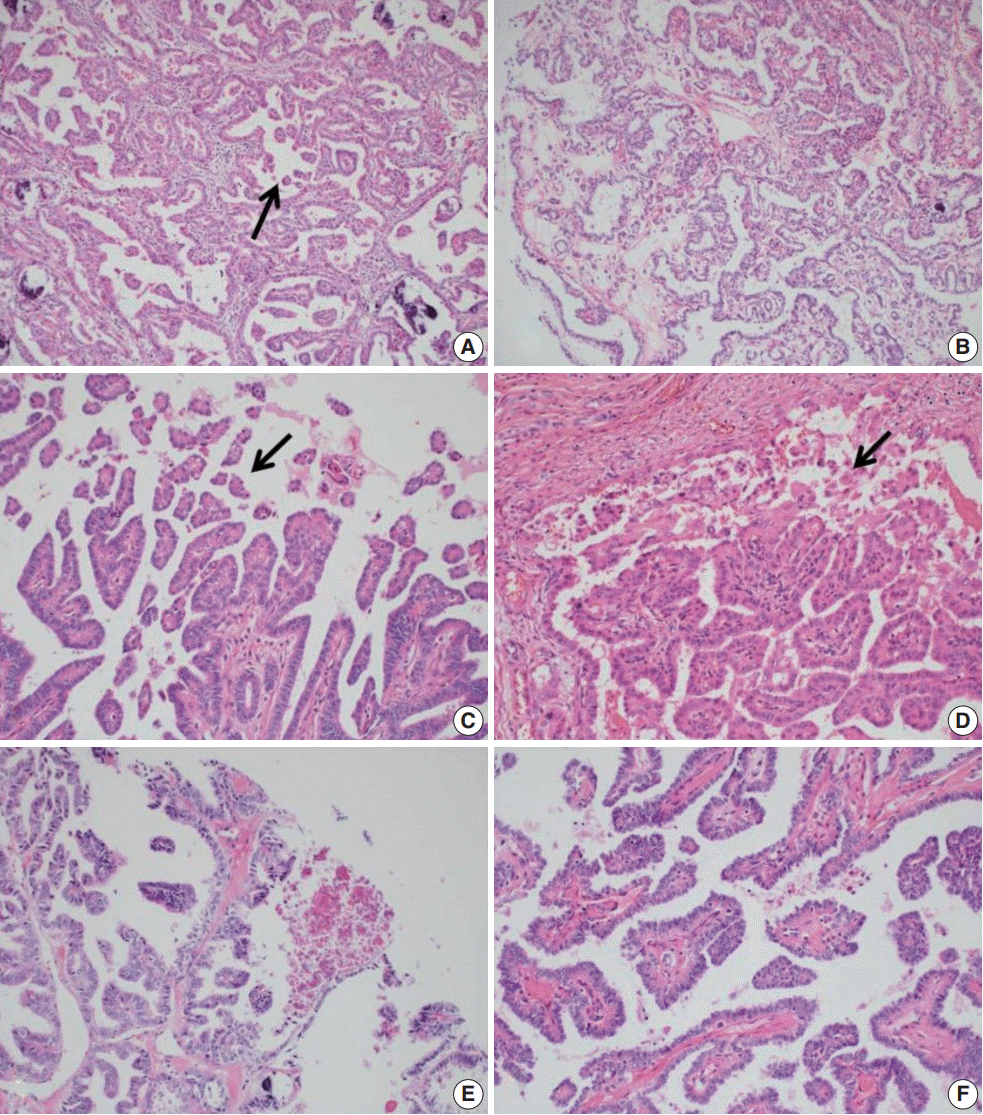
A retrospective review of clinical data was conducted for 15,000 PTC cases. RI-refractory criteria included non-uptake of RI in tumor lesions, radiological progression within 12 months post-radioiodine, or persistent disease following >600 mCi of RI [9]. A total of 82 RI-refractory cases were identified. For comparison, 89 age- and sex-matched RI-responsive cases without distant metastasis over 5 years were selected. Histopathological evaluation followed the World Health Organization Classification of Tumors [10] and PTC was classified and staged according to the American Joint Committee on Cancer’s Cancer Staging Manual, 8th edition [11]. Newly described subtypes of PTC with >30% micropapillary or hobnail features show polarized centrifugal growth and single cells, with the nucleus showing characteristic apical arrangements and protrusion (Fig. 1) [12,13]. The location and proportion of accompanying hobnails or small clusters/micropapillae without fibrovascular cores were further observed.

Molecular studies of BRAF V600E and TERT Mutation

DNA was extracted from sections of FFPE tissue 10 μm thick using a QIAamp DNA FFPE Tissue Kit (Qiagen, Hilden, Germany). Molecular assays included PNA-mediated clamping polymerase chain reaction amplification of mutated BRAF genes (Panagene, Daejeon, Korea) [14] and pyrosequencing for TERT-promoter mutations, using established protocols and updated techniques reflecting recent advances in molecular diagnostics [15,16].

Construction of tissue microarray

For the immunohistochemical (IHC) study, tissue microarray blocks were made using representative, well-fixed tumor samples (two cores, 2 mm in diameter) and normal tissue samples (one core, 2 mm in diameter) from the FFPE blocks.

Immunohistochemistry

All IHC analysis of samples from both PTC groups was performed using FFPE tissue sections 4 μm thick on silane-coated slides. After drying the slides in an oven for 1 hour, immunostaining was performed automatically using a Ventana BenchMark XT Autostainer (Ventana Medical Systems, Tucson, AZ, USA) and an OptiVew DAB IHC Detection Kit (Ventana Medical Systems). The protocol consisted of 48 minutes of antigen retrieval in CC1 (cell conditioning); 10 minutes of endogenous peroxidase blocking in a peroxide block; and 16 minutes of incubation at 42°C with primary antibodies, including NIS (monoclonal mouse, 1:50, Thermo, Waltham, MA, USA), thyroglobulin stimulating hormone receptor (TSHR; 4C1/E1/E8, mouse monoclonal, 1:100, Abcam Inc., Cambridge, MA, USA), vascular endothelial cell growth factor (VEGF; C-1, mouse monoclonal, 1:200, Santa Cruz Biotechnology, Inc., Santa Cruz, CA, USA), vascular endothelial cell growth factor receptor 2 (VEGFR2; 55B11, rabbit monoclonal, 1:200, Cell Signaling Technology, Beverly, MA, USA), NF-κB p65 (F-6, mouse monoclonal, 1:1,000, Santa Cruz Biotechnology, Inc.), β-catenin (β-catenin-1, mouse monoclonal, 1:100, Dako, Carpinteria, CA, USA), and PTEN (6H2.1, mouse monoclonal, 1:100, Biocare Medical, Walnut Creek, CA, USA).

Interpretation of IHC

Nuclear and cytoplasmic staining for NIS and TSHR, cytoplasmic staining for NF-κB, VEGF, and PTEN, cytoplasmic staining of vascular endothelial cells for VEGFR2, and nuclear staining for β-catenin were considered positive and evaluated by light microscopy. The results of IHC staining were defined by intensity and volume. “Volume” was used to measure the proportion of stained cells and “intensity” was classified as 0 (negative), 1+ (weak), 2+ (moderate), or 3+ (strong).
Modified scores for IHC analyses are reported as follows: 0 (no stained cells), 1 (1%–49% of tumor cells were stained with weak intensity), 2 (≥50% of tumor cells were stained with weak intensity), 3 (1%–49% of tumor cells were stained with moderate intensity), 4 (≥50% of tumor cells were stained with moderate intensity), 5 (1%–49% of tumor cells were stained with strong intensity), and 6 (≥50% of tumor cells were stained with strong intensity). Loss of expression of PTEN was scored in reverse order.

Statistical analysis

Statistical analysis of data was performed in IBM SPSS Statistics for Windows ver. 21 (IBM Corp., Armonk, NY, USA). The t and χ2 tests were used to analyze differences between the two groups for each variable. Correlation analysis was performed between variables. Logistic regression was used to assess odds ratios and 95% confidence intervals for radioiodine-refractoriness with multiple variables including clinicopathologic features and results of mutation analysis. All p-values were two-sided and p<.05 was considered statistically significant.

RESULTS

Clinicopathologic characteristics of RI-refractory and RI-responsive PTCs

No significant difference in sex distribution was evident between RI-refractory (50% male) and RI-responsive (45.1% male) groups (p=.664). The median age at diagnosis was higher in the RI-refractory group (58 years) compared with the RI-responsive group (51 years), but this difference was marginally nonsignificant (p=.063). However, significant differences were evident in the pathologic features of the RI-refractory and RI-responsive groups.
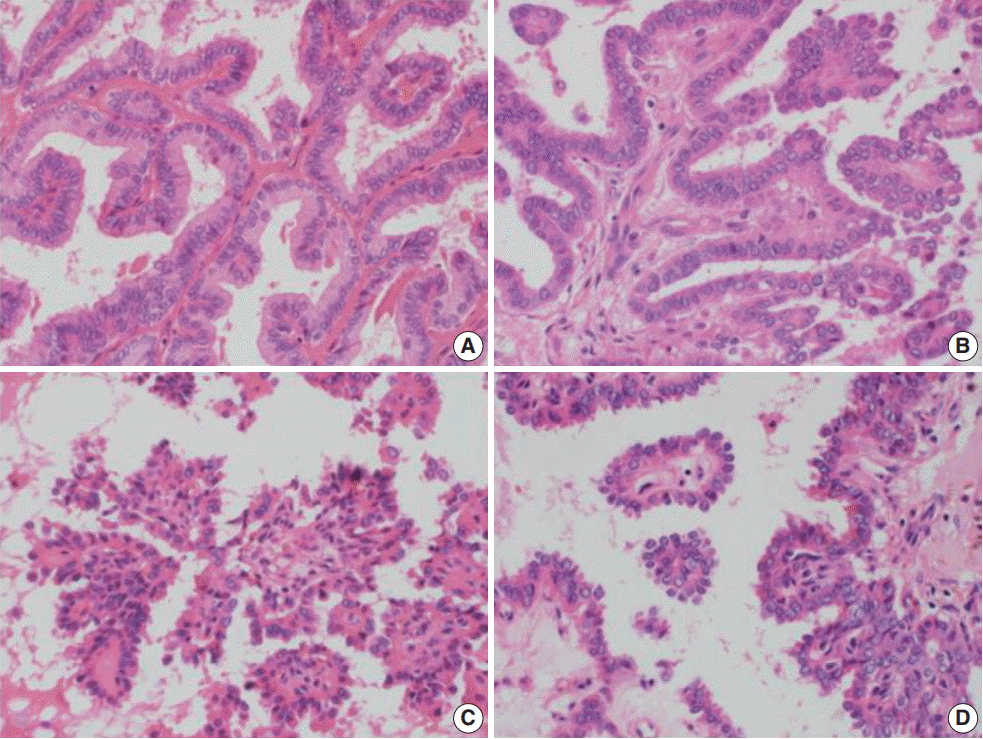
Histologically, RI-refractory PTCs displayed a notably higher proportion of small clusters/micropapillae without fibrovascular cores (Fig. 1A, C) and/or hobnail components across both peripheries and centers of tumors (Fig. 1C), with a maximum height-to-width ratio of tumor cells of ≥3 (Fig. 2A). RI-refractory cancers (65.4%) had a significantly higher presence of small clusters at ≥20% compared with RI-responsive cancers (7.3%) (p<.001). RI-refractory cancers (80.8%) included a hobnail feature ≥ 5% more frequently than did RI-responsive cancers (43.9%) (p=.001). Tall-cell features ≥ 10% were present in 53.8% of RI-refractory cancers compared with only 3.7% in RI-responsive cancers (p<.001) (Table 1). Tumor necrosis and mitosis, which are typically rare in differentiated papillary carcinoma, were observed in RI-refractory PTCs (Fig. 1E). Necrosis was observed in 61.5% of RI-refractory cancers and only 1.2% of RI-responsive cancers (p<.001). Similarly, a higher percentage of RI-refractory tumors (46.2%) exhibited mitotic activity (≥1 per 10 high-power field [HPF]) compared to RI-responsive tumors (2.4%) (p<.001). However, cases with high mitotic activity (≥5 per 10 HPF) were observed in only one instance among RI-refractory tumors, with none seen in RI-responsive tumors, producing no significant difference between the two groups. These results align with the criteria outlined in the 2022 World Health Organization (WHO) classification [17] for high-grade differentiated thyroid carcinomas, particularly regarding the presence of necrosis (Table 1).
The positioning of tumor cell nuclei in RI-refractory PTCs was predominantly middle to base (Fig. 2A), in contrast to apex to middle in RI-responsive PTCs (Fig. 2B). RI-responsive PTCs included sporadic areas with hobnails or small clusters/micropapillae without fibrovascular cores at tumor peripheries; these cells were generally cuboidal to columnar in shape, with nuclei located from the middle to apical section (Figs. 1B, D, 2C, D). Tumors larger than 4 cm were more frequent in RI-refractory cancers (26.9%) than in RI-responsive cancers (2.4%) (p<.001) (Table 1).
RI-refractory PTCs exhibited a significantly higher frequency of extrathyroidal extension and involvement of the resection margin with lymph node metastasis at initial diagnosis. RI-refractory cancers (92.3%) were more likely to have lymph node metastasis compared with RI-responsive cancers (72%) (p=.032) (Table 1).

BRAF V600E and TERT mutation results

Individual incidence of molecular variables in each group

The TERT-promoter mutation was significantly more prevalent in RI-refractory PTCs, appearing in 14 out of 26 cases (53.8%, including 13 TERT C228T and 1 TERT C250T) compared with only one of 82 RI-responsive cases (1.2%, TERT C228T) (p<.001). The BRAF V600E mutation was detected in more than 80% of cases in both groups (21 of 26 [80.8%] in the RI-refractory group and 67 of 82 [81.7%] in the RI-responsive group) (Table 2).

Combined incidence of molecular variables in each group

TERT-promoter and BRAF mutations coexisted in 13 of 108 PTC cases (12.0%), either RI-refractory or RI-responsive. Only 1 RI-responsive case showed coexistence of these mutations; in 18 cases, no mutation was identified (Table 3).

Relationship between clinicopathologic features and molecular variables

A significant correlation was seen between TERT-promoter mutations and clinicopathologic features, such as small clusters/micropapillae without fibrovascular cores, hobnail components, height-to-width ratios of tumor cells, necrosis, mitosis, and involvement of the resection margin. The median age at diagnosis was significantly higher among patients with TERT-promoter mutations (62 years; range, 16 to 71) compared with those without such mutations (52 years; range, 16 to 71; p=.007). However, there was no significant difference in age by BRAF V600E mutation status (p=.519). Histologically, tumors with TERT-promoter mutations are more likely to exhibit small clusters comprising ≥20% of the tumor (73.3%) compared with tumors without these mutations (26.7%, p<.001). Conversely, BRAF V600E mutations showed no significant association with small clusters (p>.99). The presence of a hobnail feature (≥5% of the tumor exhibiting this feature) was significantly associated with TERT-promoter mutations (86.7%) compared with absence of this feature (13.3%, p=.005). However, there was no significant association between BRAF V600E mutations and hobnail features (p=.825). Necrosis within the tumors was significantly more frequent in cases with TERT-promoter mutations (60.0%) compared with those without a mutation (40.0%, p<.001). BRAF V600E mutations did not show a significant association with necrosis (p>.99).
Regarding tumor size, TERT-promoter mutations were significantly associated with larger tumor sizes (≥2 cm to ≤4 cm: 33.3%; >4 cm: 40.0%) compared with tumors without these mutations (≤2 cm: 26.7%, p<.001). Similarly, BRAF V600E mutations were more prevalent in tumors >2 cm to ≤ 4 cm (22.7%) compared with tumors ≤2 cm (72.7%, p=.024). Finally, regarding resection margins, TERT promoter mutations were observed more frequently in cases with positive resection margins (33.3%) compared with those with negative margins (66.7%, p=.007). There was no significant association between BRAF V600E mutations and resection margins (p>.99) (Table 4).

IHC stain results

Individual IHC stain results in each group

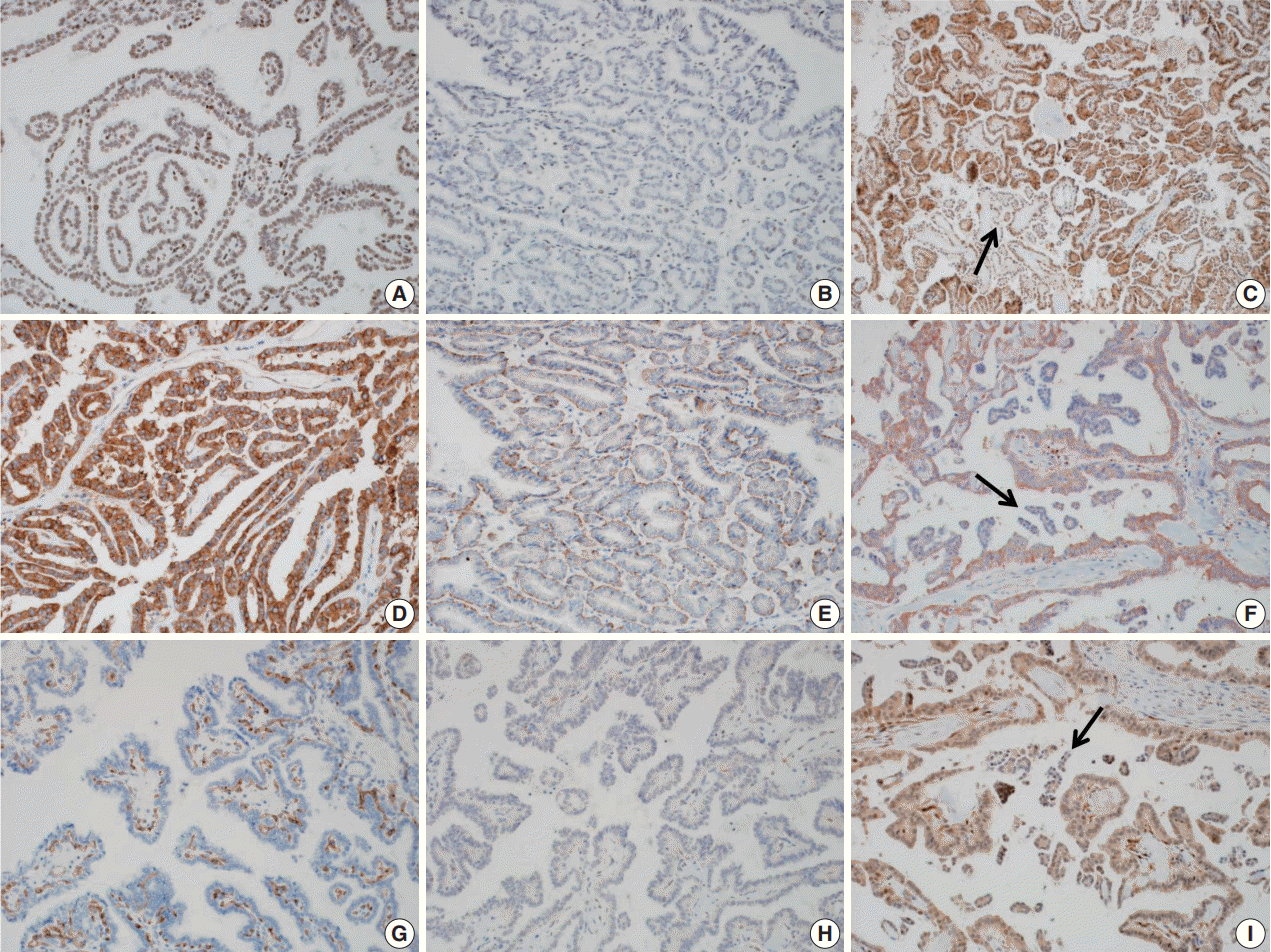
Expression of NIS and TSHR, which are involved in the MAPK pathway, were markedly decreased in many RI-refractory PTC cases (p<.05). Expression of oncogenic proteins such as VEGF, VEGFR2, and NF-κB, which are known to be up-regulated in PTC, was significantly lower in RI-refractory PTCs than in RI-responsive PTCs (p<.05). A total loss of PTEN expression was occasionally noted in both groups (26.9% in RI-refractory and 15.9% in RI-responsive) (Fig. 3). β-catenin showed cytoplasmic-positive reactivity in all examined PTCs (Table 5).

Relationship between IHC results and molecular variables

A comparative analysis found no significant correlation between IHC results and TERT and BRAF mutation status, except for TSHR (p=.030, associated with TERT mutation) across all PTCs (Table 6).

Relationship between clinicopathologic features and IHC results

Negative correlations were observed between NIS and small clusters (r=–0.212, p=.027), NIS and hobnail features (r=–0.249, p=.009), and between TSHR and the height/width of tumor cells (r=–0.279, p=.003). Positive intercorrelations included VEGF and NF-κB (r=0.252, p=.009), among others. Significant associations between histologic features and IHC results were observed in both RI-refractory and RI-responsive groups.

Combined utility of variables for predicting RI-refractoriness

The sensitivity and specificity associated with predicting RI-refractory PTC were calculated before conducting logistic regression analysis. Among the 16 variables tested, the presence of necrosis and a TERT mutation showed high specificity (99%) and high accuracy (89.8% and 88%, respectively). Variables such as small clusters/micropapillae without fibrovascular cores (≥10%), and hobnail features had high sensitivity (88%, 81%, and 81%, respectively). When combined with other variables, and necrosis in particular, both sensitivity and specificity were enhanced. Other sets of variables, including the presence of a TERT mutation or mitosis, were also analyzed but showed no significant associations (Table 7). The logistic regression analysis incorporated 14 variables, identifying four key predictors of RI-refractoriness: TERT mutation, height-to-width ratio of tumor cells ≥3, increased small clusters/micropapillae without fibrovascular cores (≥20%), and necrosis (Table 8).

DISCUSSION

An increased frequency of small clusters/micropapillae without fibrovascular cores or hobnail features in tumors, and their presence in tumor centers in particular, were significant predictors of RI-refractoriness in PTCs. The prognosis for PTCs is generally favorable; however, subtypes such as the tall cell, columnar, diffuse sclerosing, and solid subtypes are associated with more aggressive clinical features [18]. A newly described subtype of PTC exhibiting >30% micropapillary or hobnail features is capable of discohesive growth and single cells with a loss of polarity, where nuclei show characteristic apical placement and bulging [12,13]. This rare hobnail subtype is associated with a higher mortality rate compared with classic PTC and is linked with frequent lymph node metastasis, recurrence, and distant metastasis. A recent study reported that, even when the proportion of hobnail or small clusters/micropapillae without fibrovascular cores is below 30% of PTC, there is a significant association with poor prognosis. In this study, the frequency of hobnails or small clusters/micropapillae without fibrovascular cores was significantly higher in RI-refractory PTC than in RI-responsive PTCs [12].
An increased maximum height-to-width ratio in tumor cells (≥3) in non–tall cell subtype PTC was predictive of RI-refractoriness. The tall-cell subtype of PTC also shows aggressive behavior, similar to the hobnail subtype. Histologically, ≥50% of tumor cells show a granular eosinophilic cytoplasm, with a height at least triple their width. However, recent case studies have suggested a ≥10% cutoff threshold for tall-cell quantity is strongly associated with worse clinical outcomes. This study showed that a higher (≥3) maximum height-to-width ratio of tumor cells in the non–tall cell subtype of PTCs was significantly associated with RI-refractory PTC and could predict RI-refractoriness. These data support its use as a prognostic factor of aggression in PTC. TERT-promoter mutations in the tall-cell subtype have recently been found to be a strong predictor of tumor relapse [7,8,16].
Because this study used the 2017 WHO classification criteria [10] and was conducted prior to the 2022 update that introduced the concept of high-grade differentiated thyroid carcinomas, it did not formally assess these criteria. However, given the histologic findings reviewed in this study, we recorded significant correlations with key diagnostic features highlighted in the 2022 WHO classification for high-grade differentiated thyroid carcinomas, particularly the presence of necrosis [17]. Cases frequently demonstrating necrosis were notably associated with RI-refractoriness, suggesting that necrosis may serve as a critical diagnostic criterion for aggressiveness within the diagnostic framework of high-grade differentiated thyroid carcinoma as defined by the 2022 criteria. This underscores the potential of necrosis to influence and predict RI-refractoriness.
Immunohistochemically, the decreased expression of NIS and TSHR observed in this study suggests that impairment of the iodide-handling machinery may be associated with RI-refractoriness.
Transportation of iodide through the NIS is up-regulated by TSH-mediated activation of TSHR [19]. In previous studies, NIS proteins were found to be expressed in the cytoplasm rather than the cytoplasmic membrane of cancer cells [20], and the intracellular expression of NIS proteins be related to its inactivation, due to intracellular migration [21]. In this study, the NIS protein was expressed primarily in the intranuclear portion of tumor cells, but it was also strongly expressed in the intracellular or basolateral membrane in normal follicular cells. No staining was observed in the lung or liver tissue used as negative controls. According to a recent study of expression of NIS in different PTC subtypes, strong intranuclear or nuclear membrane staining for NIS protein was observed in conventional PTCs, and staining for the NIS protein was negative (0 and 1+) in the tall cell and diffuse sclerosing subtypes of PTC, which are considered aggressive subtypes of PTC [22]. In advanced thyroid cancers, failure of RI treatment may be associated with impairment of the iodide-handling machinery [5]. Similarly, the observed decrease in expression of NIS and TSHR in RI-refractory PTC suggests that impairment of the iodide-handling machinery may be associated with RI-refractoriness.
The aggressive behavior of TERT-mutated tumors may be associated with the alteration of function of NIS and other genes, which leads to decreased RI avidity and failure of RI treatment. According to our results, impairment of NIS expression was correlated with TERT-promoter mutations, but not with the BRAF V600E mutation. Concordant with our results, TERT-promoter mutations were an independent predictor of distant metastases and disease progression in DTC [23]. Impairment of the iodidehandling machinery may be associated with aberrant activation of the MAPK signaling pathway, particularly in mutations of BRAF V600E, which were found to be associated with RI-refractoriness in previous studies [24-27]. Although expression of NIS proteins was not correlated with a BRAF V600E mutation in this study, overall observation of whole tumor sections may be required to observe this association, because of the heterogeneous expression of NIS in PTC and metastatic lymph nodes [25]. Impairment of the iodide-handling machinery may also be associated with activation of the PI3K-AKT signaling pathway in human thyroid cancer cells [28]. Although PTEN loss did not differ significantly between RI-refractory and RI-responsive PTC, further study of a large number of cases, with overall observations of whole tumor sections and evaluations of phosphorylated Akt expression may be required to determine this association. The Wnt–β-catenin pathway plays a well-understood role in the regulation of cell growth and proliferation. Up-regulated β-catenin is translocated into the nucleus, where it triggers transcription of various tumor-promoting genes. Up-regulation of β-catenin has been found in 66% of anaplastic thyroid cancers and 25% of poorly differentiated cancers. The Wnt–β-catenin pathway plays an important role in determining the aggressiveness of thyroid tumors [29]. However, expression of β-catenin was restricted to the cytoplasm in all cases of PTC in this study. This is consistent with the finding that activation of the Wnt–β-catenin pathway is not observed in DTCs and is not associated with aggressiveness. Experimental and clinical studies of the relationship between VEGF in endothelial cells and TERT mutations have shown that vascular degeneration is associated with down-regulation of TERT mRNA expression. Most studies reported that TERT plays an important role in VEGF-mediated angiogenesis, and TERT may act as a VEGF transcription factor [30]. However, we found no significant association between TERT-promoter mutations and expression of VEGF and VEGFR2. Although no significant associations were observed, the expression of VEGF in tumor cells was remarkably negative within the small clusters/micropapillae without fibrovascular cores and faint in the hobnail components. These results may help explain the relationship between low expression of NIS and TSHR and the increased proportion of hobnails or small clusters/micropapillae without fibrovascular cores or hobnail components in RI-refractory PTC. Among up-regulated oncogenic proteins, NF-κB plays an important role in controlling proliferation and anti-apoptotic signaling pathways in thyroid cancer cells [6,31]. In recent studies, NF-κB was shown to play a major role in cell survival via synergic cross-talk with other oncogenic signaling pathways. Up-regulation of NF-κB is associated with BRAF V600E mutations [31]. Although expression of NF-κB was variably positive in both RI-refractory and RI-responsive PTCs, it was significantly lower in RI-refractory PTC than in RI-responsive PTC, in this study. Coexistence of the BRAF V600E and TERT C228T mutations was identified in the most aggressive subgroup of PTC; the combination was more significantly associated with the aggressive subgroup than was either mutation alone [8]. Our results also indicated that coexistence of the BRAF V600E and TERT mutations is significantly prevalent in RI-refractory PTC.
The following histopathologic features are characteristic of RI-refractory PTC: small tumor clusters or hobnail features in both the center and periphery of tumors, as well as tumor necrosis and increased frequency of TERT mutations. These features may help predict RI-refractoriness upon diagnosis of PTC. Although it is difficult to formalize the results of multivariate logistic regression, our results suggest that these characteristic histologic features and TERT mutations may play a critical role in diagnostic differentiation of PTCs and prediction of RI-refractoriness.

Notes

Ethics Statement

This study was conducted with the approval of the Gangnam Severance Hospital Institutional Review Board (IRB), approval number 3-2022-0082. Formal written informed consent was not required due to a waiver from the appropriate IRB and/or national research ethics committee.

Availability of Data and Material

The datasets generated or analyzed during the study are available from the corresponding author on reasonable request.

Code Availability

Not applicable.

Author Contributions

Conceptualization: SWH, JYP. Participation of consensus meeting: all authors. Supervision: SWH, JYP. Resources: JYP, YJC. Writing—original draft preparation: JYP. Writing—review & editing: all authors. Approval of final manuscript: all authors.

Conflicts of Interest

S.W.H., a contributing editor of the Journal of Pathology and Translational Medicine, was not involved in the editorial evaluation or decision to publish this article. All remaining authors have declared no conflicts of interest.

Funding Statement

No funding to declare.

References

1. Kang MJ, Jung KW, Bang SH, et al. Cancer statistics in Korea: incidence, mortality, survival, and prevalence in 2020. Cancer Res Treat. 2023; 55:385–99.
crossref
2. Kitahara CM, Sosa JA. The changing incidence of thyroid cancer. Nat Rev Endocrinol. 2016; 12:646–53.
crossref
3. Haugen BR. 2015 American Thyroid Association management guidelines for adult patients with thyroid nodules and differentiated thyroid cancer: what is new and what has changed? Cancer. 2017; 123:372–81.
crossref
4. Mian C, Barollo S, Pennelli G, et al. Molecular characteristics in papillary thyroid cancers (PTCs) with no 131I uptake. Clin Endocrinol (Oxf). 2008; 68:108–16.
crossref
5. Durante C, Haddy N, Baudin E, et al. Long-term outcome of 444 patients with distant metastases from papillary and follicular thyroid carcinoma: benefits and limits of radioiodine therapy. J Clin Endocrinol Metab. 2006; 91:2892–9.
crossref
6. Xing M. Molecular pathogenesis and mechanisms of thyroid cancer. Nat Rev Cancer. 2013; 13:184–99.
crossref
7. Liu X, Qu S, Liu R, et al. TERT promoter mutations and their association with BRAF V600E mutation and aggressive clinicopathological characteristics of thyroid cancer. J Clin Endocrinol Metab. 2014; 99:E1130–6.
8. Xing M, Liu R, Liu X, et al. BRAF V600E and TERT promoter mutations cooperatively identify the most aggressive papillary thyroid cancer with highest recurrence. J Clin Oncol. 2014; 32:2718–26.
9. Wong KP, Lang BH. New molecular targeted therapy and redifferentiation therapy for radioiodine-refractory advanced papillary thyroid carcinoma: literature review. J Thyroid Res. 2012; 2012:818204.
crossref
10. Lloyd RV, Osamura RY, Kloppel G, Rosai J. WHO classification of tumours of endocrine organs. 4th ed. Lyon: International Agency for Research on Cancer;2017. p. 65–143.
11. Amin MB; American Joint Committee on Cancer; American Cancer Society. AJCC cancer staging manual. 8th ed. New York: Springer;2017. p. 873–90.
12. Amacher AM, Goyal B, Lewis JS Jr, El-Mofty SK, Chernock RD. Prevalence of a hobnail pattern in papillary, poorly differentiated, and anaplastic thyroid carcinoma: a possible manifestation of high-grade transformation. Am J Surg Pathol. 2015; 39:260–5.
13. Asioli S, Erickson LA, Righi A, Lloyd RV. Papillary thyroid carcinoma with hobnail features: histopathologic criteria to predict aggressive behavior. Hum Pathol. 2013; 44:320–8.
crossref
14. Kim YH, Choi SE, Yoon SO, Hong SW. A testing algorithm for detection of the B-type Raf kinase V600E mutation in papillary thyroid carcinoma. Hum Pathol. 2014; 45:1483–8.
crossref
15. Kimura ET, Nikiforova MN, Zhu Z, Knauf JA, Nikiforov YE, Fagin JA. High prevalence of BRAF mutations in thyroid cancer: genetic evidence for constitutive activation of the RET/PTC-RAS-BRAF signaling pathway in papillary thyroid carcinoma. Cancer Res. 2003; 63:1454–7.
16. Liu R, Li Y, Chen W, et al. Mutations of the TERT promoter are associated with aggressiveness and recurrence/distant metastasis of papillary thyroid carcinoma. Oncol Lett. 2020; 20:50.
17. Baloch ZW, Asa SL, Barletta JA, et al. Overview of the 2022 WHO classification of thyroid neoplasms. Endocr Pathol. 2022; 33:27–63.
crossref
18. Asioli S, Erickson LA, Sebo TJ, et al. Papillary thyroid carcinoma with prominent hobnail features: a new aggressive variant of moderately differentiated papillary carcinoma: a clinicopathologic, immunohistochemical, and molecular study of eight cases. Am J Surg Pathol. 2010; 34:44–52.
crossref
19. Ricarte-Filho JC, Ryder M, Chitale DA, et al. Mutational profile of advanced primary and metastatic radioactive iodine-refractory thyroid cancers reveals distinct pathogenetic roles for BRAF, PIK3CA, and AKT1. Cancer Res. 2009; 69:4885–93.
20. Hartwig FP, Nedel F, Collares TV, Tarquinio SB, Nor JE, Demarco FF. Telomeres and tissue engineering: the potential roles of TERT in VEGF-mediated angiogenesis. Stem Cell Rev Rep. 2012; 8:1275–81.
crossref
21. Sodre AK, Rubio IG, Galrao AL, et al. Association of low sodium-iodide symporter messenger ribonucleic acid expression in malignant thyroid nodules with increased intracellular protein staining. J Clin Endocrinol Metab. 2008; 93:4141–5.
crossref
22. Wei S, Gao M, Zhao C, et al. Low expression of sodium iodide symporter expression in aggressive variants of papillary thyroid carcinoma. Int J Clin Oncol. 2014; 19:800–4.
crossref
23. Vinagre J, Pinto V, Celestino R, et al. Telomerase promoter mutations in cancer: an emerging molecular biomarker? Virchows Arch. 2014; 465:119–33.
crossref
24. Xing M. BRAF mutation in papillary thyroid cancer: pathogenic role, molecular bases, and clinical implications. Endocr Rev. 2007; 28:742–62.
crossref
25. So YK, Son YI, Baek CH, Jeong HS, Chung MK, Ko YH. Expression of sodium-iodide symporter and TSH receptor in subclinical metastatic lymph nodes of papillary thyroid microcarcinoma. Ann Surg Oncol. 2012; 19:990–5.
crossref
26. Durante C, Puxeddu E, Ferretti E, et al. BRAF mutations in papillary thyroid carcinomas inhibit genes involved in iodine metabolism. J Clin Endocrinol Metab. 2007; 92:2840–3.
27. Liu D, Hu S, Hou P, Jiang D, Condouris S, Xing M. Suppression of BRAF/MEK/MAP kinase pathway restores expression of iodide-metabolizing genes in thyroid cells expressing the V600E BRAF mutant. Clin Cancer Res. 2007; 13:1341–9.
28. Kogai T, Sajid-Crockett S, Newmarch LS, Liu YY, Brent GA. Phosphoinositide-3-kinase inhibition induces sodium/iodide symporter expression in rat thyroid cells and human papillary thyroid cancer cells. J Endocrinol. 2008; 199:243–52.
crossref
29. Miyake N, Maeta H, Horie S, et al. Absence of mutations in the beta-catenin and adenomatous polyposis coli genes in papillary and follicular thyroid carcinomas. Pathol Int. 2001; 51:680–5.
30. Oh WJ, Lee YS, Cho U, et al. Classic papillary thyroid carcinoma with tall cell features and tall cell variant have similar clinicopathologic features. Korean J Pathol. 2014; 48:201–8.
crossref
31. Li X, Abdel-Mageed AB, Mondal D, Kandil E. The nuclear factor kappa-B signaling pathway as a therapeutic target against thyroid cancers. Thyroid. 2013; 23:209–18.
crossref

Fig. 1.
Representative histologic features of radioiodine-refractory papillary thyroid cancers (A, C, E) and radioiodine-responsive papillary thyroid cancers (B, D, F). Both types of tumors show classic papillary architecture with varying degrees of small clusters/micropapillae without f ibrovascular cores (arrows) or discohesive single cells. Tumor necrosis is comparatively rare, but remarkably increased in the radioiodine-refractory group rather than the radioiodine-responsive group (E).
jptm-2024-07-29f1.tif
Fig. 2.
Histologic features of classic papillary pattern and the hobnail pattern of papillary thyroid cancers (A–D). In some radioiodine-refractory cases, tumor cells have a longer and more slender papillary structure, with an increased height-to-width ratio (≥ 3) and base-to-middle location of nuclei (A) or a hobnail pattern, with elongated nuclei within the cell apex (C, D). Examination of tumor cells of radioiodine-responsive cases reveal that most are cuboidal or columnar in appearance, and nuclei were in the middle to apex of the cell (B).
jptm-2024-07-29f2.tif
Fig. 3.
Individual immunohistochemical stain results in each group. The radioiodine (RI)-responsive papillary thyroid cancer (PTC) group shows increased expression of sodium iodide symporter (NIS) (A), nuclear factor kappa-light-chain-enhancer of activated B cells (NF-κB) (D), and vascular endothelial cell growth factor receptor 2 (G). An RI-refractory PTC group shows markedly decreased expression of NIS (B), NF-κB (E). Tumor cells of both groups show variable expression of thyroglobulin stimulating hormone receptor (C), vascular endothelial cell growth factor (F) and PTEN (H, I) with weak expression in small clusters/micropapillae without fibrovascular cores (arrow in C, F, I).
jptm-2024-07-29f3.tif
jptm-2024-07-29f4.tif
Table 1.
Clinicopathologic features of RI-refractory and RI-responsive PTCs
Feature RI-refractory (n = 26) RI-responsive (n = 82) p-value
Male sex 13 (50.0) 37 (45.1) .664
Age at diagnosis (yr) 58 (16–71) 51 (18–71) .063a
Small clustersb ≥ 20% 17 (65.4) 6 (7.3) < .001
Hobnail feature ≥ 5% 21 (80.8) 36 (43.9) .001c
Tall cell featured ≥ 10% 14 (53.8) 3 (3.7) < .001c
Necrosis present 16 (61.5) 1 (1.2) < .001c
Mitosis ≥ 1/10HPF 12 (46.2) 2 (2.4) < .001c
Mitosis ≥ 5/10HPF 1 (3.8) 0
High-grade differentiated thyroid carcinomas (WHO 2022) 16 (61.5) 1 (1.2) < .001c
Tumor size > 4 cm 7 (26.9) 2 (2.4) < .001
Lymph node metastasis 24 (92.3) 59 (72.0) .032
Stage IV 3 (11.5) 0

Values are presented as number (%) or median (range).

RI, radioiodine; PTC, papillary thyroid cancer; HPF, high-power field; WHO, World Health Organization.

a Mann-Whitney test;

b Small clusters composed of micropapillae without fibrovascular cores;

c Fisher’s exact test;

d The tumor cells show a granular eosinophilic cytoplasm with a height is at least triple their width (< 50% of tumor).

Table 2.
Incidences of TERT-promoter mutations and BRAF V600E mutations in RI-refractory and RI-responsive PTCs
Mutation RI-refractory PTC (n = 26) RI-responsive PTC (n = 82) Total (n = 108) p-valuea
TERT promoter 14 (53.8) 1 (1.2) 15 (13.9) < .001
BRAF V600E 21 (80.8) 67 (81.7) 88 (81.5) > .99

Values are presented as number (%).

TERT, telomerase reverse transcriptase; RI, radioiodine; PTC, papillary thyroid cancer.

a Fisher’s exact test.

Table 3.
Combined incidence of TERT-promoter mutations and BRAF V600E mutations
Mutation status RI-refractory PTC (n = 26) RI-responsive PTC (n = 82) p-valuea
TERT and BRAF mutant 12 (46.2) 1 (1.2) < .001
TERT only mutant 2 (7.7) 0 .048
BRAF only mutant 9 (34.6) 66 (80.5) < .001
TERT and BRAF wild 3 (11.5) 15 (18.3) .022

Values are presented as number (%).

RI, radioiodine; PTC, papillary thyroid cancer.

a Fisher’s exact test.

Table 4.
Relationship between clinicopathologic features and TERT-promoter mutation or BRAF V600E mutation in PTCs
Total PTC (n = 108) TERT
BRAF V600E
Mutant (n = 15) p-value Mutant (n = 88) p-value
Age at diagnosis (yr) 62 (16–71) .007a 52 (16–71) .519a
Histologic features
 Small clusters (%)b
  < 20 4 (26.7) < .001c 69 (78.4) > .99c
  ≥ 20 11 (73.3) 19 (21.6)
 Hobnail feature (%)
  < 5 2 (13.3) .005 42 (47.7) .825
  ≥ 5 13 (86.7) 46 (52.3)
 Necrosis
  Absent 6 (40.0) < .001c 74 (84.1) > .99c
  Present 9 (60.0) 14 (15.9)
 Tumor size (cm)
  ≤ 2 4 (26.7) < .001c 64 (72.7) .024c
  > 2, ≤ 4 5 (33.3) 20 (22.7)
  > 4 6 (40.0) 4 (4.5)
 Resection margin
  Absent 10 (66.7) .007c 79 (89.8) > .99c
  Positive 5 (33.3) 9 (10.2)

Values are presented as median (range) or number (%).

TERT, telomerase reverse transcriptase; PTC, papillary thyroid cancer.

a Mann-Whitney test;

b Small tumor clusters composed of micropapillae without fibrovascular cores;

c Fisher’s exact test.

Table 5.
Individual immunohistochemical stain results in RI-refractory and RI-responsive PTCs
Immunohistochemistry (n = 108) RI-refractory PTC (n = 26) RI-responsive PTC (n = 82) p-value
NIS ≥ 1+, 50% 14 (53.8) 61 (74.4) .048
TSHR ≥ 2+ 9 (34.6) 61 (74.4) < .001
VEGF ≥ 3+, 50% 9 (34.6) 50 (61) .019
VEGFR2 ≥ 2+ 15 (57.7) 66 (80.5) .019
NF-κB ≥ 1+, 50% 17 (65.4) 71 (86.6) .022a
PTEN negative 7 (26.9) 13 (15.9) .248a

RI, radioiodine; PTC, papillary thyroid cancer; NIS, sodium iodide symporter; TSHR, thyroglobulin stimulating hormone receptor; VEGF, vascular endothelial cell growth factor; VEGFR2, vascular endothelial cell growth factor receptor 2; NF-κB, nuclear factor kappa-light-chain-enhancer of activated B cells.

a Fisher’s exact test; chi-squared test: not annotated; intensity of immunohistochemical staining: 0, 1+, 2+, 3+, *2+: ≥ 30% in stroma.

Table 6.
Relationship between immunohistochemical results and expression of mutations of TERT and BRAF V600E
Immunohistochemistry (n = 108) TERT
BRAF V600E
Wild (n = 93) Mutant (n = 15) p-value Wild (n = 20) Mutant (n = 88) p-value
NIS ≥ 1+, 50% 67 (72.0) 8 (53.3) .225a 12 (60.0) 63 (71.6) .310
TSHR ≥ 2+ 64 (68.8) 6 (40.0) .030 11 (55.0) 59 (67.0) .309
VEGF ≥ 3+ 61 (65.6) 9 (60.0) .674 10 (50.0) 60 (68.2) .124
VEGFR2 ≥ 2+ 72 (77.4) 9 (60.0) .197a 16 (80.0) 65 (73.9) .567
NF-κB ≥ 3+, 50% 40 (43.0) 5 (33.3) .481 4 (20.0) 41 (46.6) .029
PTEN negative 16 (17.2) 4 (26.7) .472a 6 (30.0) 14 (15.9) .199a

Values are presented as number (%).

TERT, telomerase reverse transcriptase; NIS, sodium iodide symporter; TSHR, thyroglobulin stimulating hormone receptor; VEGF, vascular endothelial cell growth factor; VEGFR2, vascular endothelial cell growth factor receptor 2; NF-κB, nuclear factor kappa-light-chain-enhancer of activated B cells.

a Fisher’s exact test, chi-squared test: not annotated; intensity of immunohisto chemistry: 0, 1+, 2+, 3+, *2+: ≥ 30% in stroma.

Table 7.
Sensitivity and specificity of histopathologic features and mutations in radioiodine-refractory PTCs
Histopathologic feature Sensitivity (%) Specificity (%) Accuracy (%)
Individual features
 Necrosis 62 99 89.8
TERT mutation 54 99 88.0
 Small clusters (≥ 20%)a 65 93 86.1
 Mitosis 46 98 85.2
 Tall cell feature (≥ 10%, < 50%)b 54 96 86.1
 Height/Width ratio in tumor cells (maximum ≥ 3) 54 93 83.3
 Small clusters (≥ 10%) 88 71 75.0
 NF-κB (< 1+, 50%) 35 87 74.1
 Hobnail feature in center 31 88 74.1
 TSHR (< 2+) 65 74 72.2
 VEGFR2 (< 2+) 42 80 71.3
 PTEN (negative) 27 84 70.4
 NIS (< 1, 50%) 46 74 67.6
 Hobnail feature 81 56 62.0
 VEGF (< 3+, 50%) 65 61 62.0
 Small clusters in center 81 48 55.6
BRAF V600E mutation 77 18 32.4
Combined features
 Necrosis + TERT mutation 81 98 93.5
TERT mutation + mitosis 81 96 92.6
 Necrosis + mitosis 77 96 91.7
 Necrosis + H/W3 88 91 90.7
 Mitosis + SC20 85 90 88.9
TERT mutation + H/W3 77 91 88.0
 Necrosis + SC20 77 91 88.0
 H/W3 + SC20 92 85 87.0
 Necrosis + mitosis + TERT mutation 96 88 89.8
TERT mutation + H/W3 + necrosis + mitosis 96 88 89.8
TERT mutation + H/W3 + necrosis + SC20 96 83 86.1
TERT mutation + H/W3 + necrosis + SC20 + mitosis 100 80 85.2
TERT mutation + H/W3 + SC10 + TSHR + NFKB 100 43 56.5
TERT mutation + SC10 + TSHR + NFKB 100 46 59.3

PTC, papillary thyroid cancer; TERT, telomerase reverse transcriptase; NF-κB, nuclear factor kappa-light-chain-enhancer of activated B cells; TSHR, thyroglobulin stimulating hormone receptor; VEGFR2, vascular endothelial cell growth factor receptor 2; NIS, sodium iodide symporter; VEGF, vascular endothelial cell growth factor; H/W3, height//width ratio in tumor cells (maximum ≥ 3); SC20, small clusters (≥ 20%); SC10, small clusters (≥ 10%).

a Small tumor clusters composed of micropapillae without fibrovascular cores;

b The tumor cells show a granular eosinophilic cytoplasm with a height is at least triple their width (< 50% of tumor).

Table 8.
Logistic regression analysis on radioiodine-refractoriness in PTCs (n = 108)
Variables B SE p-value Odd ratio 95% CI
Univariate regression
 Small clustersa (≥ 20%) 3.175 0.591 < .001 23.926 7.51–76.26
 Small clusters (≥ 10%) 2.919 0.660 < .001 18.528 5.08–67.56
 Small clusters in center 1.337 0.545 .014 3.809 1.31–11.08
 Hobnail feature (≥ 5%) 1.680 0.545 .002 5.367 1.84–15.62
 Hobnail features in center 1.163 0.543 .032 3.200 1.11–9.27
 Tall cell featureb (≥ 10%) 1.885 0.310 < .001 6.583 0.008–0.130
 Necrosis (present) 4.864 1.084 < .001 129.6 15.49–1084.489
 Mitosis (≥ 1/10HPF) 3.535 0.817 < .001 34.286 6.92–169.99
 Height/Width ratio of tumor cell (maximum ≥ 3) 2.693 0.578 < .001 14.778 4.56–45.92
TERT mutation 4.549 1.080 < .001 94.5 11.37–785.25
BRAF V600E mutation –0.062 0.574 .915 0.940 0.31–2.90
 NIS (< 1+, 50%) 0.912 0.486 .051 2.490 0.99–6.23
 TSHR (< 2+) 1.702 0.484 < .001 5.487 2.13–14.16
 VEGF (< 3+) 1.082 0.470 .021 2.951 1.17–7.42
 VEGFR2 (< 2+) 1.107 0.485 .022 3.025 1.17–7.83
 NF-κB (< 1+, 50%) 1.229 0.5245 .019 0.293 0.105–0.818
 PTEN (negative) 0.671 0.536 .211 1.955 0.68–5.59
Multivariate regression (stepwise selection)
 Constant –7.854 2.517 .002 0.000
TERT mutation 4.07 1.859 .029 58.529 1.532–2,235.634
 Height/Width ratio of tumor cell (maximum ≥ 3) 3.717 1.481 .012 41.143 2.259–749.405
 Small clusters (≥ 20%) 4.049 1.608 .012 57.315 2.451–1,340.483
 Necrosis 5.407 1.862 .004 223.067 5.803–8,574.022
 TSHR (< 2+) 2.870 1.569 .067 17.629 0.815–381.453
 VEGFR2 (< 2+) 2.617 1.553 .092 13.692 0.653–287.180

Logistic regression analysis was performed in radioiodine-refractory (n=26) and radioiodine-responsive (n = 82) cases of PTC, using all available features.

PTC, papillary thyroid cancer; SE, standard error; CI, confidence intervals; HPF, high-power field; TERT, telomerase reverse transcriptase; NIS, sodium iodide symporter; TSHR, thyroglobulin stimulating hormone receptor; VEGF, vascular endothelial cell growth factor; VEGFR2, vascular endothelial cell growth factor receptor 2; NF-κB, nuclear factor kappa-light-chain-enhancer of activated B cells.

a Small tumor clusters composed of micropapillae without fibrovascular cores;

b The tumor cells show a granular eosinophilic cytoplasm with a height is at least triple their width (< 50% of tumor).

TOOLS
Similar articles