Journal List > Healthc Inform Res > v.30(4) > 1516088908

Handasari, Wulandari, and Haikal: Evaluation of the Usability and User Experience of the Jaminan Kesehatan Nasional Mobile Application in Indonesia

Abstract

Objectives

The National Health Insurance (Jaminan Kesehatan Nasional or JKN) mobile application represents an administrative transformation of health social insurance in Indonesia. The application’s user base has quadrupled in the past 2 years. The study aimed to evaluate the usability and user experience of the JKN mobile application in Indonesia.

Methods

The study administered an online survey featuring the System Usability Scale (SUS) questionnaire alongside a user experience assessment. The survey was disseminated via social media and garnered responses from 370 participants. The variables examined included usability and user experience, specifically focusing on attractiveness, perspicuity, efficiency, dependability, stimulation, and novelty. Data analysis was performed descriptively, and the results were benchmarked.

Results

The JKN mobile application had an average SUS score of 60.9 ± 13.47 (adjective rating “good,” Grade “F,” acceptability rating of “low marginal,” and a percentile range of 34). User experience testing yielded the following results: attractiveness (1.09 ± 1.09), perspicuity (1.05 ± 1.17), efficiency (1.07 ± 1.20), dependability (1.03 ± 1.12), stimulation (0.88 ± 1.20), and novel-ty (0.58 ± 1.09). The benchmark for the JKN mobile application placed the user experience in the “below average” category.

Conclusions

The evaluation of the usability and user experience of the JKN mobile application was generally positive. However, there is a need to improve the usability and all parameters of the user experience. Broader-scale research is needed to explore the factors that influence usage and user experience to promote the adoption of the JKN application and increase user satisfaction.

I. Introduction

The National Social Security System in Indonesia is a government initiative designed to ensure protection and social welfare for all Indonesian citizens. This system is managed by the Social Security Organizing Agency (SSOA). One of its programs, the Jaminan Kesehatan Nasional (JKN), operates on the principles of social insurance and equity. The JKN offers a range of health services to its participants, including preventive, promotive, curative, and rehabilitative care, as well as access to medications and disposable medical supplies. The program has seen a substantial increase in participation, with the total number of JKN participants reaching 257,375,800 as of June 30, 2023 [1].
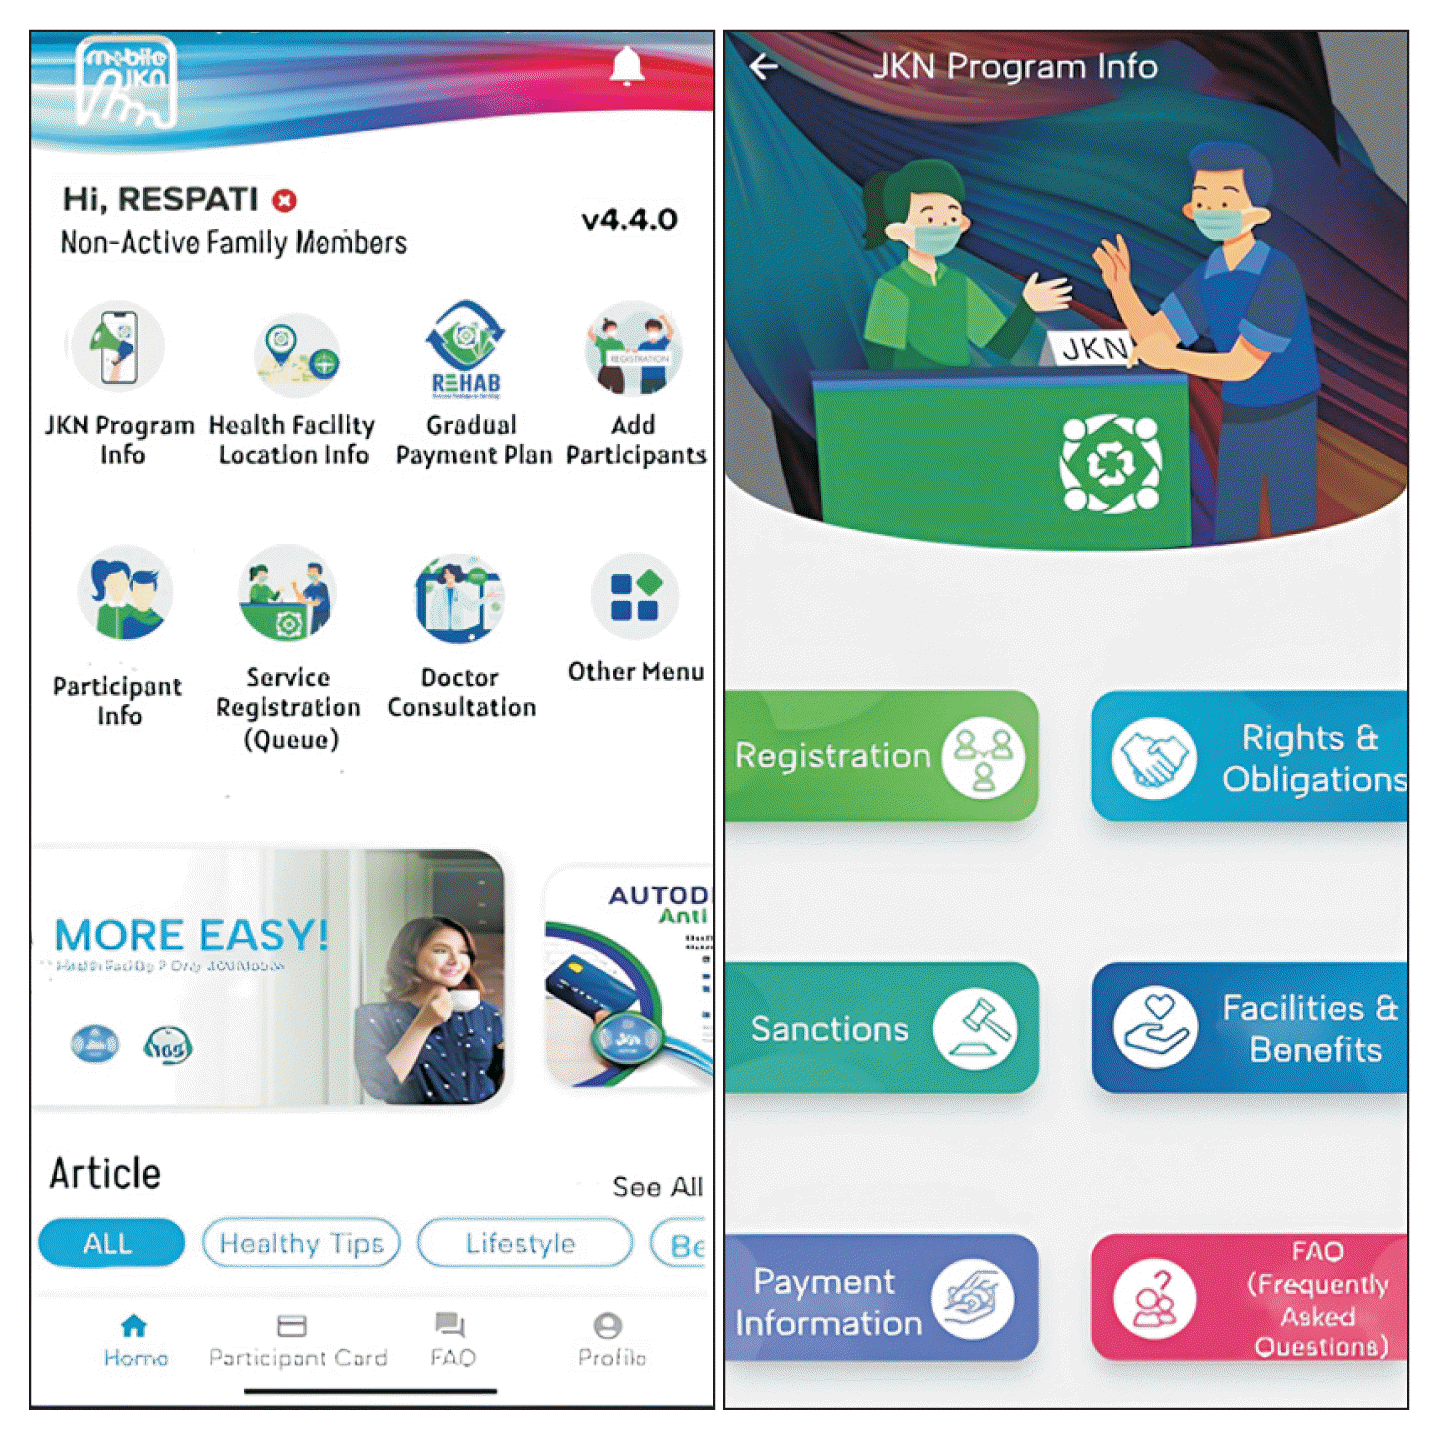
The JKN mobile application was launched in November 2017 as part of SSOA Health’s digital transformation of administrative activities. It allows users to access its services anytime and anywhere. The application is available on both the Google Play Store and the Apple Store. It is recommended that users access the application on Android phones with version 4.0 or higher, as well as on iOS 10. The JKN mobile application features several menus: (1) Participant menu, which includes participant features, participant card features, participant data modification feature, and participant registration feature; (2) Billing menu, which comprises a premium feature, payment feature, and virtual account check feature; (3) Service menu, which offers a service history feature, service registration feature, and screening feature; (4) General menu, which provides a JKN information feature, location feature, complaint submission feature, and settings feature. The user interface of the JKN application is illustrated in Figure 1. In early 2022, the application was enhanced with a new feature that supports online queues. This includes the capability for sending new patient identities and facilitating check-ins when patients arrive at healthcare facilities. The feature supports a continuum of care from primary healthcare facilities to advanced referral healthcare facilities, including internal referrals and follow-up appointments [2]. Over the past 2 years, the number of JKN mobile application users in Indonesia has seen a substantial increase, growing from 432,000 users in 2020 to 16,346,826 users in 2022 [3]. This surge in users raises an important question: Does the application meet the acceptance criteria of its users?
Usability is a quality metric used to evaluate how user-friendly an application is. It encompasses several components: learnability, efficiency, memorability, errors, and satisfaction [4]. Evaluating an application’s usability is deemed essential for the successful development of the application [5]. A variety of tools are available for measuring the usability of mobile health applications, including usability evaluation scales, application usability measurement scales, and application usability ease levels, which are among the most rigorously validated tools [6]. The review results show that 40% of studies assessing mobile health applications rely on questionnaires to evaluate usability [7]. The effectiveness of a mobile application largely depends on its usability. This implies that the application should be easy to use, efficient, and satisfying [8]. Evidence from a review study on mobile health applications highlights that the most commonly assessed usability aspects are efficiency (70%), satisfaction (66%), and effectiveness (58%) [9].
User experience evaluation is recognized as a standard because it extends usability evaluation [10]. According to the ISO 9241-210 standard, user experience is defined as an individual’s perceptions and responses to the use of a product or service system. It reflects the quality of a product based on subjective perceptions. Additionally, the concept of user experience includes considerations of the time before the product is actually used [11]. User experience relates to two main aspects: (1) the quality of user interaction with the product in terms of achieving goals, which includes efficiency, learnability, dependency, and adaptability; and (2) the overall subjective impression of the product, encompassing stimulation, attractiveness, and novelty [12]. The findings from usability and/or user experience evaluations can provide valuable insights for the development of mobile health applications [10,1315].

II. Methods

1. Study Design and Sampling Techniques

This cross-sectional study was conducted from February to July 2023 using the practice sampling method. The sampling technique involved distributing an online survey through social media platforms (WhatsApp, Telegram, and Instagram). The survey, hosted on Google Forms, initially asked respondents if they had ever used the JKN mobile application. Those who answered “yes” were directed to answer evaluation questions about their experience with the JKN mobile application. Conversely, respondents who answered “no” received a link to download the application, along with instructions for its download and use, available directly on the Google Form. This approach helped validate the recruitment of respondents and aims to minimize potential response bias. The inclusion criteria for participation in the study required respondents to have used the JKN application at least once and to be at least 18 years old.

2. Population and Sample

The population in this study comprised all Indonesian citizens who use the JKN mobile application. The technique for calculating the sample size was based on the Isaac and Michael sample size determination table. Assuming there are 16,346,260 JKN mobile application users in 2022 [2], and allowing a margin of error of 5%, the minimum sample size required was 349. For this study, a sample size of 370 was deemed sufficient to represent the population.

3. Instrument and Variables

This study used the System Usability Scale (SUS) to measure usability. This instrument is structured as a questionnaire, adapted from Bangor et al. [16]. The SUS questionnaire includes 10 statements designed to assess the usability of the JKN mobile application (Table 1). Each statement on the SUS features a 5-point scale ranging from “strongly disagree” to “strongly agree.” The statements in the SUS are composed of five negative and five positive statements, which are presented in an alternating sequence.
The instrument used to measure user experience is the User Experience Questionnaire (UEQ), which has been translated into Indonesian following Santoso et al.’s work [17]. This questionnaire comprises 26 statements, organized into six parameters as shown in Table 2. The dependent variables in this study are these six user experience parameters: attractiveness, perspicuity, efficiency, dependability, stimulation, and novelty [18]. Each item in the UEQ is represented by a pair of opposing words, and participants rate them on a 7-point scale. For instance, the efficiency of the application is measured on a scale from “fast” to “slow.” The instrument used to assess respondent characteristics is a closed-ended questionnaire. These characteristics include sex, age, education, marital status, occupation, JKN membership, domicile, and income.

4. Data Analysis

All respondents’ answers were individually reviewed. This process included cleaning, which involves identifying outlier data, removing data that do not meet the inclusion criteria, checking for possible data duplication, and examining other data errors. The analysis of the SUS questionnaire yields an average usability score for the JKN mobile application. The SUS score is calculated as follows [8]:
  • Subtract 1 from the respondent’s answer score for positive statement items (odd-numbered statements). For example, if a respondent scores a 4 on statement number 3, the adjusted score is 4 – 1 = 3.

  • For negative statement items (even-numbered statements), subtract 1 from the respondent’s answer score, denoted as X. For instance, if a respondent scores a 2 on statement number 4, the adjusted score is 2 – 1 = 1.

  • Sum these adjusted scores and multiply the total by 2.5.

  • The final result, which ranges from 0 to 100, represents the average usability score of the JKN mobile application.

The average usability score was interpreted using the SUS score, which ranges from 0 to 100, to determine its classification in terms of adjective ratings, grade scale, and acceptability ranges (Figure 2). A SUS score of 50 is considered poor, a score above 70 is considered good, and a score of 85 or higher is considered excellent [8,16]. According to Table 3, the average usability score is interpreted within specific percentile ranges [19].
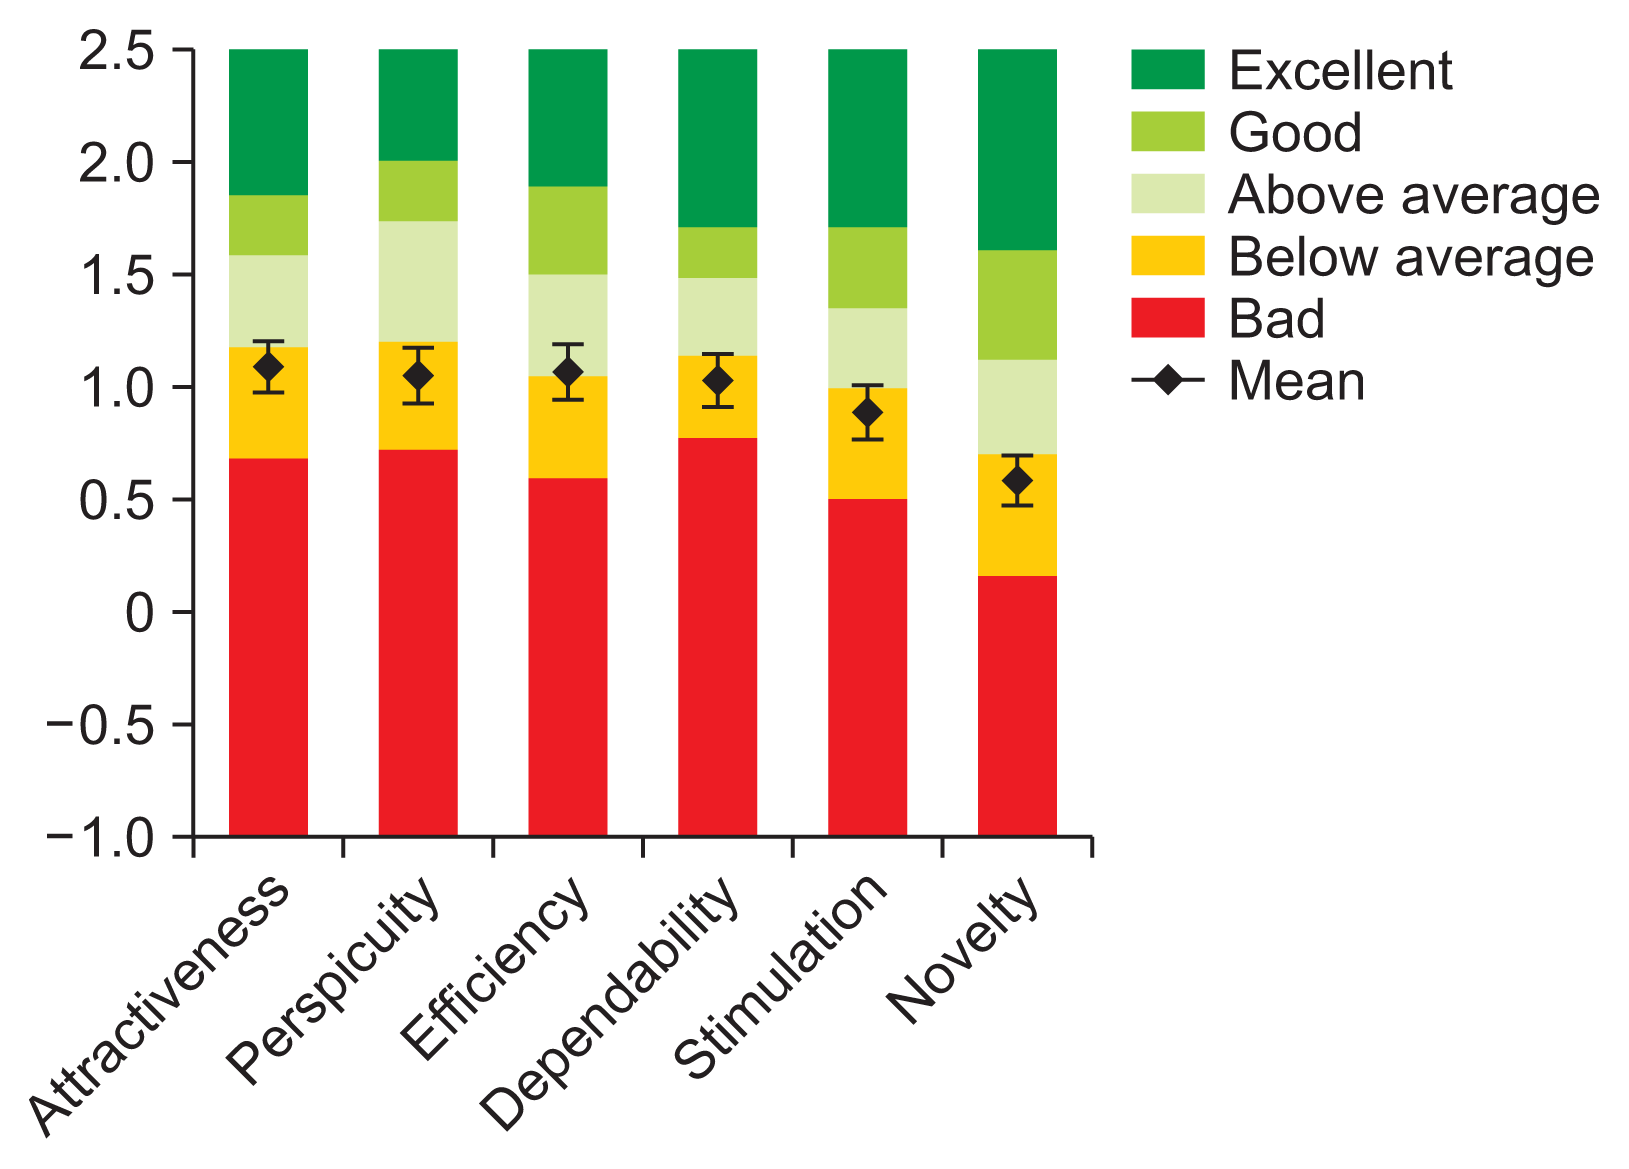
The UEQ analysis, available on the official website (https://www.ueq-online.org/), was utilized to assess the user experience of the JKN mobile application. This analysis produces average scores for each user experience parameter. These scores are interpreted as follows: an average score of −0.8 signifies a negative evaluation, a score ranging from 0 to +8 denotes a neutral evaluation, and any score above +8 reflects a positive evaluation. Scores between 1 and 2 are indicative of a very good evaluation. Additionally, the UEQ analysis generates benchmark graphics that compare the JKN mobile application with other applications.

5. Ethics

This study was approved by the Health Research Ethics Committee Faculty of Health Dian Nuswantoro University (No. 349/EA/KEPK-Fkes-UDINUS/I/2023). The Health Ethics Committee declares that the proposed research protocol is ethically feasible, in accordance with the seven standards of the World Health Organization in 2011.

III. Results

1. Respondent Characteristics

A total of 370 individuals completed the questionnaire. Table 4 summarizes the frequency distribution of respondent characteristics. The majority of respondents were women (75.9%), under 25 years old (88.1%), and possessed a low to medium level of education. Most were unmarried or single (91.9%), unemployed (79.5%), and had no income (64.3%). Additionally, the majority of respondents were JKN participants (85.4%) and lived on the island of Java (83.5%).

2. Usability

The SUS scores collected from 370 respondents totaled 2,254, with an average of 60.9 and a standard deviation of 13.47. Table 5 presents the frequency distribution of SUS evaluation results, categorized by acceptability rating, grade, and adjective rating. The analysis of the JKN mobile application revealed that the responses were predominantly categorized as marginal in the acceptability rating (52.4%), received a grade of “F” (43%), and were described by the adjective rating as “good” (52%).
The interpretation of the SUS score, according to Bangor et al., indicated that the JKN mobile application was rated as “good” in the adjective rating. However, it received a grade of “F” and an acceptability rating of “marginal.” Based on the Lewis scale, this average score fell within the 34th percentile, suggesting substantial room for improvement in the application’s usability.

3. User Experience

Table 6 presents the results of the JKN application’s user experience evaluation. It illustrates the user experience in terms of attractiveness, perspicuity, efficiency, dependability, stimulation, and novelty. Overall, the user experience parameters indicated positive values, with an average score greater than 0.8. However, novelty received the lowest average score, at 0.58.
The evaluation results for the user experience of the m-JKN application indicate that, in terms of attractiveness, its average score was 1.09, placing it in the “below average” benchmark category (25%–50% scale). The mean score of 1.09, with a standard deviation of 1.09 at a 95% confidence level (Z-score of 1.96) and a sample size of 370, resulted in a confidence interval (CI) of 0.111, ranging from 0.976 to 1.197. This CI range remained within the “below average” category, with the upper limit slightly exceeding the category’s upper boundary. Detailed calculations can be found in Table 6. The standard deviation is linked to the CI value and the sample size. Specifically, a larger sample size results in a narrower CI, which increases estimation accuracy and yields more reliable results. The standard deviation values for all parameters in the user experience evaluation were reasonably small and within acceptable limits, as the CI values fell within the benchmark category range. Therefore, it can be concluded that the user experience of the JKN mobile application, across parameters such as attractiveness, perspicuity, dependability, stimulation, and novelty, was categorized as “below average” (25%–50% scale). However, the efficiency parameter ranked in the “above average” benchmark category (50%–75% scale), suggesting that the application performs efficiently (Figure 3). The benchmark used in the UEQ compared the JKN application with other applications assessed using the UEQ, including business software, web pages, web shops, and social networks.

IV. Discussion

This study evaluates the use of the JKN mobile application among a sample of 370 respondents from across Indonesia. The evaluation, conducted using the SUS, provides insights into user perceptions regarding satisfaction, efficiency, learnability, errors, and memorability [6]. The average SUS score obtained was 60.9, with a standard deviation of 13.47. According to Bangor’s interpretation [16], this average score would be categorized as “good” (194 individuals; 52%). However, the acceptance of the JKN mobile application was categorized as “low marginal.” This assessment is based on the acceptability rating, where the majority of responses (194 individuals; 52%) fell into the “low marginal” category. “Low marginal” is defined as a level between “not acceptable” and “high marginal,” indicating a status that is considerably below “acceptable.” This aligns with the SUS score being in the lowest grade, which is grade F, with most respondents’ assessments (159 individuals; 43%) falling into this category. These findings suggest that while the JKN mobile application was considered “good” by a majority of users, there is a substantial need for improvements in its overall usability.
Several previous studies on the evaluation of the JKN mobile application have reported findings similar to those of this research. A study on the JKN mobile application [20] reported an initial average SUS score of 59 and recommended further development of the application. Likewise, Lubis et al. [21] highlighted both strengths and weaknesses of the JKN mobile application, recommending enhancements to improve the system. A study involving local respondents in Malang, Indonesia, found low scores in control, learnability, and efficiency aspects of the JKN mobile application [22]. When compared to other mobile health applications, the JKN mobile application has a lower average SUS score. In contrast, other mobile health applications such as Oncodoc [23], JAGA SEHAT app [24], “Pedulilindungi” app [25], and TOGETHERCare app [26] all boast higher average SUS scores.
User feedback on the JKN mobile application has been positive across nearly all dimensions—including attractiveness, perspicuity, efficiency, dependability, stimulation, and novelty—with mean scores above 0.8. User satisfaction with an application hinges on its attractiveness, pragmatic qualities (such as perspicuity, efficiency, and dependability), and hedonic qualities (including stimulation and originality) [27]. Hedonic qualities, which include features of the application, visual resources, and the ease of monitoring treatment, positively influence the user experience of mobile health applications [28]. Conversely, factors such as comfort, responsiveness, and availability are positive predictors of user experience [29]. However, perceptions of user experience regarding mobile applications encompass all aspects of interaction with the product, including feelings, thoughts, and perceptions related to the use of the product [30].
The pragmatic quality of this study was positively assessed by the respondents. The majority of users of the JKN mobile application, approximately 85.4%, are members of the SSOA health insurance program. The application’s efficiency, dependability, and stimulation were also favorably evaluated by the respondents, indicating that the application is practical, fast, secure, and beneficial. Participants from the SSOA reported significant benefits from using the JKN mobile application. Before the application was available, participants had to physically visit local SSOA offices to handle tasks such as registration, adding new members, and filing service-related complaints. With the introduction of new features, SSOA participants now enjoy greater convenience in managing healthcare services, including registration (queueing), accessing facility location information, and consulting with doctors. This has resulted in time and cost savings for the participants, which is consistent with previous research findings that highlight the significant influence of time and money on user experience [28].
The perspicuity of the JKN mobile application was rated highly by respondents, who found it simple, straightforward, and user-friendly. This can be attributed to the demographic characteristics of the respondents: the majority (60.8%) had completed education up to senior high school, and a significant portion (88.1%) were aged 24 or younger, suggesting that they were predominantly students or college students. These respondents are typically part of Generation Z, a group known for its openness to new developments, including advancements in information technology. They are generally well-versed in computer use, adept at navigating social media, and consequently, comfortable with mobile applications. This familiarity likely influenced their positive assessment of the application, a finding that aligns with previous research conducted on the Oncodoc application [23].
The hedonic quality, particularly the novelty aspect, received the lowest average score (0.580 ± 1.09) from respondents when compared to attractiveness, efficiency, perspicuity, dependability, and stimulation. This lower score may be due to Generation Z’s reduced perception of novelty, as their frequent use of social media and applications could lead them to perceive the experience of using a new application as commonplace. Consequently, they may hold higher standards for what constitutes a truly novel and distinct application. Despite this, the benchmark for the novelty aspect of the JKN mobile application still fell within the “below average” range.
Based on the evaluation results for usability and user experience, it can be concluded that the JKN mobile application exhibits a marginally low level of usability. While the user experience, in terms of attractiveness, perspicuity, efficiency, dependability, stimulation, and novelty, receives positive ratings, the overall user experience evaluation of the JKN mobile application remains in the “below-average” category. This indicates a need for improvements in both usability and all user experience parameters of the JKN mobile application.
The limitations of this study include the use of an online survey method, which may introduce selection bias in sample selection. Despite validation efforts to ensure that only users of the JKN mobile application were eligible to complete the questionnaire, it was not possible to completely eliminate respondent answer bias. Conducting further research on a larger scale would enhance the reliability and generalizability of the findings and positively influence improvements in the adoption and user satisfaction of the JKN mobile application.

Notes

Conflict of Interest

No potential conflict of interest relevant to this article was reported.

Acknowledgments

All researchers would like to thank Savira Putri Handasari who has contributed to her thesis at the Department of Public Health, Faculty of Health Science, Dian Nuswantoro University, Semarang, Indonesia

References

1. The Social Health Insurance Organizer. Participants of the National Health Insurance Program (Program JKN) [Internet]. Jakarta, Indonesia: The Social Health Insurance Organizer;2023. [cited at 2023 Jul 7]. Available from: https://www.bpjs-kesehatan.go.id/#/.
2. Ministry of Communication and Digital Republic of Indonesia. Access services at your fingertips via JKN Mobil [Internet]. Jakarta, Indonesia: Ministry of Communication and Digital Republic of Indonesia;2020. [cited 2024 Oct 28]. Available from: https://www.kominfo.go.id/berita/pengumuman/detail/mengaksespelayanan-dalam-genggaman-melalui-jkn-mobile/.
3. Bahri S, Amri A, Siregar AA. Analysis of service quality of the mobile JKN application by the social health insurance organizer using the service quality (Servqual) method. Ind Eng J. 2022; 11(2):1–7.
4. Nielsen J. Usability 101: introduction to usability [Internet]. Dover (DE): Nielsen Norman Group;2012. [cited at 2023 Jul 19]. Available from: https://www.nngroup.com/articles/usability-101-introduction-to-usability/.
5. Lewis JR. The system usability scale: past, present, and future. Int J Hum Comput Interact. 2018; 34(7):577–90. https://doi.org/10.1080/10447318.2018.1455307.
crossref
6. Muro-Culebras A, Escriche-Escuder A, Martin-Martin J, Roldan-Jimenez C, De-Torres I, Ruiz-Munoz M, et al. Tools for evaluating the content, efficacy, and usability of mobile health apps according to the consensus-based standards for the selection of health measurement instruments: systematic review. JMIR Mhealth Uhealth. 2021; 9(12):e15433. https://doi.org/10.2196/15433.
crossref
7. Hajesmaeel-Gohari S, Khordastan F, Fatehi F, Samzadeh H, Bahaadinbeigy K. The most used questionnaires for evaluating satisfaction, usability, acceptance, and quality outcomes of mobile health. BMC Med Inform Decis Mak. 2022; 22(1):22. https://doi.org/10.1186/s12911-022-01764-2.
crossref
8. Brooke J. SUS: a retrospective. J Usabil Stud. 2013; 8(2):29–40.
9. Weichbroth P. Usability of mobile applications: a systematic literature study. IEEE Access. 2020; 8:55563–77. https://doi.org/10.1109/ACCESS.2020.2981892.
crossref
10. Lobo EH, Abdelrazek M, Frolich A, Rasmussen LJ, Livingston PM, Islam SM, et al. Detecting user experience issues from mHealth apps that support stroke caregiver needs: an analysis of user reviews. Front Public Health. 2023; 11:1027667. https://doi.org/10.3389/fpubh.2023.1027667.
crossref
11. Hornbæk K, Hertzum M. Technology acceptance and user experience: a review of the experiential component in HCI. ACM Transact Comput Hum Interact. 2017; 24(5):1–30. https://doi.org/10.1145/3127358.
crossref
12. Sharp H, Rogers Y, Preece J. Interaction design: beyond human-computer interaction. 2nd ed. Chichester, UK: John Wiley & Sons;2007.
13. Wulandari R, Suwandono A, Kartasurya MI, Nugraheni SA. Postpartum care behavior improvement during COVID-19 pandemic in indonesia using mobile-health interactive message. Ethiop J Health Sci. 2022; 32(2):243–54. https://doi.org/10.4314/ejhs.v32i2.4.
crossref
14. Kushendriawan MA, Santoso HB, Putra PO, Putra PO, Schrepp M. Evaluating user experience of a mobile health application halodoc using user experience questionnaire and usability testing. J Sist Inf. 2021; 17(1):58–71. https://doi.org/10.21609/jsi.v17i1.1063.
crossref
15. Islam MN, Karim MM, Inan TT, Islam AK. Investigating usability of mobile health applications in Bangladesh. BMC Med Inform Decis Mak. 2020; 20(1):19. https://doi.org/10.1186/s12911-020-1033-3.
crossref
16. Bangor A, Kortum P, Miller J. Determining what individual SUS scores mean: adding an adjective rating scale. J Usabil Stud. 2009; 4(3):114–23.
17. Santoso HB, Schrepp M, Isal RY, Utomo AY, Priyogi B. Measuring user experience of the student-centered elearning environment. J Educ Online. 2016; 13(1):58–79.
18. Laugwitz B, Held T, Schrepp M. Construction and evaluation of a user experience questionnaire. Holzinger A, editor. HCI and usability for education and work. Heidelberg, Germany: Springer;2008. p. 63–7. https://doi.org/10.1007/978-3-540-89350-9_6.
crossref
19. Lewis JR, Sauro J. Item benchmarks for the system usability scale. J Usabil Stud. 2018; 13(3):158–67.
20. Parera G, Darwis M. Usability of JKN mobile application using system usability scale (SUS) method. J Bit-Tech. 2023; 5(3):138–45. https://doi.org/10.32877/bt.v5i3.691.
crossref
21. Lubs BO, Salim A, Jefi . Evaluation of usability of the mobile JKN application system using the use questionnaire. J Saintekom. 2020; 10(1):65–76.
22. Annisa N, Pradana DS, Suharso W. Evaluation of the National Health Insurance (JKN) mobile application in Malang City from the usability aspect. J Repos. 2020; 2(12):1689–99. https://doi.org/10.22219/repositor.v2i12.30999.
crossref
23. Wulandari R, Pangarsa EA, Andono PN, Rachmani E, Sidiq M, Setyowati M, et al. Evaluation of usability and user experience of Oncodoc’s M-health application for early detection of cancer. Asian Pac J Cancer Prev. 2022; 23(12):4169–4176. https://doi.org/10.31557/APJCP.2022.23.12.4169.
crossref
24. Iskandarsyah A, Shabrina A, Siswadi AG. Usability and acceptability of JAGA SEHAT: mobile application to improve knowledge about healthy lifestyle. J Multidiscip Healthc. 2022; 15:115–24. https://doi.org/10.2147/JMDH.S342913.
crossref
25. Dyayu AL, Beny YH, Yani H. Evaluation of the usability of the PeduliLindungi application using usability testing and the system usability scale (SUS) method. J Manaj Teknol Dan Sist Inf. 2023; 3(1):395–404. https://doi.org/10.33998/jms.2023.3.1.720.
crossref
26. Oakley-Girvan I, Yunis R, Fonda SJ, Neeman E, Liu R, Aghaee S, et al. A novel smartphone application for the informal caregivers of cancer patients: usability study. PLOS Digit Health. 2023; 2(3):e0000173. https://doi.org/10.1371/journal.pdig.0000173.
crossref
27. Hassenzahl M. The effect of perceived hedonic quality on product appealingness. Int J Hum Comput Interact. 2001; 13(4):481–99. https://doi.org/10.1207/S15327590IJHC1304_07.
crossref
28. Biduski D, Bellei EA, Rodriguez JP, Zaina LA, De Marchi AC. Assessing long-term user experience on a mobile health application through an in-app embedded conversation-based questionnaire. Comput Hum Behav. 2020; 104:106169. https://doi.org/10.1016/j.chb.2019.106169.
crossref
29. Pal S, Biswas B, Gupta R, Kumar A, Gupta S. Exploring the factors that affect user experience in mobile-health applications: a text-mining and machine-learning approach. J Bus Res. 2023; 156:113484. https://doi.org/10.1016/j.jbusres.2022.113484.
crossref
30. Ramachandran A, Snehalatha C, Ram J, Selvam S, Simon M, Nanditha A, et al. Effectiveness of mobile phone messaging in prevention of type 2 diabetes by lifestyle modification in men in India: a prospective, parallel-group, randomised controlled trial. Lancet Diabetes Endocrinol. 2013; 1(3):191–8. https://doi.org/10.1016/S2213-8587(13)70067-6.
crossref

Figure 1
User interface display of the National Health Insurance (Jaminan Kesehatan Nasional or JKN) mobile application.
hir-2024-30-4-324f1.gif
Figure 2
Users’ System Usability Scale score [18].
hir-2024-30-4-324f2.gif
Figure 3
National Health Insurance (Jaminan Kesehatan Nasional or JKN) mobile application benchmark.
hir-2024-30-4-324f3.gif
Table 1
System Usability Scale statement items [19]
Statement items
1 I think that I would like to use the JKN mobile application more often.
2 I found the JKN mobile application to be complex to use.
3 I found that the JKN mobile application is easy to use.
4 I need assistance from others or technicians to use the JKN mobile application.
5 I found various functions in the JKN mobile application to be well-integrated.
6 I encountered a lot of inconsistencies in the JKN mobile application.
7 I imagine people would learn to use the JKN mobile application easily.
8 I found the JKN mobile application to be very difficult to use.
9 I feel very confident using the JKN mobile application.
10 I need to learn a lot of things before I can start using the JKN mobile application.

JKN: Jaminan Kesehatan Nasional (National Health Insurance).

Table 2
Grouping of parameters from the user experience variable
Parameter Item
1 Attractiveness annoying/enjoyable
good/bad
unlikable/pleasing
unpleasant/pleasant
attractive/unattractive
friendly/unfriendly

2 Efficiency fast/slow
inefficient/efficient
impractical/practical
organized/cluttered

3 Perspicuity not understandable/understandable
easy to learn/difficult to learn
complicated/easy
clear/confusing.

4 Dependability unpredictable/predictable
obstructive/supportive
secure/not secure
meets expectations/does not meet expectations

5 Stimulation valuable/inferior
boring/exciting
not interesting/interesting
motivating/demotivating

6 Novelty creative/dull
inventive/conventional,
usual/leading edge
_ _ conservative/innovative
Table 3
Curved grading scale for the SUS [21]
Grade SUS Percentile range
A+ 84.1–100 96–100
A 80.8–84.0 90–95
A 78.9–80.7 85–89
B+ 77.2–78.8 80–84
B 74.1–77.1 70–79
B 72.6–74.0 65–69
C+ 71.1–72.5 60–64
C 65.0–71.0 41–59
C 62.7–64.9 35–40
D 51.7–62.6 15–34
F 0–51.6 0–14

SUS: System Usability Scale.

Table 4
Respondent characteristics (n = 370)
Variable Frequency (%)
Sex
 Female 281 (75.9)
 Male 89 (24.1)

Age (yr)
 ≤24 326 (88.1)
 >25 44 (11.9)

Education
 Low 5 (1.4)
 Medium 225 (60.8)
 High 140 (37.8)

Status
 Unmarried 340 (91.9)
 Married 30 (8.1)

Occupation
 Unemployed 294 (79.5)
 Employed 76 (20.5)

Participation in JKN
 Not a participant 54 (14.6)
 Participant 316 (85.4)

Domicile
 Outside of Java Island 61 (16.5)
 Java Island 309 (83.5)

Income
 No income 238 (64.3)
 Having income 132 (35.7)
Table 5
Usability score of the JKN mobile application (n = 370)
Components n (%)
Acceptability rating
 Not acceptable 101 (27.3)
 Marginal 194 (52.4)
 Acceptable 75 (20.3)

Grade
 F 159 (43.0)
 D 105 (28.0)
 C 77 (21.0)
 B 17 (5.0)
 A 12 (3.0)

Adjective rating
 Worst imaginable 3 (1.0)
 Poor 14 (4.0)
 OK 106 (29.0)
 Good 194 (52.0)
 Excellent 39 (11.0)
 Best imaginable 14 (4.0)
Table 6
Evaluation of the user experience of the JKN mobile application and benchmark categories (n = 370)
Parameter Mean SD 95% CI Benchmark category Description


Lower Upper 25% 50% 75% 90%
Attractiveness 1.09 1.08 0.98 1.20 0.69 1.18 1.58 1.84 Below average

Perspicuity 1.05 1.17 0.93 1.17 0.72 1.20 1.73 2.00 Below average

Efficiency 1.07 1.20 0.94 1.19 0.60 1.05 1.50 1.88 Above average

Dependability 1.03 1.12 0.91 1.14 0.78 1.14 1.48 1.70 Below average

Stimulation 0.88 1.20 0.76 1.01 0.50 1.00 1.35 1.70 Below average

Novelty 0.58 1.08 0.47 0.69 0.16 0.70 1.12 1.60 Below average
TOOLS
Similar articles