Setting
This study evaluated the total narcotics prescriptions from July 2000 to June
2018 at a single large hospital. Prescriptions for patients with cancer and for
inpatients were excluded from the analysis. The analysis focused on the
following 12 narcotics: fentanyl, hydrocodone, hydromorphone, morphine,
oxycodone, oxycodone/naloxone, tapentadol, alfentanil, meperidine, remifentanil,
buprenorphine, and nalbuphine. Low-dose narcotics such as codeine and tramadol
were excluded from the study.
Most patterns of NUD involve taking higher doses than those intended by doctors.
The hypothesis was that a patient at risk of developing NUD would employ
multiple strategies to achieve a higher MEDD, resulting in a discrepancy between
the MEDD intended by the doctors and the overlapping MEDD that the patient
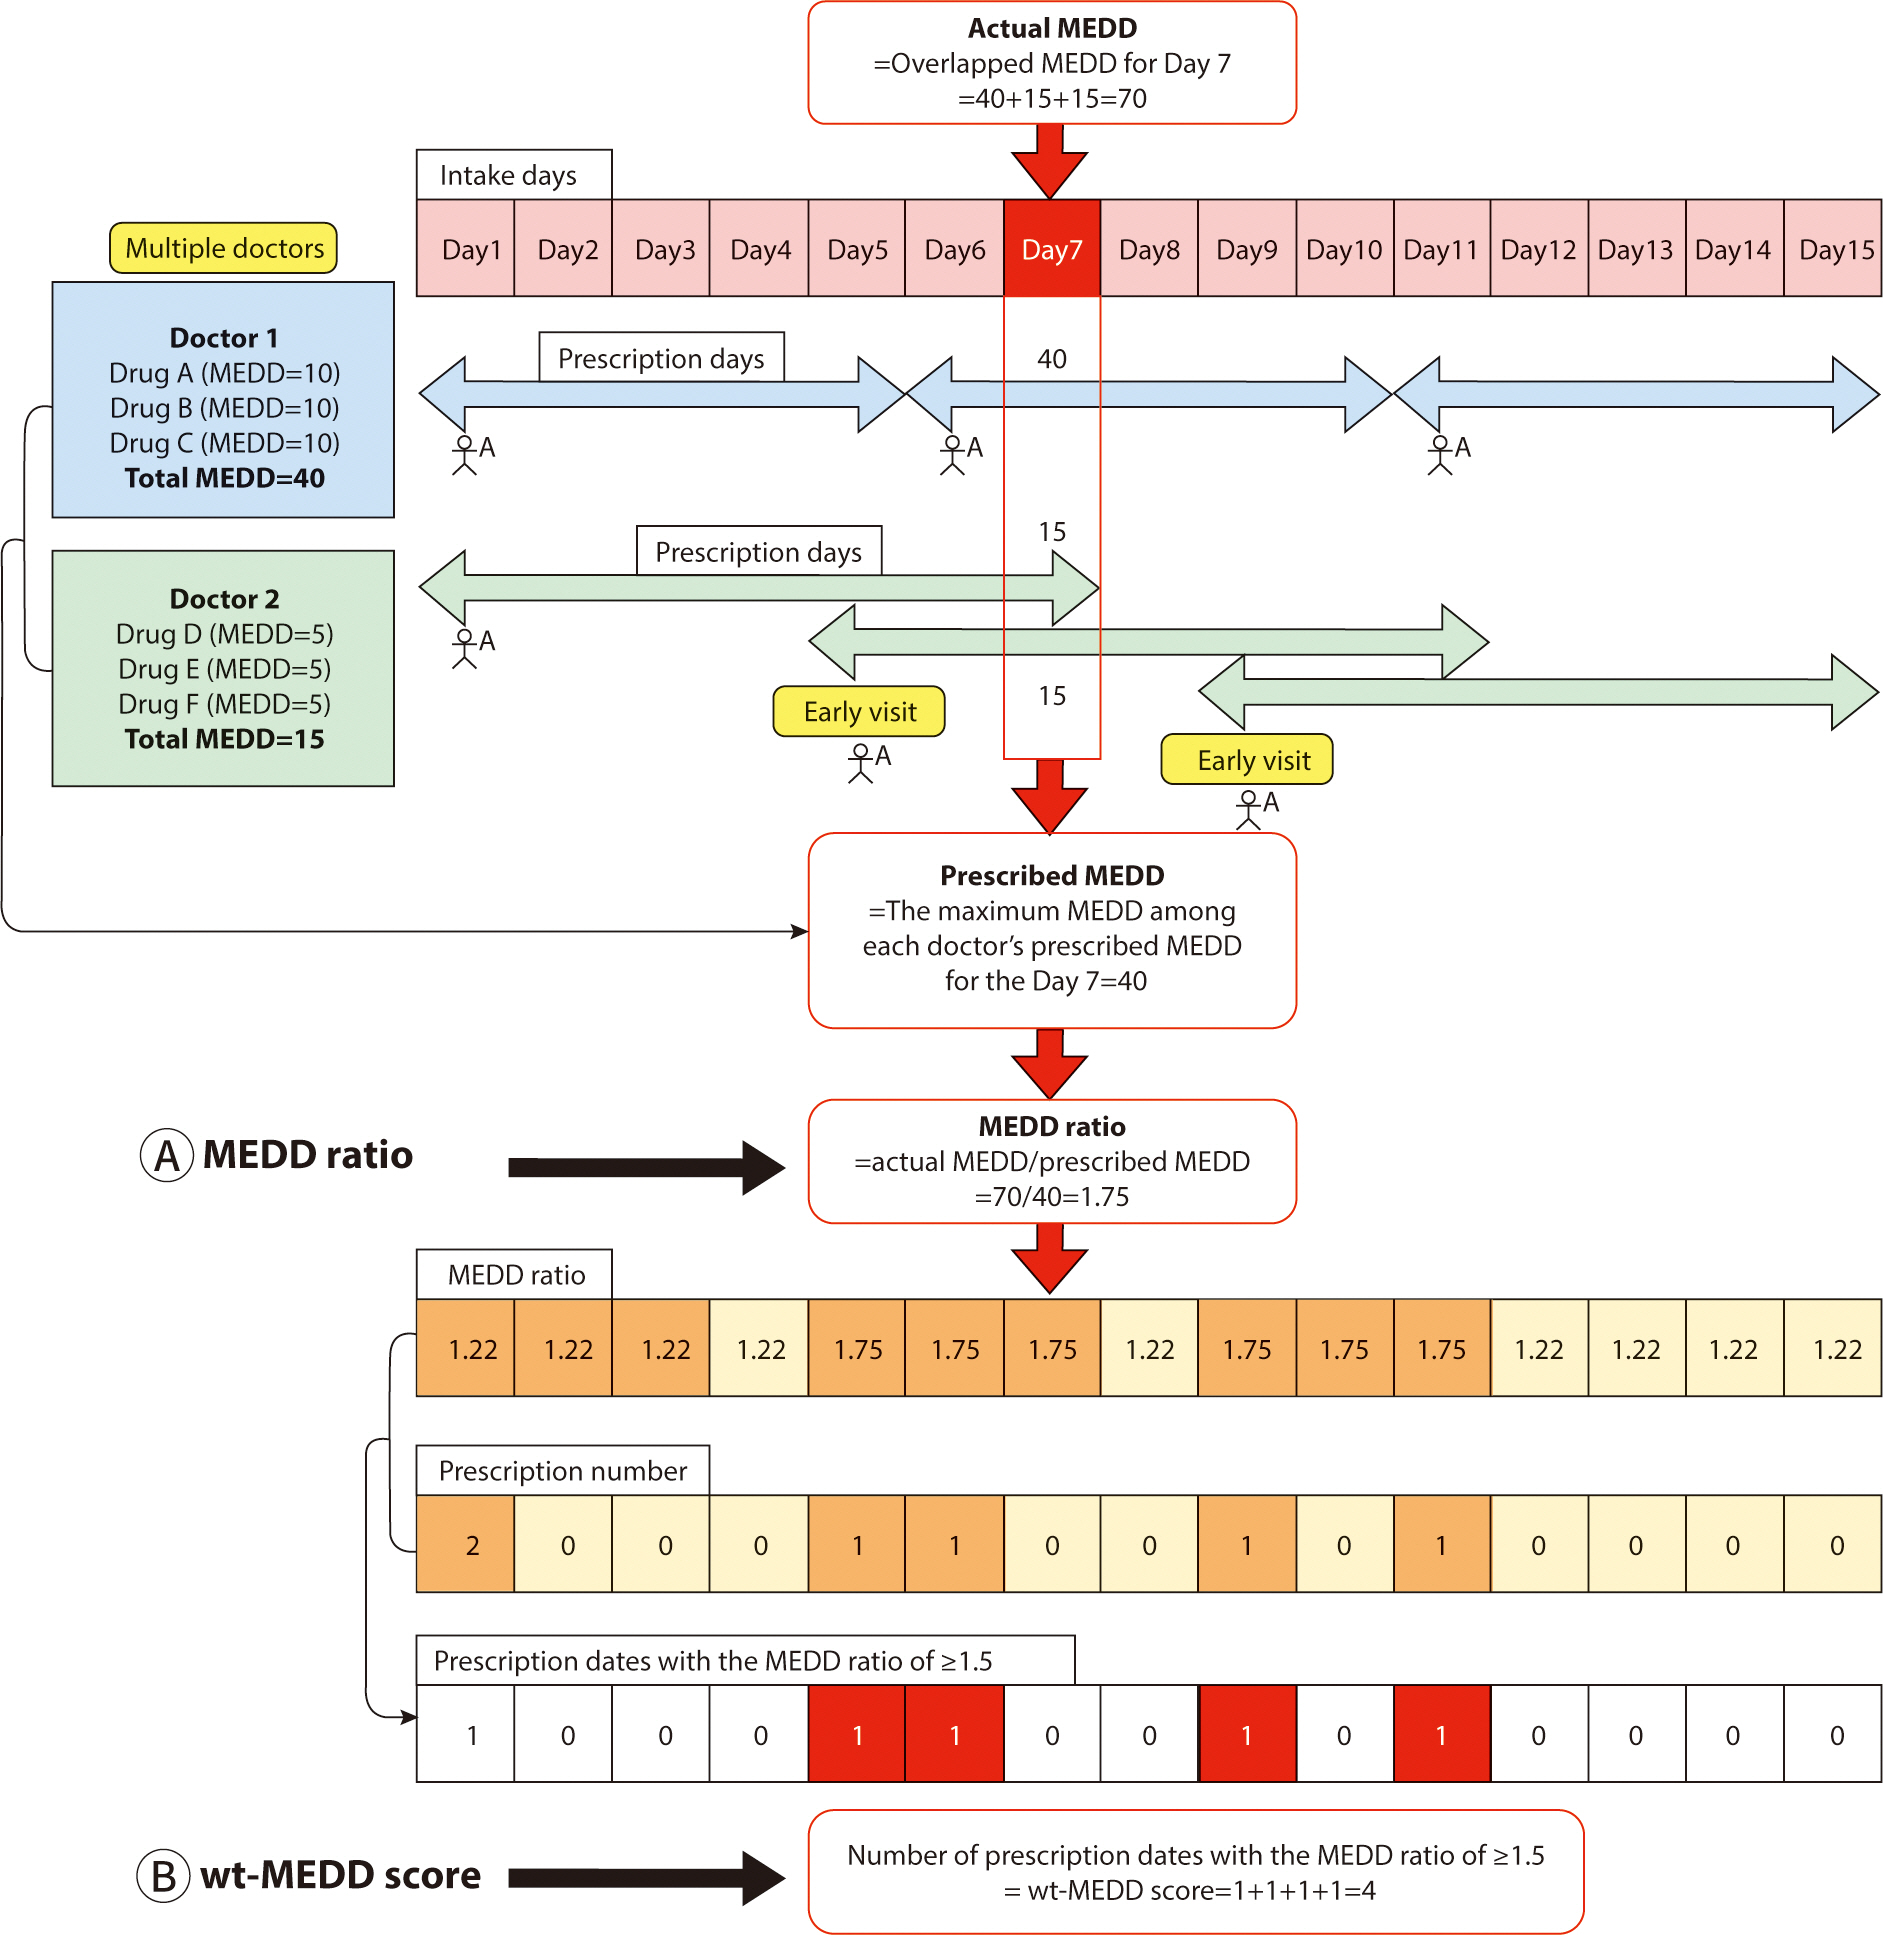
achieves through these strategies. Consequently, the MEDD ratio is defined as
follows (
Fig. 1A):
Fig. 1.
Schematic diagram of the calculation of the weighted MEDD score.
MEDD, morphine equivalent daily dose; wt-MEDD, weighted MEDD.

For example, doctor 1 prescribes 40 MEDD to patient A, deeming it an appropriate
dosage. However, patient A subsequently visits Doctor 2 to obtain an additional
prescription for narcotics. Unaware of the previous prescription from Doctor 1,
Doctor 2 prescribes an additional 15 MEDD, considering it suitable for patient
A. Later, patient A returns to doctor 2 before the scheduled follow-up, claiming
to have lost the previous prescription, and receives another 15 MEDD.
Consequently, patient A ends up receiving a total of 70 MEDD of narcotics, which
is 1.75 times the highest intended dose of 40 MEDD prescribed by the doctors.
The MEDD ratio, defined as the ratio between the actual MEDD received and the
maximum intended MEDD prescribed by the doctors, is thus 1.75 in this scenario
(
Fig. 1A).
We defined the wt-MEDD score as follows (
Fig.
1B):
In
Fig. 1, patient A consults doctor 1 on
days 1, 6, and 11, and sees doctor 2 on days 1, 5, and 9. This results in a
total of five prescription dates for patient A (days 1, 5, 6, 9, and 11). Out of
these, the number of dates where the MEDD ratio is ≥1.5 amounts to four
(day 5, 6, 9, and 11). The wt-MEDD score, which is defined as the number of
prescription dates with a MEDD ratio of ≥1.5, is therefore 4, as shown in
Fig. 1B. If patient A persists in
obtaining narcotics prescriptions from multiple doctors and visiting them
earlier than scheduled, the wt-MEDD score will continue increasing.
The choice of a MEDD ratio of 1.5—higher than 1.0 but lower than
2.0—was made to accommodate minor discrepancies between the intended MEDD
prescription by doctors and the actual MEDD, such as during initial dose
adjustments at the start of narcotic prescriptions. This range also effectively
identifies abnormal prescriptions that require further review. Ratios below 1.5
may be overly sensitive, failing to distinguish significant deviations between
the actual and intended MEDD. Institutions can adjust the cut-off MEDD ratio
based on their preferences, opting for less than 1.5 to increase sensitivity or
more than 1.5 to increased specificity. The wt-MEDD score served as a proxy for
NUD because repeated prescriptions with a high MEDD rate suggest that the
patient is consistently receiving more narcotics than originally prescribed by
the physician.
We investigated the clinical applicability of the wt-MEDD score, specifically to
monitor abnormal narcotics prescription patterns in a hospital setting. It is
necessary to identify both the doctors and patients involved in these practices
and to provide them with feedback. To this end, we utilized the wt-MEDD score to
compile lists of doctors and patients associated with abnormal prescription
patterns. We identified doctors with outlier wt-MEDD scores and similarly
generated a list of patients exhibiting outlier scores to closely monitor their
prescription behaviors. These individuals were characterized by a two-tailed
P-value of <0.001, corresponding to a Z score of ≥3.29 or
≤–3.29. We then extracted the lists of doctors and patients with
these outlier wt-MEDD scores and determined the cut-off score for both groups to
effectively monitor and address abnormal narcotics prescribing patterns.
Second, we examined whether the wt-MEDD score could be utilized to identify
patients with NUD at an earlier stage. Our analysis focused on determining the
optimal cut-off value of the wt-MEDD score for detecting patients diagnosed with
NUD by physicians, aiming for the highest sensitivity and specificity. If the
cut-off value demonstrated high sensitivity and specificity, and if it was
reached before the doctors' diagnosis of NUD, it could serve as an early
indicator for NUD detection. A list of patients diagnosed with NUD by doctors
was extracted from the clinical data warehouse using the codes from the 10th
revision of the International Statistical Classification of Disease and Related
Health Problems (ICD-10) and diagnostic terms in the doctors’ medical
chart. The accuracy of the NUD diagnoses was verified by ensuring that the chart
records met the diagnostic criteria outlined in the DSM-IV-TR or DSM-V. We
selected only those patients who had been repeatedly prescribed narcotics at our
hospital prior to their NUD diagnosis. Patients diagnosed with NUD at other
hospitals, who had little or no history of narcotics prescriptions at our
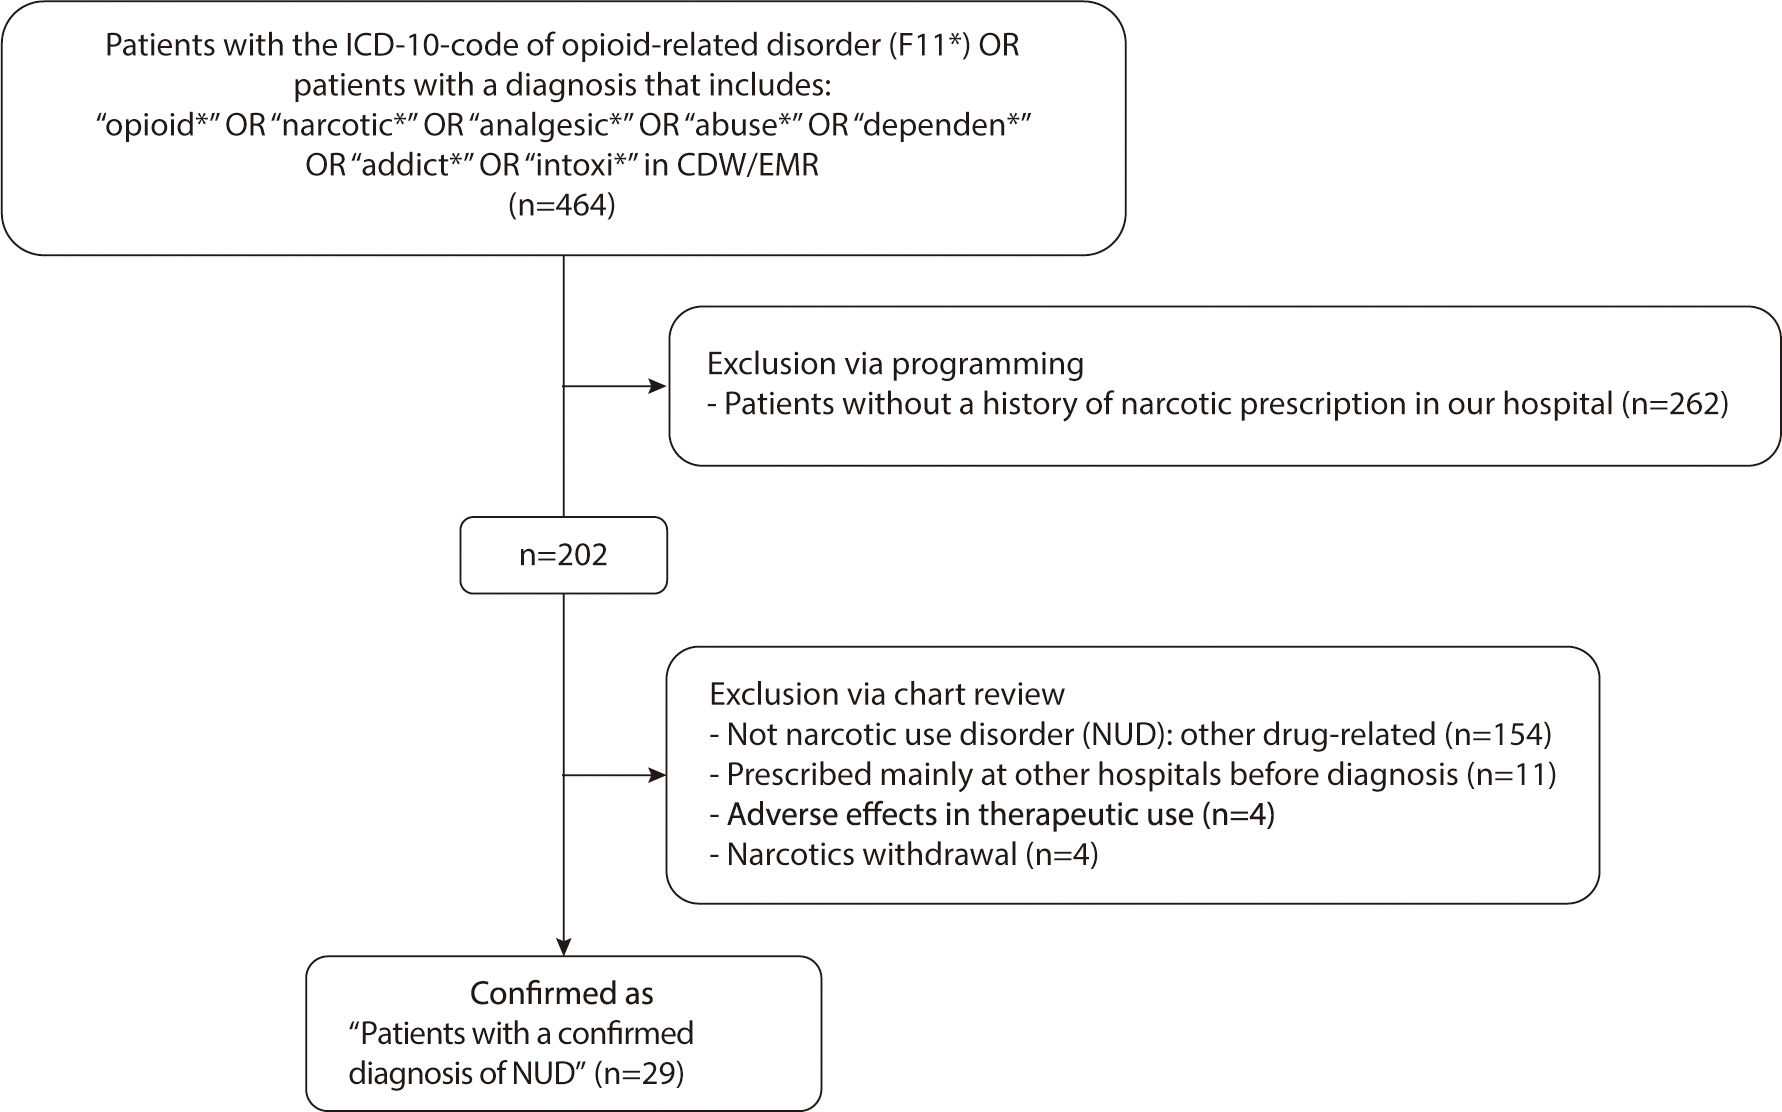
facility, were excluded. Two physicians reviewed the electronic medical record
charts to confirm the accuracy of the diagnoses (
Fig. 2). Any prescriptions issued to these patients after their NUD
diagnosis were omitted from the analysis.
Fig. 2.
Flowchart of patient screening and enrollment. ICD, International
Classification of Diseases; CDW, clinical data warehouse; EMR,
electronic medical records.

We also analyzed the optimal cut-off values, sensitivity, and specificity of
other high-risk NUD indexes (such as the PDMP monitoring categories) and their
combinations to confirm the effectiveness of the wt-MEDD score. To determine
whether the differences in sensitivity and specificity between the wt-MEDD score
and other indexes were statistically significant, the McNemar test was
performed.
We observed the time points at which the cut-off values of the wt-MEDD score and
other NUD high-risk indexes were reached, as well as the time points at which
NUD was diagnosed by a doctor in a patient case. This investigation aimed to
determine whether the wt-MEDD score cut-off value could be used to identify NUD
earlier. The paired t-test was employed to compare the mean time from the first
prescription of narcotics to the point of reaching the wt-MEDD score cut-off
value and the subsequent NUD diagnosis by doctors.
Measurements
We calculated the activity of each narcotic based on its mode of
administration—tablet, patch, or injection. The table included
information on the MME conversion factor, derived from PDMP supplements [
15]. The MEDD is calculated by multiplying
the MME conversion factor by the daily dose. When MME conversion factor
information for a specific drug was not available, we estimated it from the
relevant literature [
16].
Among the five types of downloaded tables, the narcotic prescription table
included information such as the name of the prescribed drug, the date of
prescription, the number of days prescribed, and the MEDD (
Supplement 1). To
calculate the overlapping MEDD for a specific intake date, a new table was
created. This table transformed each intake date for a patient into individual
rows—not just the prescription dates—by reformatting the data from
the prescription table (
Supplement 2).
A 3-month interval was established as the measurement period for the time-series
analysis, specifically January-March, April-June, July-September, and
October-December. The total number of prescriptions issued during each 3-month
period was calculated. To analyze temporal changes in MEDD per patient, the
highest MEDD recorded in each 3-month interval was identified and compared with
the highest MEDDs from the other intervals.


 PDF
PDF Citation
 Print
Print


 XML Download