Journal List > Ann Rehabil Med > v.48(5) > 1516088838

Kim, Kim, Kim, Park, and Lee: Change in Plantar Pressure and Plain Radiography in Pediatric Flexible Flatfoot: A Retrospective Cohort Study

Abstract

Objective

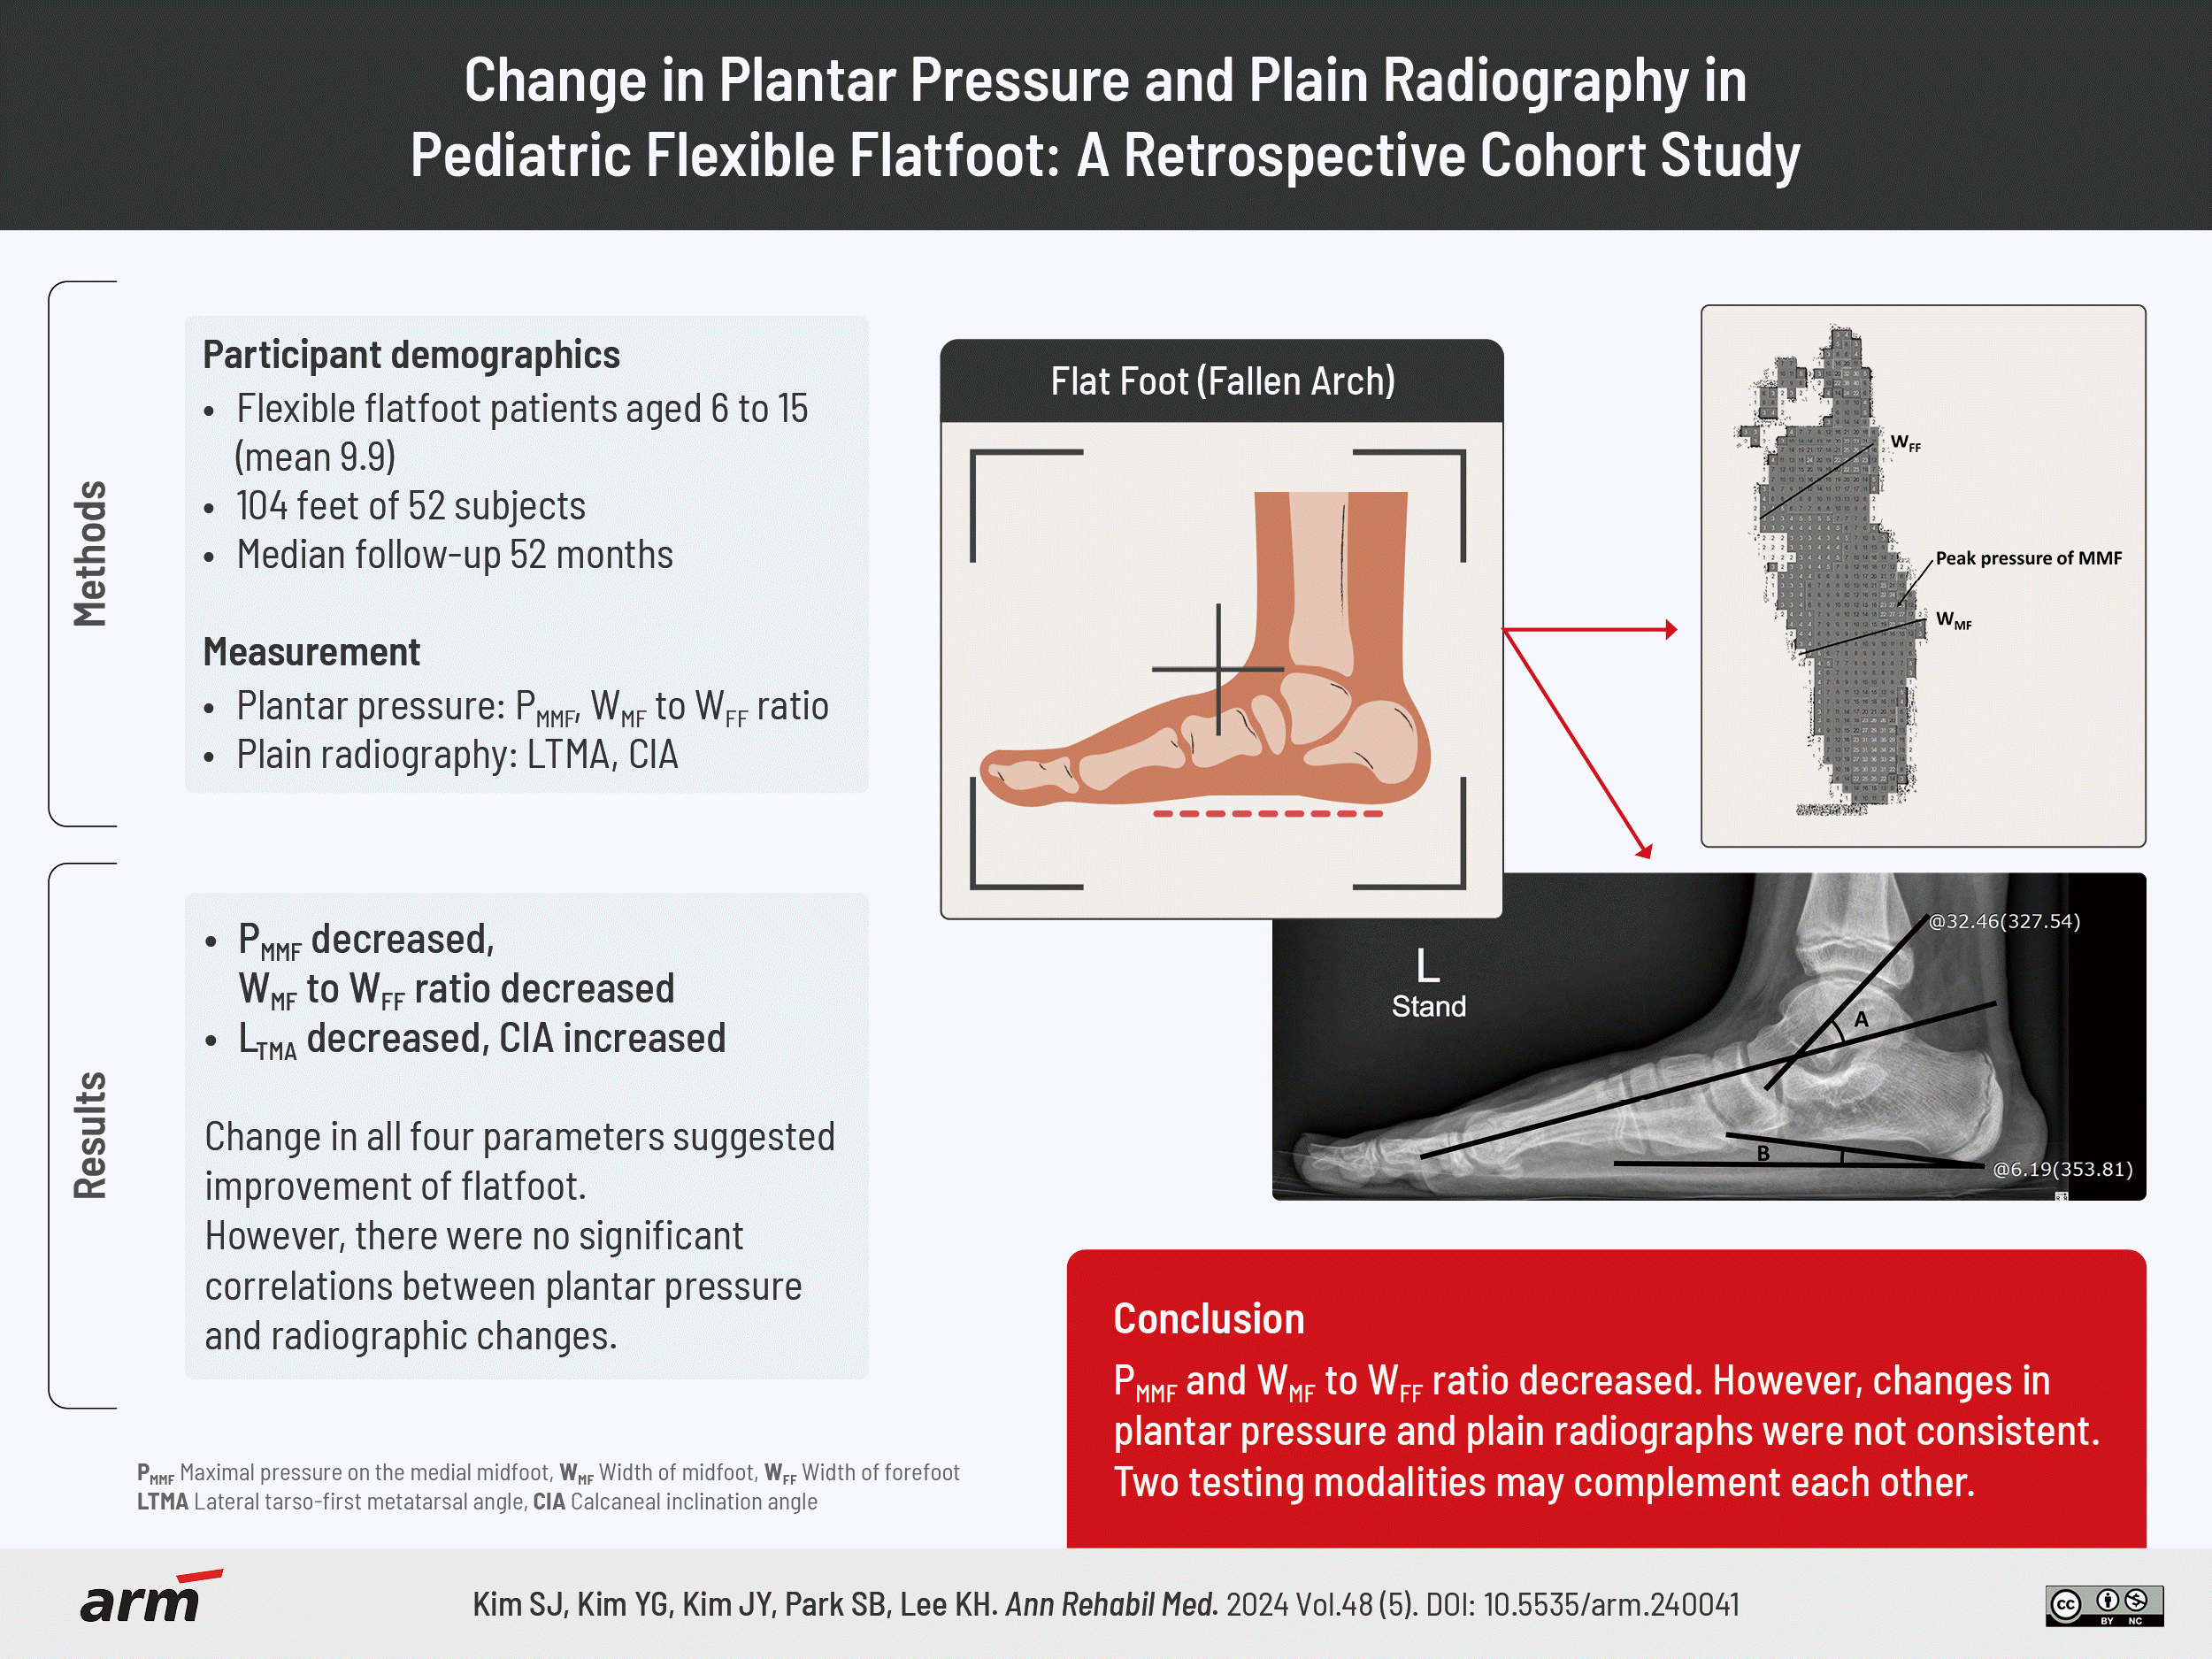
To investigate longitudinal changes in plantar pressure examinations and plain radiographs and to assess the correlations between these two modalities in pediatric patients with flexible flatfoot (FFF).

Methods

Pediatric patients diagnosed with FFF were analyzed in this retrospective cohort study. Medical records were reviewed to collect data on plain radiographs and plantar pressure examinations. Changes in radiographic angles and plantar pressure parameters were analyzed over a follow-up period exceeding 1 year. Statistical analyses included paired t-test, Wilcoxon signed rank test, and Spearman’s correlation analysis.

Results

A total of 52 subjects was included in the plantar pressure analysis, with a mean age of 9.9 years at the first visit and a median follow-up duration of 52 months. The lateral tarso-first metatarsal angle decreased by 1.3° (p<0.001) and calcaneal inclination angle increased by 2.5° (p<0.001) in these patients. The percentage value of midfoot width (WMF) divided by forefoot width (WFF) decreased by an average of 9.8% p (p<0.001), and the maximal pressure on the medial midfoot (MMF) decreased by 1.6 N/cm2 (p<0.001). However, no correlations were found between plantar pressure and radiographic changes.

Conclusion

During follow-up of patients with FFF, the maximal pressure on the MMF and the ratio of WMF to WFF decreased in successive plantar pressure examinations. Changes observed in plantar pressure and plain radiographs were not consistent, indicating that these two testing modalities can complement each other.

GRAPHICAL ABSTRACT

INTRODUCTION

Flatfoot is a prevalent condition among pediatric populations and is not inherently pathological [1,2]. In previous studies, flatfoot was more common in boys than girls, occurring in 18.5% of 11-year-old children in South Korea [1,3]. Flatfoot can be classified into two types: rigid and flexible. The flexible type predominates among children. Although the flexible type predominates among children, its pathophysiological mechanism remains uncertain, with proposed hypotheses including subtalar joint hypermobility and muscle weakness [4]. Flexible flatfoot (FFF) typically resolves during normal growth. However, instances with persistent uncomfortable symptoms such as pain or in which normal arch development fails to manifest during maturation warrant consideration for therapeutic intervention [5]. The efficacy of insoles in FFF has been a subject of debate. In several studies, pediatric patients with FFF were followed using plain radiographs to assess the effectiveness of corrective shoes. In those studies, no significant differences were observed compared with control groups [6,7]. However, corrective foot orthoses are widely used in clinical practice due to their low risk of side effects, provision of pain reduction, and biomechanical benefits, including correcting bone alignment and relieving strain on ankle muscles [8-13].
Plain radiographs are commonly used in clinical practice to assess FFF in pediatric patients. There are several studies documenting the natural trajectory of FFF in pediatric populations, and significant improvements were observed in talonavicular coverage angle, anteroposterior tarso-first metatarsal angle, and lateral tarso-first metatarsal angle (LTMA) during follow-up [14,15]. Plantar pressure examination technology is increasingly widespread, but the understanding of longitudinal changes in plantar pressure remains limited. Although several studies [16-18] have investigated the use of plantar pressure in evaluating FFF patients, most have been experimental, and large-scale, long-term data on pressure changes remain limited. The cross-sectional relationship between these two diagnostic modalities has been investigated in some studies [16,17]. However, knowledge regarding their longitudinal correlation over extended follow-up periods is lacking. Elucidating the correlation between changes observed in these two diagnostic assessments could provide valuable insights for guiding clinical strategies, particularly when selecting diagnostic tests during patient monitoring.
We investigated pediatric patients diagnosed with FFF in the present retrospective cohort study. Changes in plantar pressure examination and lateral plain radiography over the follow-up duration were examined to identify correlations between changes detected by these two diagnostic modalities.

METHODS

This retrospective cohort study was approved by the Institutional Review Board (IRB) of Hanyang University Seoul Hospital (IRB confirmation No. 2022-06-030), with a waiver of informed consent granted. We reviewed past medical records for visit dates, plain lateral radiographs, and plantar pressure examination results.

Participants

Data were obtained from patients aged 6–15 years [18,19] who visited our clinic and were diagnosed with idiopathic FFF between January 2003 and February 2022. We included patients with records of at least two plantar pressure exams over a follow-up period exceeding one year. The follow-up period was defined based on the timing of examinations rather than timing of visits. Diagnosis of FFF was based on comprehensive evaluations including physical examinations for medial longitudinal arch collapse and hindfoot valgus, plain radiographs, and plantar pressure assessments. Patients with secondary flatfoot or who were already using corrective shoes or insoles at their first visit were excluded from the study. All patients included in this study were prescribed customized therapeutic insoles with medial longitudinal arch support and a medial heel wedge at our clinic for reasons such as pain, lack of improvement, or parental request.

Measurements

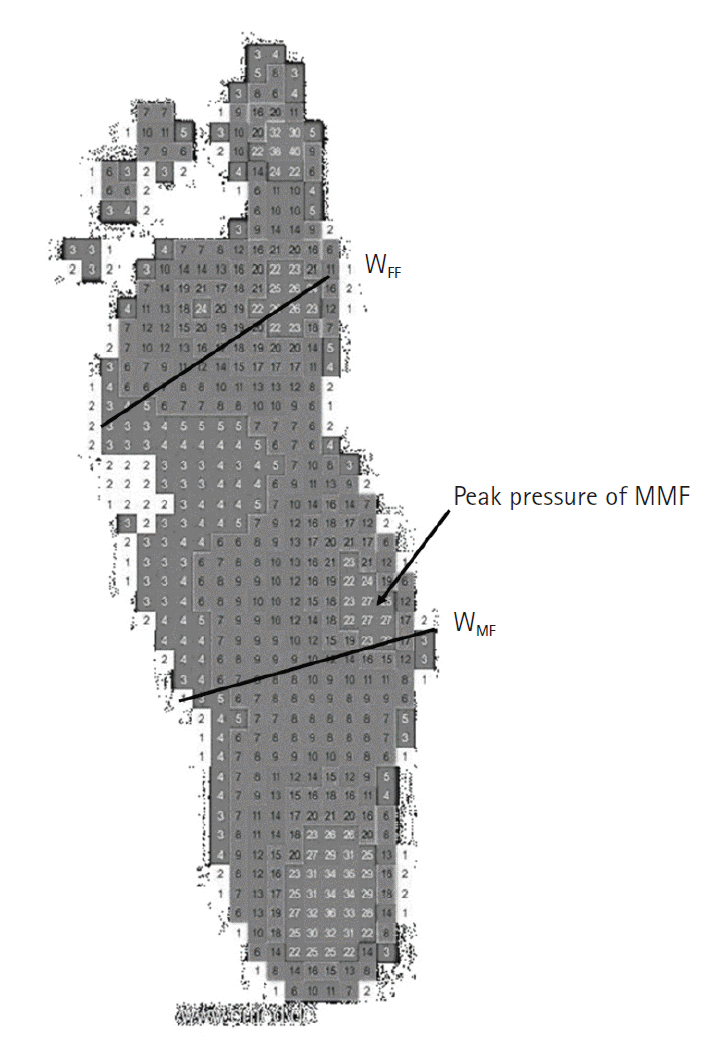
Plantar pressure examinations were conducted using the emed® (novel GmbH) to measure both the shape of the footprint on the ground and the pressure applied to each grid. To assess dynamic plantar pressure during midgait, subjects took at least three steps before and after stepping onto the platform. They were instructed to walk at a natural, comfortable pace without specific speed constraints. To ensure consistent results, a minimum of three trials was conducted per subject. Any trials in which the subject altered their speed or stride unnaturally were excluded [20]. We measured the ratio of maximal width of the midfoot (WMF) to width of the forefoot (WFF) and the peak pressure of the medial midfoot (MMF) using a pedobarograph. First, the long axis was drawn as the line passing through the origin of the second toe and the peak pressure point of the heel. The distance between the origin of the second toe and the tip of the heel was divided into three equal parts, with the middle section defined as the midfoot. The WMF was defined as the longest line drawn perpendicular to the long axis, and WFF was the distance between the two lines connecting the first and fifth metatarsal heads at the intersection of the foot contour. The peak pressure of the MMF was identified as the point of highest pressure medial to the long axis within the midfoot region (Fig. 1).
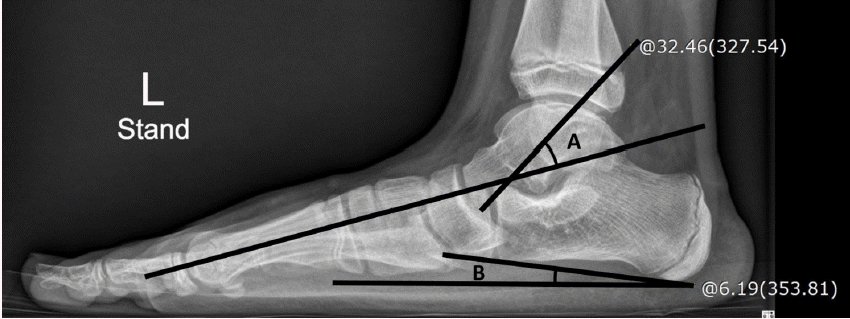
Plain radiographs were obtained in a weight-bearing state with both lower extremities extended in a neutral position. The LTMA and calcaneal inclination angle (CIA) were measured using the PACS (Picture Archiving and Communication System) program (INFINITT Healthcare; Fig. 2). The LTMA was defined as the angle between the long axis of the talus and that of the first metatarsus. The CIA was measured as the angle between a line drawn along the plantar surface of the calcaneus and the transverse plane [21,22]. The LTMA was negative when the first metatarsal bone was flexed dorsally relative to the talus axis, a finding consistent with FFF. To ensure consistency, a single rehabilitation resident performed all measurements. Previous studies have shown that LTMA and CIA exhibit strong inter-rater and intra-rater measurement reliability [21-23]. Reliability tests were performed by calculating intra-rater correlation coefficients (ICCs) using 20 randomly selected samples, with measurements performed at least two weeks apart to avoid any bias.

Outcomes

The primary outcome was the changes in both the plantar pressure test and the plain radiograph. In the plantar pressure examination, we measured the maximal WMF-to-WFF ratio (WMF:WFF) and peak pressure in the MMF. In plain radiographs, changes in LTMA and the CIA were evaluated. All indicator values were measured at both the initial and final examinations for comparison. Changes were calculated by subtracting the initial values from the final values. As a secondary outcome, we assessed the correlations between changes in plantar pressure and radiographic findings in patients who had undergone at least two lateral plantar radiographs. Radiographs were considered valid only if obtained within one year of the corresponding plantar pressure test date.

Statistical analysis

Data from the first and the last examinations were compared for each patient. The normality of each variable was assessed using the Kolmogorov-Smirnov test. The peak pressures of MMF and WMF:WFF measured from plantar pressure had non-parametric distributions, whereas the LTMA and CIA from plain radiographs followed parametric distributions. Based on our results, pre-post comparisons were conducted using either the paired t-test for parametric data or the Wilcoxon signed ranks test for non-parametric data. Correlation analysis was performed using Pearson’s correlation for parametric variables and Spearman’s correlation for non-parametric variables. Unless stated otherwise, statistical results are expressed as mean±standard deviation with statistical significance set at p-value<0.05. Statistical analysis was performed using IBM SPSS statistics ver. 22 (IBM Corp.)

RESULTS

We obtained plantar pressure examination data in 104 feet of 52 individuals, of whom 25 had corresponding radiographic data available for analysis. The demographic characteristics of the 52 subjects in the plantar pressure analysis included a mean age of 9.9±2.6 years at the first visit, a follow-up duration of 73.9±53.2 months (median of 52 months), and 42 males (80.8%). For the subset of 25 subjects involved in the correlation analysis between plantar pressure and radiographic findings, the mean age at the first visit was 10.7±2.7 years. And there was a follow-up duration of 102.2±54.8 months (median of 111 months) between the first and last plantar pressure exams (Table 1).
The peak pressure on the MMF and WMF:WFF decreased and LTMA and CIA increased, indicating improvement of flatfoot (Table 2). Peak pressure of the MMF decreased in 59 feet (56.7%), remained unchanged in 15 (14.4%), and increased in 30 (28.8%). Identical measurements at the initial and last follow-up examinations were classified as unchanged. The measurement equipment used in the study has single-digit pressure measurement accuracy. The WMF:WFF significantly decreased in 70 feet (67.3%), was maintained in 4 (3.8%), and increased in 30 (28.8%).
The correlations among the four measured parameters were evaluated as secondary outcomes. Simple correlation analysis showed no significant relationship between changes in plantar pressure and plain radiographic findings. However, a significant correlation was observed for the two plantar pressure indices with the peak pressure of the MMF and the WMF:WFF ratio (Table 3). Given the influence of age on the progression of flatfoot [1,15,24], a partial correlation analysis was conducted, adjusting for age and follow-up duration. This analysis revealed no significant correlations between any of the parameter pairs (Table 4). Both LTMA and CIA had ICC values exceeding 0.9, reflecting excellent reliability.

DISCUSSION

Throughout the follow-up period, reductions were observed in the maximal pressure on the MMF and the WMF:WFF, along with increases in the LTMA and CIA. However, significant correlations were not found between indicators of plantar pressure and variables on simple radiography.

Plantar pressure

The medial concentration of plantar pressure in flatfoot patients was described in a previous study [25]. The decrease in maximum pressure on the MMF was significant in the subject demographics in the present study. With an average age of 10 years at the initial visit and a median follow-up period of 51 months, an anticipated increase in body weight over time underscores the importance of this finding. The observed decrease in pressure at the maximum point despite the expected increase in overall body weight indicates potential structural or functional improvements in foot biomechanics. In a previous study [26], notable changes were not observed in the average midfoot pressure or the ratio of midfoot pressure to total foot pressure over a mean follow-up period of 15 months. However, in the present study, we prioritized the identification of the region with the highest pressure in the MMF rather than assessing average pressure. This distinction is crucial because, even if the average midfoot pressure remains modest, other regions with focused pressure may experience discomfort or symptomatic manifestations. However, further empirical studies are needed to determine pressure thresholds that correlate with symptomatic presentation or prognostic outcomes in flatfoot patients. Furthermore, the Chippaux–Smirak index has low sensitivity for flatfoot [27]. In the present study, we focused on the maximum length of the midfoot instead of the minimum length to enhance sensitivity in identifying changes of test results during follow-up examinations. However, our results showed a degree of change comparable with previous studies utilizing the Chippaux–Smirak index [9]. The use of length ratios offers the advantage of broad clinical applicability because it circumvents the necessity for specialized pressure testing equipment.

Simple radiograph

In a previous study [15] examining the radiological progression of flatfoot, decrease in the LTMA was noted and the CIA remained unchanged. In another study [6] that included 31 individuals 10–11 years of age and an average follow-up period of 4 years with demographics similar to those in the present study, significant reductions in both the LTMA and the CIA were observed. The amount of change observed was also comparable to that in the present investigation. However, critical evaluation of the clinical significance of a 1°–3° alteration in angle is imperative. The LTMA and CIA are known to have good interobserver and intraobserver reliability [21-23]. However, the minimal clinically important difference (MCID) for these measurements has not yet been established. Additionally, studies remain inconclusive regarding LTMA and CIA cut-off values that reliably differentiate between symptomatic and asymptomatic flatfoot. A study of 28 young male soldiers [28] found mean LTMA values of 13.0 in symptomatic feet and 8.0 in asymptomatic feet, a significant difference. The mean CIA values were 10.8 and 12.5, respectively, also a significant difference. In contrast, another study of 135 flatfoot patients with an average age of 11 years [29], found no significant differences in LTMA and CIA between asymptomatic feet and symptomatic feet when treated conservatively. However, in patients who eventually required surgery, LTMA and CIA showed significant differences compared to those who did not need surgery. When the angle is extreme, symptoms are likely to be severe. However, due to the lack of consensus on a standard cutoff value or an MCID to predict symptom changes, clinicians should approach the subject with caution. In a study of 300 normal young adult Korean men [30], the reference value of LTMA was 0°±6.9°, and that of CIA was 23.9°±5°.

Correlations between plantar pressure and simple radiographs

There is limited knowledge about the longitudinal follow-up of flatfoot patients, particularly regarding the correlations between plantar pressure patterns and radiographic changes. In a cross-sectional study [17], associations were reported among MMF pressure, the LTMA, and the CIA, which is intuitively reasonable. However, the correlations between plantar pressure dynamics and radiographic changes over long-term follow-up were not significant in the present study. This indicates that dynamic biomechanical characteristics elucidated through plantar pressure analysis, specifically the distribution of pressure between the foot and the ground, cannot be inferred only from the osseous alignment shown in simple radiographs. The changes in angles measured on plain radiographs, typically 1°–3°, prompt questions regarding clinical significance, contrasting with more significant changes observed in plantar pressure examinations. Consequently, integrating plantar pressure examinations with traditional radiographic assessment offers a more comprehensive understanding of patient condition, providing objective insights into the dynamic functional aspects of flatfoot pathology.

Limitations

There are several limitations in this study. First, despite leveraging a longitudinal database spanning two decades, data were obtainable for only 50 individuals. However, relative to analogous investigations in the literature, this sample size is comparatively robust. Second, the generalizability of the study findings to the broader population of flatfoot patients may be limited. We included pediatric patients with FFF who had a follow-up duration longer than 12 months and including plantar pressure examination. All patients in this study received therapeutic insoles as part of their treatment, though the specific reasons for these prescriptions were not documented. The extended follow-up period and consistent use of insoles suggest that the study population may represent a more severe cohort of FFF patients compared to the general FFF population. Nonetheless, given the high prevalence of flatfoot among children and the spontaneous resolution observed in many cases without intervention, the findings of this study remain clinically significant. Third, total pressure and body weight were not accounted for when analyzing the pressure of the MMF. Since MMF pressure is influenced by body weight [1,14], it would have been ideal to normalize this value by dividing it by total pressure or body weight. However, due to incomplete data, particularly from older records with poor data storage conditions, these parameters were often unavailable. As an alternative, we focused on the change in pressure over time. A reduction in absolute pressure was observed during follow-up, which is a significant finding considering the age range of the participants, where body weight typically remains stable or increases over time. Last, not all patients underwent plantar pressure examination and radiographic evaluation on the same day. Discrepancies in the timing of these examinations and follow-up durations occurred due to various clinical circumstances including laboratory or patient scheduling conflicts. In some cases, both examinations were completed at early visits, but only plain radiographs were used for long-term follow-up as FFF gradually improved. To minimize these discrepancies, we only considered radiographs obtained within one year of the plantar pressure test. Consequently, the average difference in test dates between the two exams was 2.8 months. For reference, one study [15] reported that LTMA improved by 0.7 degrees per year in patients younger than 15 years with FFF.

Conclusions

Pediatric patients with FFF who used therapeutic insoles showed improvements in both plantar pressure analysis and plain radiographs. However, distinct patterns of change in plantar pressure were found compared with plain radiographs in FFF patients, underscoring the complementary nature of the two diagnostic modalities. To achieve a comprehensive understanding of flatfoot pathology, we advocate for the integration of static assessments of bone alignment through simple radiograph and dynamic evaluations of the forces interacting between the foot and the ground using plantar pressure examination.

Notes

CONFLICTS OF INTEREST

No potential conflict of interest relevant to this article was reported.

FUNDING INFORMATION

This work was supported by Korean Drug Co.

AUTHOR CONTRIBUTION

Conceptualization: Lee KH, Kim S. Data curation: Kim YG, Kim S. Formal analysis: Kim S, Kim JY. Funding acquisition: Lee KH. Investigation: Kim S. Methodology: Lee KH, Kim S. Project administration: Lee KH. Supervision: Lee KH, Park SB. Validation: Lee KH, Park SB. Visualization: Kim JY. Writing – original draft: Kim S. Writing – review and editing: Lee KH, Park SB. Approval of final manuscript: all authors.

REFERENCES

1. Pfeiffer M, Kotz R, Ledl T, Hauser G, Sluga M. Prevalence of flat foot in preschool-aged children. Pediatrics. 2006; 118:634–9.
crossref
2. Rodriguez N, Volpe RG. Clinical diagnosis and assessment of the pediatric pes planovalgus deformity. Clin Podiatr Med Surg. 2010; 27:43–58.
crossref
3. Park GY, Lee WC. Prevalence of the flatfoot and its relation with the practice of wearing footwear of primary school children in Korea. J Korean Acad Rehabil Med. 2001; 25:867–76.
4. Harris EJ. The natural history and pathophysiology of flexible flatfoot. Clin Podiatr Med Surg. 2010; 27:1–23.
crossref
5. Harris EJ, Vanore JV, Thomas JL, Kravitz SR, Mendelson SA, Mendicino RW, Clinical Practice Guideline Pediatric Flatfoot Panel of the American College of Foot and Ankle Surgeons, et al. Diagnosis and treatment of pediatric flatfoot. J Foot Ankle Surg. 2004; 43:341–73.
crossref
6. Choi JY, Lee DJ, Kim SJ, Suh JS. Does the long-term use of medial arch support insole induce the radiographic structural changes for pediatric flexible flat foot? - a prospective comparative study. Foot Ankle Surg. 2020; 26:449–56.
crossref
7. Kanatlı U, Aktas E, Yetkin H. Do corrective shoes improve the development of the medial longitudinal arch in children with flexible flat feet? J Orthop Sci. 2016; 21:662–6.
crossref
8. Cho DJ, Ahn SY, Bok SK. Effect of foot orthoses in children with symptomatic flexible flatfoot based on ultrasonography of the ankle invertor and evertor muscles. Ann Rehabil Med. 2021; 45:459–70.
crossref
9. Chen KC, Chen YC, Yeh CJ, Hsieh CL, Wang CH. The effect of insoles on symptomatic flatfoot in preschool-aged children: a prospective 1-year follow-up study. Medicine (Baltimore). 2019; 98:e17074.
10. Bok SK, Kim BO, Lim JH, Ahn SY. Effects of custom-made rigid foot orthosis on pes planus in children over 6 years old. Ann Rehabil Med. 2014; 38:369–75.
crossref
11. Youn KJ, Ahn SY, Kim BO, Park IS, Bok SK. Long-term effect of rigid foot orthosis in children older than six years with flexible flat foot. Ann Rehabil Med. 2019; 43:224–9.
crossref
12. Evans AM, Rome K, Carroll M, Hawke F. Foot orthoses for treating paediatric flat feet. Cochrane Database Syst Rev. 2022; 1:CD006311.
crossref
13. Lee HJ, Lim KB, Yoo J, Yoon SW, Yun HJ, Jeong TH. Effect of custom-molded foot orthoses on foot pain and balance in children with symptomatic flexible flat feet. Ann Rehabil Med. 2015; 39:905–13.
crossref
14. Shin BJ, Lee KM, Chung CY, Sung KH, Chun DI, Hong CH, et al. Analysis of factors influencing improvement of idiopathic flatfoot. Medicine (Baltimore). 2021; 100:e26894.
crossref
15. Park MS, Kwon SS, Lee SY, Lee KM, Kim TG, Chung CY. Spontaneous improvement of radiographic indices for idiopathic planovalgus with age. J Bone Joint Surg Am. 2013; 95:e193(1-8).
crossref
16. Seol YJ, Jung ST, Yang HK, Lee KB, Oh CS, Jung YJ, et al. Diagnostic availability of pedobarography and correlation of radiographic and pedobarographic measurements in pediatric flexible flatfoot. J Korean Orthop Assoc. 2014; 49:366–73.
crossref
17. Kadhim M, Holmes L Jr, Miller F. Correlation of radiographic and pedobarograph measurements in planovalgus foot deformity. Gait Posture. 2012; 36:177–81.
crossref
18. Hennig EM, Staats A, Rosenbaum D. Plantar pressure distribution patterns of young school children in comparison to adults. Foot Ankle Int. 1994; 15:35–40.
crossref
19. Onodera AN, Sacco IC, Morioka EH, Souza PS, de Sá MR, Amadio AC. What is the best method for child longitudinal plantar arch assessment and when does arch maturation occur? Foot (Edinb). 2008; 18:142–9.
crossref
20. Miller CA, Verstraete MC. Determination of the step duration of gait initiation using a mechanical energy analysis. J Biomech. 1996; 29:1195–9.
crossref
21. Yildiz K, Cetin T. Interobserver reliability in the radiological evaluation of flatfoot (pes planus) deformity: a cross-sectional study. J Foot Ankle Surg. 2022; 61:1065–70.
crossref
22. Younger AS, Sawatzky B, Dryden P. Radiographic assessment of adult flatfoot. Foot Ankle Int. 2005; 26:820–5.
crossref
23. Bock P, Pittermann M, Chraim M, Rois S. The inter- and intraobserver reliability for the radiological parameters of flatfoot, before and after surgery. Bone Joint J. 2018; 100-B:596–602.
crossref
24. Chen KC, Tung LC, Yeh CJ, Yang JF, Kuo JF, Wang CH. Change in flatfoot of preschool-aged children: a 1-year follow-up study. Eur J Pediatr. 2013; 172:255–60.
crossref
25. Lee JS, Kim KB, Jeong JO, Kwon NY, Jeong SM. Correlation of foot posture index with plantar pressure and radiographic measurements in pediatric flatfoot. Ann Rehabil Med. 2015; 39:10–7.
crossref
26. Lee SW, Choi JH, Kwon HJ, Song KS. Effect of pressure based customized 3-dimensional printing insole in pediatric flexible flat foot patients. J Korean Foot Ankle Soc. 2020; 24:113–9.
crossref
27. Paecharoen S, Arunakul M, Tantivangphaisal N. Diagnostic accuracy of harris imprint index, chippaux-smirak index, staheli index compared with talar-first metatarsal angle for screening arch of foot. Ann Rehabil Med. 2023; 47:222–7.
crossref
28. Pehlivan O, Cilli F, Mahirogullari M, Karabudak O, Koksal O. Radiographic correlation of symptomatic and asymptomatic flexible flatfoot in young male adults. Int Orthop. 2009; 33:447–50.
crossref
29. Moraleda L, Mubarak SJ. Flexible flatfoot: differences in the relative alignment of each segment of the foot between symptomatic and asymptomatic patients. J Pediatr Orthop. 2011; 31:421–8.
30. Lee YK, Yim SJ, Lee SH, Park CH, Lee SH. The talus-1st metatarsal angle, the talo-horizontal angle and calcaneal pitch angle of young men in Korea. J Korean Foot Ankle Surg. 2010; 14:161–4.

Fig. 1.
Indices measured in plantar pressure examination. WFF, width of the forefoot; MMF, medial midfoot; WMF, width of the midfoot.
arm-240041f1.tif
Fig. 2.
Radiographic measurements in plain lateral radiographs. A, lateral tarso-first metatarsal angle; B, calcaneal inclination angle.
arm-240041f2.tif
arm-240041f3.tif
Table 1.
Demographics of participants
Characteristic Value
Data for pre- and post-comparison of plantar pressure (n=52)
 Age at first examination (yr) 9.9±2.6
 Sex, male 42 (80.8)
 Follow-up duration of plantar pressure (mo) 73.9±53.2
Data for comparison of change in plantar pressure and plain radiograph (n=25)
 Age at first examination (yr) 10.7±2.7
 Sex, male 21 (84.0)
 Follow-up duration of plantar pressure (mo) 102.2±54.8
 Follow-up duration of plain radiograph (mo) 101.8±55.7
 Difference between follow-up duration of plantar pressure and plain radiograph (mo) 2.8±4.6

Values are presented as mean±standard deviation or number (%).

Table 2.
Changes in plantar pressure and lateral plain radiography indices
Initial visit Last visit Delta p-value
Peak pressure of MMF (N/cm2) 8.7±4.1 7.1±3.3 -1.6±4.3 p<0.001a)
WMF:WFF (%) 71.6±13.2 61.8±17.5 -9.8±15.4 p<0.001a)
LTMA (°) -18.4±9.1 -17.1±7.7  1.3±7.1 p<0.001b)
CIA (°) 13.4±5.9 15.9±4.7 2.5±4.0 p<0.001b)

Values are presented as mean±standard deviation.

MMF, medial midfoot; WMF, width of the midfoot; WFF, width of the forefoot; LTMA, lateral tarso-first metatarsal angle; CIA, calcaneal inclination angle.

a)Wilcoxon signed rank test.

b)Paired t-test.

Table 3.
Correlations between plantar pressure and plain radiographs
ΔLTMA ΔCIA ΔPeak pressure of the MMF ΔWMF:WFF
ΔLTMA
ΔCIA -0.150 (0.299)
ΔPeak pressure of the MMF 0.198 (0.168) 0.104 (0.471)
ΔWMF:WFF -0.067 (0.644) -0.49 (0.734) 0.317 (0.025)*

Values are presented as correlation coefficient (p-value).

Statistical analysis: Spearman’s correlation test was used for pairs including non-parametric variables (peak pressure of the MMF, WMF, and WFF). Pearson’s correlation test was used to compare LTMA and CIA.

LTMA, lateral tarso-first metatarsal angle; CIA, calcaneal inclination angle; MMF, medial midfoot; WMF, width of the midfoot; WFF, width of the forefoot.

*p<0.05.

Table 4.
Partial correlation analysis between change in plantar pressure and plain radiographs controlling for age and follow-up duration
ΔLTMA ΔCIA ΔPeak pressure of the MMF ΔWMF:WFF
ΔLTMA
ΔCIA -0.125 (0.397)
ΔPeak pressure of the MMF 0.179 (0.222) 0.08 (0.558)
ΔWMF:WFF -0.031 (0.832) -0.021 (0.885) 0.235 (0.107)

LTMA, lateral tarso-first metatarsal angle; CIA, calcaneal inclination angle; MMF, medial midfoot; WMF, width of the midfoot; WFF, width of the forefoot.

TOOLS
Similar articles