Journal List > Endocrinol Metab > v.39(5) > 1516088778

Jung, Lee, Chung, Park, Yu, Moon, Seo, Han, and Kim: Impact of Chronic Kidney Disease and Gout on End-Stage Renal Disease in Type 2 Diabetes: Population-Based Cohort Study

Abstract

Background

We examined the impact of gout on the end-stage renal disease (ESRD) risk in patients with type 2 diabetes mellitus (T2DM) and determined whether this association differs according to chronic kidney disease (CKD) status.

Methods

Using the Korean National Health Insurance Service, this nationwide cohort study enrolled 847,884 patients with T2DM who underwent health checkups in 2009. Based on the presence of CKD (estimated glomerular filtration rate <60 mL/min/1.73 m2) and gout (two outpatient visits or one hospitalization within 5 years), patients were classified into four groups: CKDGout, CKDGout+, CKD+Gout, and CKD+Gout+. Patients with incident ESRD were followed up until December 2018.

Results

Among 847,884 patients, 11,825 (1.4%) experienced progression to ESRD. ESRD incidence increased in the following order: 0.77 per 1,000 person-years (PY) in the CKDGout group, 1.34/1,000 PY in the CKDGout+ group, 8.20/1,000 PY in the CKD+Gout group, and 23.06/1,000 PY in the CKD+Gout+ group. The presence of gout modified the ESRD risk in a status-dependent manner. Hazard ratios (HR) were 1.49 (95% confidence interval [CI], 1.32 to 1.69) and 2.24 (95% CI, 2.09 to 2.40) in patients without and with CKD, respectively, indicating a significant interaction (P<0.0001). The CKD+Gout+ group had a markedly higher risk of developing ESRD (HR, 18.9; 95% CI, 17.58 to 20.32) than the reference group (CKDGout).

Conclusion

Gout substantially enhances the risk of ESRD, even in the absence of CKD. Concurrent CKD and gout synergistically increase the risk of ESRD. Therefore, physicians should carefully screen for hyperuricemia to prevent progression to ESRD.

GRAPHICAL ABSTRACT

INTRODUCTION

Individuals with type 2 diabetes mellitus (T2DM) are at a high risk of developing diabetic kidney disease, the leading cause of end-stage renal disease (ESRD). The growing global prevalence of diabetes has contributed to an increasing prevalence of ESRD, which is estimated to be up to 10 times higher in patients with diabetes than in the general population [1,2]. ESRD is associated with high mortality, various complications, and a substantial economic burden on patients with T2DM [2]. Therefore, identifying modifiable risk factors and vulnerable patients in this high-risk population is crucial for improving public health outcomes [3,4].
Numerous cohort studies have indicated an association between gout and the increased risk of chronic kidney disease (CKD) in patients with T2DM [1,5,6]. The prevalence of gout is notably higher in patients with T2DM than in the general population, largely due to shared risk factors, such as obesity and hypertension [7,8]. Although gout inherently is a risk factor for ESRD, the extent to which the concurrent presence of CKD and gout in patients with T2DM increases the risk of ESRD has not been explored in previous studies. Comprehensively clarifying this relationship could help identify high-risk groups for the heterogeneous progression of diabetes-related ESRD.
In the present study, we aimed to investigate the combined effect of CKD and gout on the development of ESRD among patients with T2DM using decade-long nationwide data obtained from the National Health Insurance Service (NHIS) of Korea. This approach may clarify the role of gout in ESRD progression and help identify vulnerable patients at risk of developing ESRD.

METHODS

Data sources

We obtained data from the Korean NHIS and the Health Insurance Review and Assessment databases. The Korean NHIS includes an eligibility database (including age, sex, socioeconomic variables, type of eligibility, and income level), a medical treatment database (based on the accounts submitted by medical service providers for their medical expenses), a health examination database (results of general health examinations and questionnaires on lifestyle and behavior), and a medical care institution database (types of medical care institutions, location, equipment, and number of physicians) comprising a complete set of health information pertaining to 50 million Koreans. In Korea, the NHIS is the only insurer managed by the government, and 97% of the Korean population subscribes to this database. The remaining 3% of the population is covered by the Medical Aid program. In addition, the total claims rate for medical expenses is 100%. Therefore, it can be assumed that only a few individuals were missing from the NHIS cohort from among the Korean population. In this retrospective cohort study, we used general health examinations and NHIS healthcare utilization data, including inpatient (diagnoses and procedures received) and outpatient records [9].

Study population

This study enrolled 927,234 Korean individuals with T2DM, identified by International Classification of Diseases (ICD) codes E11–E14 with prescription of oral hypoglycemic agents (OHAs) or fasting blood glucose ≥126 mg/dL, who underwent at least one general health checkup between January 01, 2009 and December 31, 2009 (Supplemental Fig. S1). The following individuals were excluded from the study: (1) patients <20 years of age (n=85); (2) patients with any missing values from the general health checkup (n=41,250); (3) patients previously diagnosed with ESRD (ICD-10 codes N18-19, Z49, Z94.0, Z99.2), including those with estimated glomerular filtration rate (eGFR) <15 mL/min/1.73 m2, those who had initiated and maintained renal replacement (O7011-7020, V001, O7071-7075, V003) for >3 months, and/or those who had undergone kidney transplantation (R3280) before 2009 (n=2,416); and (4) patients who had only one outpatient visit for gout (ICD-10 codes of M10) within 5 years (n=15,701). In total, 867,782 patients were included in the final analysis. The patients were classified according to the presence of CKD and gout and followed up until the date of ESRD diagnosis or December 31, 2018.

Definition of chronic kidney disease and gout

CKD was defined as an eGFR (using the Modification of Diet in Renal Disease [MDRD] formula: eGFR=186×[creatinine]−1.154×[age]−0.203×[0.742, if female]×[1.210, if black]) of <60 mL/min/1.73 m2 [10]. Gout was defined as undergoing at least two outpatient visits or one inpatient diagnosis with ICD10 code M10 within 5 years prior to the health checkup. Based on the presence of CKD and gout, patients were classified into the following four groups: no CKD or gout (CKDGout), gout without CKD (CKDGout+), CKD without gout (CKD+Gou), and CKD and gout (CKD+Gout+).

Definition of comorbidities

Hypertension was defined as the presence of at least one claim per year for a prescription of antihypertensive agents under ICD-10-CM codes I10–I15 or systolic/diastolic blood pressure ≥140/90 mm Hg. Dyslipidemia was defined as the presence of at least one claim per year for a prescription of lipid-lowering agents under ICD-10 code E78 or a total cholesterol level ≥240 mg/dL at a general health checkup.

Demographics, anthropometric, and laboratory measurements

We collected data on various parameters at the time of enrollment, including sex, age, income, smoking status, alcohol consumption, and exercise habits. We recorded the duration of diabetes and the use of insulin and OHAs. Patients were categorized as either below or above the 25% income threshold. Based on smoking status, patients were categorized as non-smokers, ex-smokers, and current smokers. Based on alcohol consumption habits, patients were classified as non-drinkers, mild drinkers, and heavy drinkers, with heavy alcohol consumption defined as the consumption of more than 30 g of alcohol per day. Regular exercise was defined as engaging in vigorous exercise for >3 days a week or moderate-intensity activity for >5 days a week. The patients’ body mass index (BMI) was calculated as weight in kilograms divided by the square of their height in meters (kg/m²). Blood pressure was measured twice while sitting, and the average value was recorded. Additionally, venous blood samples were collected after a 12-hour overnight fast to measure serum glucose, eGFR, total cholesterol, high-density lipoprotein cholesterol, low-density lipoprotein cholesterol, and triglyceride levels.

Study outcomes and follow-up

The primary outcome was the incidence of ESRD during the follow-up period. ESRD was confirmed using ICD-10 codes (N18-19, Z49, Z94.0, Z99.2) with eGFR <15 mL/min/1.73 m2 or the initiation and maintenance of renal replacement therapy for >3 months (O7011-7020, V001, O7071-7075, V003) and/or kidney transplantation (R3280). The study population was followed up until the date of ESRD diagnosis or December 31, 2018, whichever occurred first.

Statistical analysis

Continuous and categorical variables are presented as mean±standard deviation and percentages, respectively. The clinical characteristics of the patients were compared using one-way analysis of variance (ANOVA) for continuous variables and the chi-square test for categorical variables. The incidence of ESRD was presented per 1,000 person-years. Cox proportional hazards regression analysis was conducted with a 95% confidence interval (CI) for incident ESRD based on the presence of CKD and gout, using the CKD Gout group as a reference. Adjusted hazard ratios (HRs) were calculated after adjusting for the following variables: age, sex, smoking status, alcohol consumption status, exercise, household income, BMI, hypertension, dyslipidemia, eGFR, fasting blood glucose level, insulin use, duration of diabetes, and number of OHAs.
For the subgroup analysis, we stratified the patients according to age (<65 and ≥65 years), sex (male and female), duration of T2DM (≥5 years), insulin use, and a combination of three or more OHAs. All reported P values were two-tailed, and P<0.05 was deemed statistically significant. All data analyses were performed using SAS version 9.4 (SAS Institute Inc., Cary, NC, USA) and R version 3.2.3 (http://www.Rproject.org; The R Foundation for Statistical Computing, Vienna, Austria).

Statement of ethics

The study was performed in accordance with the principles of the Declaration of Helsinki and approved by the Institutional Review Board (IRB) of Soongsil University (SSU-202003-HR-201-01). The requirement for informed consent was waived because this study was observational and included data from anonymous public databases.

Data availability

All data generated and analyzed in the current study were managed by the National Health Insurance Data Sharing Service (accessible at https://nhiss.nhis.or.kr/bd/ab/bdaba000eng.do), and these customized data are not available to the public. Researchers were required to submit their research proposals to the IRB and customized data request forms to the Health Insurance Review and Assessment Service (HIRA) committees. After the final approval from the HIRA committee, only authorized researchers could access the customized database through desktops supplied by the HIRA Service, and only de-identified data were available for a limited period.

RESULTS

Baseline characteristics

Table 1 presents the baseline characteristics of included patients based on CKD and gout status. Individuals with gout, irrespective of their CKD status, were predominantly male and had a higher incidence of comorbidities such as hypertension and dyslipidemia than those without gout. Additionally, individuals with gout had a higher BMI, were more likely to engage in heavy alcohol consumption and smoking, and used more antidiabetic medications, including insulin, than those without gout. The presence of gout was associated with a longer duration of diabetes. Patients with both CKD and gout tended to be older and had a lower eGFR than those without CKD or gout. Regarding health-related habits, smoking habits varied, with a higher percentage of non-smokers observed among patients with CKD than among those without CKD. Patients with a longer duration of diabetes (≥5 years) were more likely to have CKD and gout, with the highest percentage observed in the CKD+ Gout+ group (49.4%).

Risk of ESRD based on the CKD and gout status

The incidence rate (IR) of ESRD varied significantly across the study groups, with the lowest IR observed in the group without CKD or gout (CKD Gout group, IR 0.77 per 1,000 person-years) and the highest detected in the group with both conditions (CKD+ Gout+ group, IR 23.06 per 1,000 person-years) (Table 2). Patients in the CKD Gout+ and CKD+ Gout groups had a higher IR of ESRD than patients in the reference group (CKD Gout). After adjusting for various factors in model 2, the risk of incident ESRD increased significantly in the CKD Gout+ (HR, 1.49; 95% CI, 1.32 to 1.69), CKD+ Gout (HR, 8.45; 95% CI, 8.11 to 8.8), and CKD+ Gout+ (HR, 18.9; 95% CI, 17.58 to 20.32) groups. Even in patients without CKD, the presence of gout was associated with a 1.49-fold higher risk of ESRD. Conversely, among T2DM patients with CKD, those with gout (CKD+ Gout+) had more than twice the risk of ESRD than those with CKD alone (CKD+ Gout), with an HR of 2.24 (Supplemental Table S1).
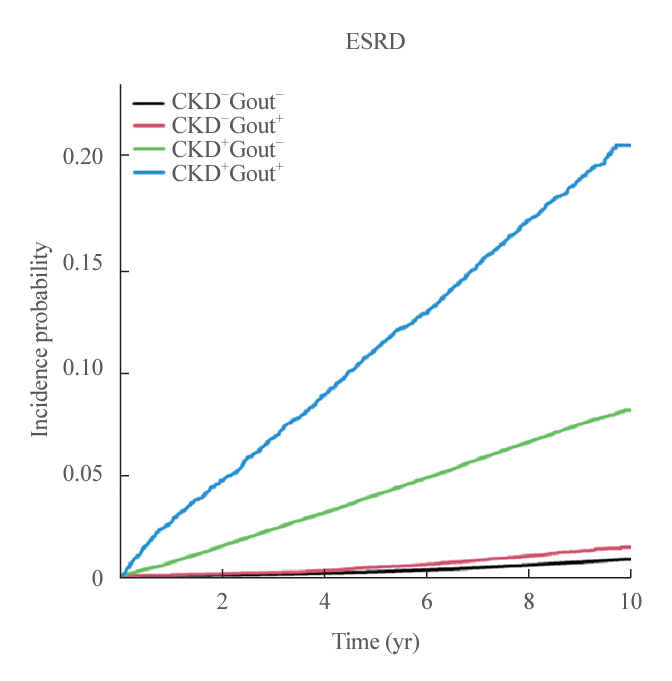
The cumulative incidence of ESRD across patient subgroups is depicted using Kaplan–Meier curves (Fig. 1). Kaplan–Meier curves revealed a stratified risk of ESRD development over the 10-year study period. Individuals in the CKD Gout group exhibited the lowest incidence of ESRD and served as the reference group. Patients with gout but without CKD (CKD Gout+) had a higher incidence of ESRD than those in the reference group. Notably, the risk increased substantially in the presence of CKD. Patients in the CKD+ Gout group exhibited an even steeper increase in the incidence of ESRD, with the most pronounced elevation observed in individuals with CKD+ Gout+, which was significantly greater than that observed in the other groups (log-rank test, P<0.001).

Subgroup analysis

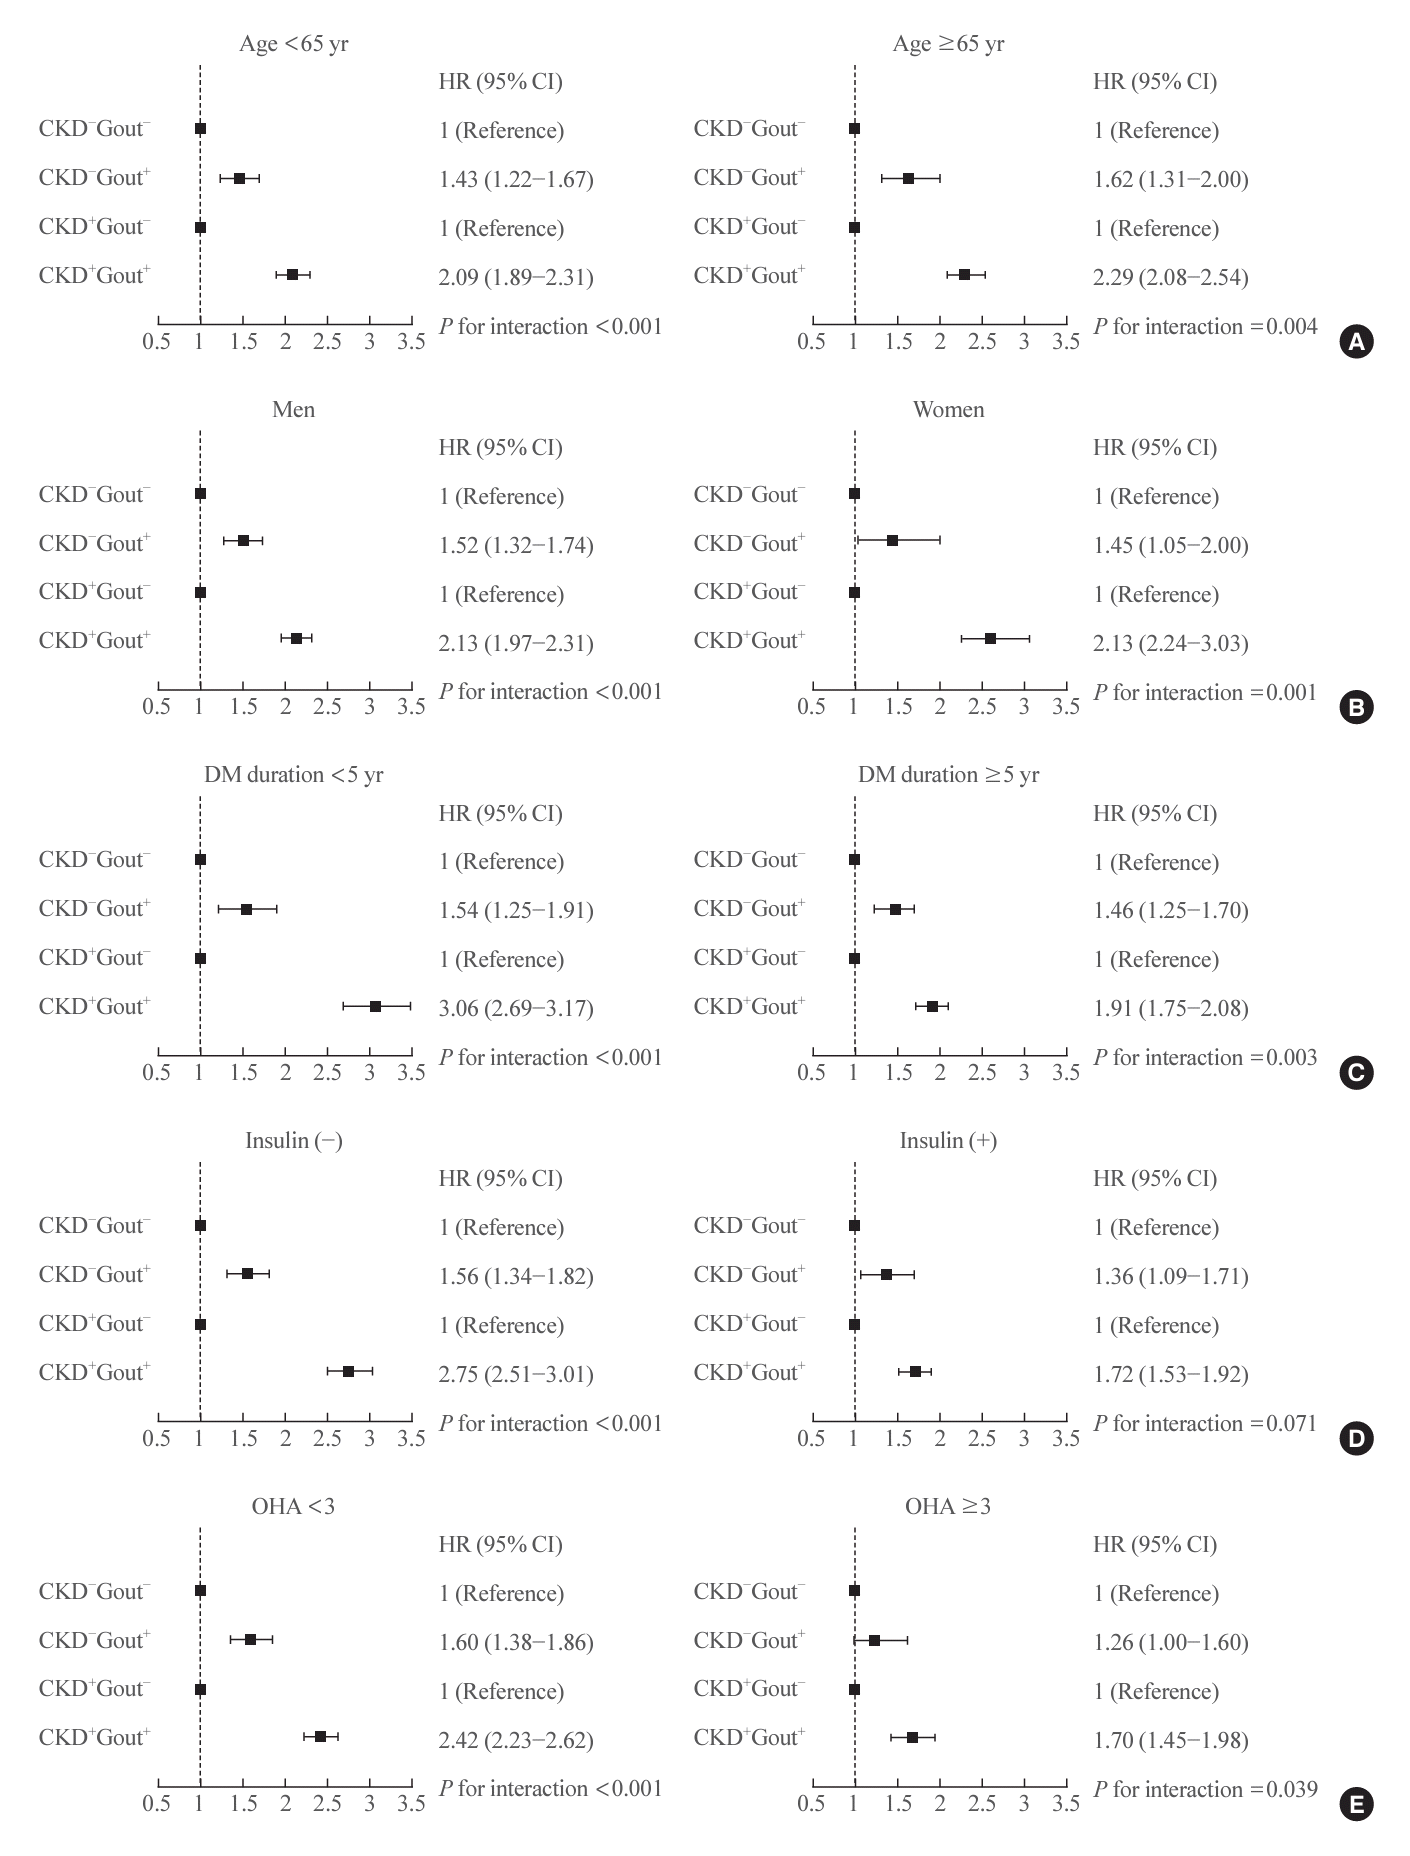
We performed a subgroup analysis to evaluate whether the highest risk for ESRD in the CKD+ Gout+ group was consistent across different age groups (<65 and ≥65 years), sex, T2DM duration (<5 and ≥5 years), insulin use, and use of three or more OHAs (Fig. 2, Supplemental Table S2).
In our analysis, the CKD+ Gout+ group had a consistently higher risk of ESRD across all subgroups than the CKD Gout group (reference group). In the CKD+ Gout+ group, the adjusted HRs were significantly increased, ranging from 12.6 to as high as 24.55 across various subgroups, as detailed in Supplemental Table S2. The significantly higher impact of gout on ESRD in the CKD group than that in the non-CKD group was consistent among several subgroups, except among those who used insulin. However, the CKD+ Gout+ group had a more prominent increase in HR than the CKD Gout+ group, especially in females, patients with T2DM for less than 5 years, those not undergoing insulin therapy, and patients treated with fewer than three OHAs (Fig. 2). The impact of gout on ERSD was more pronounced in patients at risk of developing CKD with less than 5 years of T2DM duration and those not receiving insulin therapy. In patients with a shorter duration of T2DM, patients in the CKD+ Gout+ had an adjusted HR of 3.06 (95% CI, 2.69 to 3.48) when compared with those in the CKD+ Gout group. Similar findings and interactions were observed in the subgroup analysis of patients who did not use insulin and were treated with fewer than three OHAs (Fig. 2, Supplemental Table S2).

DISCUSSION

In the present study, we investigated the independent and combined effects of gout and CKD on the risk of ESRD in patients with T2DM. Our findings revealed that gout alone could considerably increase the risk of ESRD, even in the absence of CKD. Interestingly, the concurrent presence of gout and CKD enhanced the risk of ESRD substantially, as evidenced by a dramatic increase in both IR and HR (IR 23.06 per 1,000 person-years; HR, 18.9; 95% CI, 17.58 to 20.32). This synergistically increased risk of ESRD in the CKD+ Gout+ group was more prominent, especially among females, those with a shorter duration of diabetes, patients with mild diabetes who did not use insulin, and those treated with fewer OHAs.
Gout is characterized by elevated serum uric acid levels and the deposition of monosodium urate crystals in the joints. The global prevalence of gout is increasing, largely owing to the growing incidence of obesity and metabolic syndrome, both of which are consequences of unhealthy diets and lifestyles [11,12]. Hyperuricemia and gout have been associated with a rapid decline in kidney function and CKD [13,14]. Our research further extends this hypothesis by demonstrating that gout can independently increase the risk of ESRD in the absence of CKD and that the presence of both gout and CKD markedly enhances the risk of ESRD in patients with T2DM.
Although the underlying pathophysiology is complex, several mechanisms could explain our findings. CKD progression can be aggravated by the presence of concurrent gout, which functions through several mechanisms, including the inflammatory pathway via the crystalline effects of urate crystals [15], activation of the renin-angiotensin-aldosterone system [16,17], and intracellular oxidative stress through nicotinamide adenine dinucleotide phosphate (NADPH) oxidase [18]. Hyperuricemia induces renal inflammation and fibrosis by activating M1-like macrophages and tubular nuclear factor-kappa B signaling pathways, resulting in the progression of diabetic kidney disease [19,20]. In T2DM patients with coexisting CKD, the presence of gout can worsen the progression of inflammation and fibrosis via various pathways. However, further experimental studies are required to confirm this hypothesis.
The deteriorating effects of hyperuricemia may be worse in patients with T2DM and insulin resistance than in those without these conditions. Hyperuricemia can precede and contribute to insulin resistance through endothelial impairment and reduced nitric oxide availability, leading to hyperinsulinemia and subsequent insulin resistance [21,22]. Conversely, hyperinsulinemia may impair renal uric acid clearance, increase uric acid reabsorption, and enhance xanthine oxidase production, subsequently resulting in hyperuricemia [23]. This bidirectional relationship between hyperuricemia and insulin resistance may represent a common pathophysiological factor that contributes to the rapid progression of CKD to ESRD.
In the current study, we found that the risk of ESRD was markedly increased in the CKD+ Gout+ group, particularly in female patients. This finding is in line with previous reports, which demonstrated sex-related relationships between serum uric levels and target organ damage, such as cardiovascular events and renal impairment [24,25]. A possible mechanism is that serum uric acid metabolism is genetically controlled, and sex differences exist in gene function [26].
Although this study provided valuable insights, its limitations must be addressed. A primary limitation arises from the methodology used to define gout, which is based on ICD-10-CM diagnostic codes rather than serum uric acid levels, owing to the lack of data on uric acid levels in health assessments. Relying exclusively on diagnostic codes for gout can lead to the potential risk of both underestimating and overestimating the number of study participants. Based on our definition of gout, differentiating patients with asymptomatic hyperuricemia can be challenging. Another limitation of our study was the absence of detailed data, particularly regarding the history of urate-lowering medications, nonsteroidal anti-inflammatory drugs (NSAIDs), and corticosteroids used to manage gout. NSAIDs, when used for gout pain management, can contribute to the progression of ESRD, and corticosteroids may worsen hyperglycemia. Therefore, a causal relationship cannot be confirmed in terms of whether the faster decline in renal function and ESRD development in individuals with gout occur due to hyperuricemia or other factors, such as poorly controlled diabetes or medications affecting kidney function. Additionally, owing to the restricted procedures for accessing specific data related to drug prescription records in the claims database held by the NHIS, our research analysis was unable to utilize detailed information regarding drug prescriptions. Additionally, our study did not categorize patients based on their CKD stage. Although the phenotype of kidney function decline in patients with T2DM can vary, our study included only eGFR and not albuminuria. Moreover, there is a lack of information regarding the administration of sodium-glucose cotransporter-2 (SGLT2) inhibitors, which may have affected uric acid excretion in the patients included in the current study. However, based on existing literature on the prescription patterns of OHAs in Korea during the study period, SGLT2 inhibitors are not commonly prescribed because of reimbursement restrictions [27]. Baek et al. [28] reported that the annual prescription rate of SGLT2 inhibitors in patients with T2DM was <5% in 2016. Considering that SGLT2 inhibitors may affect the metabolism and excretion of uric acid, further research is required to account for the use of these medications.
Despite these limitations, this study had several strengths. To the best of our knowledge, this is the first study to demonstrate the combined effects of gout and CKD on the progression to ESRD in patients with T2DM. To date, no study has analyzed the combined effects of gout and CKD, particularly in a large cohort of patients with T2DM. This study relied on a nationwide dataset, which is the most comprehensive source of health data in South Korea. We also assessed the severity of diabetes based on the duration of diabetes, insulin therapy, and number of prescribed OHAs.
In summary, the findings of this study highlight the fact that the coexistence of gout in patients with CKD can substantially increase the risk of ESRD. Even in patients without CKD, gout alone may be a risk factor for ESRD. It is crucial that physicians screen for hyperuricemia in patients with T2DM, particularly in those who have been diagnosed with CKD or are at risk for developing CKD. In addition, the concurrent presence of CKD and gout requires increased awareness and patient education to mitigate the risk of disease progression to ESRD.

Supplementary Material

Supplemental Table S1.

Impact of Gout in the Incidence of ESRD Based on the Presence of CKD
enm-2024-2020-Supplemental-Table-S1.pdf

Supplemental Table S2.

Subgroup Analyses according to Age, Sex, Diabetes Duration, and Use of Insulin and OHAs
enm-2024-2020-Supplemental-Table-S2.pdf

Supplemental Fig. S1.

Flowchart of participant inclusion. ESRD, end-stage renal disease; CKD, chronic kidney disease.
enm-2024-2020-Supplemental-Fig-S1.pdf

Notes

CONFLICTS OF INTEREST

No potential conflict of interest relevant to this article was reported.

AUTHOR CONTRIBUTIONS

Conception or design: I.J., D.Y.L., S.M.C., J.S.M., K.H., N. H.K. Acquisition, analysis, or interpretation of data: I.J., D.Y.L., S.M.C., S.Y.P., J.H.Y., J.S.M., J.A.S., K.H., N.H.K. Drafting the work or revising: I.J., D.Y.L. Final approval of the manuscript: I.J., D.Y.L., S.M.C., S.Y.P., J.H.Y., J.S.M., J.A.S., K.H., N.H.K.

ACKNOWLEDGMENTS

This work was supported by the Bio & Medical Technology Development Program of the National Research Foundation (NRF), funded by the Korean government (MSIT) (grant numbers NRF2019M3E5D3073102 and NRF-2023R1A2C2003479). It was also supported by a grant from the National IT Industry Promotion Agency (NIPA), funded by MSIT (No. S0252-21-1001, Development of AI Precision Medical Solution [Doctor Answer 2.0]), and by a grant from the Korea Health Technology R&D Project through the Korea Health Industry Development Institute (KHIDI), funded by the Ministry of Health & Welfare, Republic of Korea (grant number H123C0679). We used data from the Korean NHIS. The authors thank the NHIS for their cooperation.
We used the National Health Information Database constructed by the Korean NHIS, and the study results do not necessarily represent the opinions of the Korean NHIS.

REFERENCES

1. Jing J, Kielstein JT, Schultheiss UT, Sitter T, Titze SI, Schaeffner ES, et al. Prevalence and correlates of gout in a large cohort of patients with chronic kidney disease: the German Chronic Kidney Disease (GCKD) study. Nephrol Dial Transplant. 2015; 30:613–21.
2. Koye DN, Magliano DJ, Nelson RG, Pavkov ME. The global epidemiology of diabetes and kidney disease. Adv Chronic Kidney Dis. 2018; 25:121–32.
crossref
3. Saran R, Robinson B, Abbott KC, Agodoa LY, Albertus P, Ayanian J, et al. US renal data system 2016 annual data report: epidemiology of kidney disease in the United States. Am J Kidney Dis. 2017; 69(3 Suppl 1):A7–8.
4. Jha V, Al-Ghamdi SM, Li G, Wu MS, Stafylas P, Retat L, et al. Global economic burden associated with chronic kidney disease: a pragmatic review of medical costs for the inside CKD research programme. Adv Ther. 2023; 40:4405–20.
crossref
5. Singh JA, Cleveland JD. Gout is associated with a higher risk of chronic renal disease in older adults: a retrospective cohort study of U.S. Medicare population. BMC Nephrol. 2019; 20:93.
crossref
6. Yu KH, Kuo CF, Luo SF, See LC, Chou IJ, Chang HC, et al. Risk of end-stage renal disease associated with gout: a nationwide population study. Arthritis Res Ther. 2012; 14:R83.
crossref
7. Liu Q, Gamble G, Pickering K, Morton S, Dalbeth N. Prevalence and clinical factors associated with gout in patients with diabetes and prediabetes. Rheumatology (Oxford). 2012; 51:757–9.
crossref
8. Suppiah R, Dissanayake A, Dalbeth N. High prevalence of gout in patients with type 2 diabetes: male sex, renal impairment, and diuretic use are major risk factors. N Z Med J. 2008; 121:43–50.
9. Song SO, Jung CH, Song YD, Park CY, Kwon HS, Cha BS, et al. Background and data configuration process of a nationwide population-based study using the Korean National Health Insurance System. Diabetes Metab J. 2014; 38:395–403.
crossref
10. Levey AS, Bosch JP, Lewis JB, Greene T, Rogers N, Roth D. A more accurate method to estimate glomerular filtration rate from serum creatinine: a new prediction equation. Modification of Diet in Renal Disease Study Group. Ann Intern Med. 1999; 130:461–70.
crossref
11. Kuo CF, Grainge MJ, Zhang W, Doherty M. Global epidemiology of gout: prevalence, incidence and risk factors. Nat Rev Rheumatol. 2015; 11:649–62.
crossref
12. Dehlin M, Jacobsson L, Roddy E. Global epidemiology of gout: prevalence, incidence, treatment patterns and risk factors. Nat Rev Rheumatol. 2020; 16:380–90.
crossref
13. Tsai CW, Lin SY, Kuo CC, Huang CC. Serum uric acid and progression of kidney disease: a longitudinal analysis and mini-review. PLoS One. 2017; 12:e0170393.
crossref
14. Rincon-Choles H, Jolly SE, Arrigain S, Konig V, Schold JD, Nakhoul G, et al. Impact of uric acid levels on kidney disease progression. Am J Nephrol. 2017; 46:315–22.
crossref
15. Sellmayr M, Hernandez Petzsche MR, Ma Q, Kruger N, Liapis H, Brink A, et al. Only hyperuricemia with crystalluria, but not asymptomatic hyperuricemia, drives progression of chronic kidney disease. J Am Soc Nephrol. 2020; 31:2773–92.
crossref
16. Feig DI. Uric acid: a novel mediator and marker of risk in chronic kidney disease? Curr Opin Nephrol Hypertens. 2009; 18:526–30.
crossref
17. Mazzali M, Hughes J, Kim YG, Jefferson JA, Kang DH, Gordon KL, et al. Elevated uric acid increases blood pressure in the rat by a novel crystal-independent mechanism. Hypertension. 2001; 38:1101–6.
crossref
18. Kang DH, Nakagawa T, Feng L, Watanabe S, Han L, Mazzali M, et al. A role for uric acid in the progression of renal disease. J Am Soc Nephrol. 2002; 13:2888–97.
crossref
19. Zhou Y, Fang L, Jiang L, Wen P, Cao H, He W, et al. Uric acid induces renal inflammation via activating tubular NFκB signaling pathway. PLoS One. 2012; 7:e39738.
crossref
20. Xiao J, Zhang XL, Fu C, Han R, Chen W, Lu Y, et al. Soluble uric acid increases NALP3 inflammasome and interleukin1β expression in human primary renal proximal tubule epithelial cells through the Toll-like receptor 4-mediated pathway. Int J Mol Med. 2015; 35:1347–54.
crossref
21. Krishnan E, Pandya BJ, Chung L, Hariri A, Dabbous O. Hyperuricemia in young adults and risk of insulin resistance, prediabetes, and diabetes: a 15-year follow-up study. Am J Epidemiol. 2012; 176:108–16.
crossref
22. Li C, Hsieh MC, Chang SJ. Metabolic syndrome, diabetes, and hyperuricemia. Curr Opin Rheumatol. 2013; 25:210–6.
crossref
23. Hayden MR, Tyagi SC. Uric acid: a new look at an old risk marker for cardiovascular disease, metabolic syndrome, and type 2 diabetes mellitus: the urate redox shuttle. Nutr Metab (Lond). 2004; 1:10.
crossref
24. Perticone M, Maio R, Shehaj E, Gigliotti S, Caroleo B, Suraci E, et al. Sex-related differences for uric acid in the prediction of cardiovascular events in essential hypertension: a population prospective study. Cardiovasc Diabetol. 2023; 22:298.
crossref
25. Maloberti A, Maggioni S, Occhi L, Triglione N, Panzeri F, Nava S, et al. Sex-related relationships between uric acid and target organ damage in hypertension. J Clin Hypertens (Greenwich). 2018; 20:193–200.
crossref
26. Kolz M, Johnson T, Sanna S, Teumer A, Vitart V, Perola M, et al. Meta-analysis of 28,141 individuals identifies common variants within five new loci that influence uric acid concentrations. PLoS Genet. 2009; 5:e1000504.
crossref
27. Kim JY, Kim SJ, Nam CM, Moon KT, Park EC. Changes in prescription pattern, pharmaceutical expenditure and quality of care after introduction of reimbursement restriction in diabetes in Korea. Eur J Public Health. 2018; 28:209–14.
crossref
28. Baek JH, Yang YS, Ko SH, Han KD, Kim JH, Moon MK, et al. Real-world prescription patterns and barriers related to the use of sodium-glucose cotransporter 2 inhibitors among Korean patients with type 2 diabetes mellitus and cardiovascular disease. Diabetes Metab J. 2022; 46:701–12.
crossref

Fig. 1.
Kaplan–Meier curve illustrating the incidence of end-stage renal disease (ESRD). CKD, chronic kidney disease.
enm-2024-2020f1.tif
Fig. 2.
Forest plots of the subgroup analysis according to age, sex, diabetes duration, use of insulin and oral hypoglycemic agent (OHA). (A) Age, (B) sex, (C) diabetes mellitus (DM) duration, (D) use of insulin, (E) OHA <3. CKD, chronic kidney disease; HR, hazard ratio; CI, confidence interval.
enm-2024-2020f2.tif
enm-2024-2020f3.tif
Table 1.
Baseline Characteristics of Patients Included in the Four Groups
Characteristic CKDGout (n=759,374) CKDGout+ (n=21,685) CKD+Gout (n=81,225) CKD+Gout+ (n=5,498) P value
Age, yr 56.4±11.8 57.9±10.8 65.6±11.6 66.1±9.9 <0.001
Male sex 474,196 (62.5) 17,521 (80.8) 39,995 (49.2) 4,247 (77.3) <0.001
BMI, kg/m2 25.0±3.3 25.7±3.3 24.9±3.3 25.4±3.2 <0.001
Systolic BP, mm Hg 129.0±15.8 130.2±15.6 130.7±16.8 131.1±17.0 <0.001
Diastolic BP, mm Hg 79.2±10.2 80.1±10.3 78.3±10.5 78.6±11.0 <0.001
FBG, mg/dL 147.5±49.4 140.1±45.9 141.9±52.9 133.0±49.4 <0.001
TC, mg/dL 197.7±42.3 194.0±44.3 195.5±44.9 187.8±45.4 <0.001
Triglyceride, mg/dL 148.4 (148.2–148.6) 168.5 (167.1–169.9) 151.1 (150.5–151.7) 165.2 (162.8–167.6) <0.001
HDL-C, mg/dL 52.3±25.4 50.7±22.5 55.3±52.9 49.6±37.4 <0.001
LDL-C, mg/dL 111.0±43.2 103.1±42.2 110.9±42.6 102.6±43.0 <0.001
eGFR, mL/min/1.73 m2 89.8±15.3 86.1±15.4 41.7±19.5 42.4±16.2 <0.001
Smoking status <0.001
 Nonsmoker 413,983 (54.5) 9,673 (44.6) 54,042 (66.5) 2,976 (54.1)
 Former smoker 138,316 (18.2) 5,701 (26.3) 14,012 (17.3) 1,552 (28.2)
 Current smoker 207,075 (27.3) 6,311 (29.1) 13,171 (16.2) 970 (17.6)
Alcohol consumption <0.001
 None 421,679 (55.5) 9,991 (46.1) 58,640 (72.2) 3,616 (65.8)
 Mild 258,496 (34.0) 8,413 (38.8) 18,609 (22.9) 1,496 (27.2)
 Heavy 79,199 (10.4) 3,281 (15.1) 3,976 (4.9) 386 (7.0)
Regular exercise 164,589 (21.7) 5,171 (23.9) 16,402 (20.2) 1,261 (22.9) <0.001
Comorbidities
 Hypertension 415,691 (54.7) 14,665 (67.6) 60,077 (74.0) 4,700 (85.5) <0.001
 Dyslipidemia 298,387 (39.3) 10,617 (49.0) 39,041 (48.1) 3,104 (56.5) <0.001
Income, low 25% 158,278 (20.8) 4,217 (19.5) 14,809 (18.2) 996 (18.1) <0.001
OHA
 Metformin 331,017 (43.6) 10,516 (48.5) 40,933 (50.4) 2,496 (45.4) <0.001
 Sulfonylurea 357,501 (47.1) 11,003 (50.7) 47,161 (58.1) 3,248 (59.1) <0.001
 Meglitinide 14,288 (1.9) 474 (2.2) 2,948 (3.6) 309 (5.6) <0.001
 Thiazolidinedione 59,296 (7.8) 1,955 (9.0) 7,053 (8.7) 537 (9.8) <0.001
 DPP-4 inhibitor 23,676 (3.1) 801 (3.7) 2,472 (3.0) 184 (3.4) <0.001
 AGI 103,031 (13.6) 3,212 (14.8) 16,998 (20.93) 1,207 (22.0) <0.001
OHAs ≥3 115,250 (15.2) 3,518 (16.2) 16,735 (20.6) 1,030 (18.7) <0.001
Insulin user 58,638 (7.7) 1,983 (9.1) 12,880 (15.9) 1,130 (20.6) <0.001
Duration of diabetes, ≥5 yr 238,715 (31.4) 7,189 (33.2) 38,436 (47.3) 2,716 (49.4) <0.001

Values are expressed as mean±standard deviation, number (%), or median (interquartile range). One-way analysis of variance and the chi-square test were used to compare the characteristics of the study patients at baseline. Post hoc multiple comparison analysis was performed using the Bonferroni correction, and triglyceride levels were log-transformed for analysis.

CKD, chronic kidney disease; BMI, body mass index; BP, blood pressure; FBG, fasting blood glucose; TC, total cholesterol; HDL-C, high-density lipoprotein cholesterol; LDL-C, low-density lipoprotein cholesterol; eGFR, estimated glomerular filtration rate; OHA, oral hypoglycemic agent; DPP-4, dipeptidyl peptidase 4; AGI, alpha-glucosidase inhibitor.

Table 2.
HR and 95% CI for the Incidence of ESRD Based on the Presence of CKD and Gout
Variable ESRD events, n Follow-up duration, PY Incidence rate, /1,000 PY Unadjusted HR (95% CI) Multivariate adjusted HR (95% CI)
Model 1 Model 2
CKDGout (n=759,374) 5,241 6,803,721 0.77 1 (ref.) 1 (ref.) 1 (ref.)
CKDGout+ (n=21,685) 257 191,510 1.34 1.75 (1.54–1.98) 1.48 (1.31–1.68) 1.49 (1.32–1.69)
CKD+Gout (n=81,225) 5,395 658,237 8.20 10.85 (10.45–11.27) 10.22 (9.81–10.64) 8.45 (8.11–8.80)
CKD+Gout+ (n=5,498) 932 40,413 23.06 31.11 (29.01–33.35) 22.66 (21.08– 24.36) 18.90 (17.58–20.32)

Model 1 was adjusted for age, sex, body mass index, alcohol consumption status, smoking status, regular exercise, low 25% income, and the presence of hypertension and dyslipidemia; Model 2 was adjusted for the factors in model 1 as well as fasting blood glucose, duration of diabetes, prescription number of oral hypoglycemic agents, and insulin users.

HR, hazard ratio; CI, confidence interval; ESRD, end-stage renal disease; CKD, chronic kidney disease; PY, person-year.

TOOLS
Similar articles