Abstract
Background
Methods
Results
Supplementary Material
Supplemental Table S1.
Supplemental Table S2.
Supplemental Fig. S1.
Notes
AUTHOR CONTRIBUTIONS
Conception or design: H.S., J.H.M., S.H.K., H.C.J. Acquisition, analysis, or interpretation of data: H.S., J.H.M., S.H.K., H.C.J. Drafting the work or revising: H.S., J.H.M., S.H.C., N.H.C., S.H.K., H.C.J. Final approval of the manuscript: H.S., J.H.M., S.H.C., N.H.C., S.H.K., H.C.J.
ACKNOWLEDGMENTS
REFERENCES
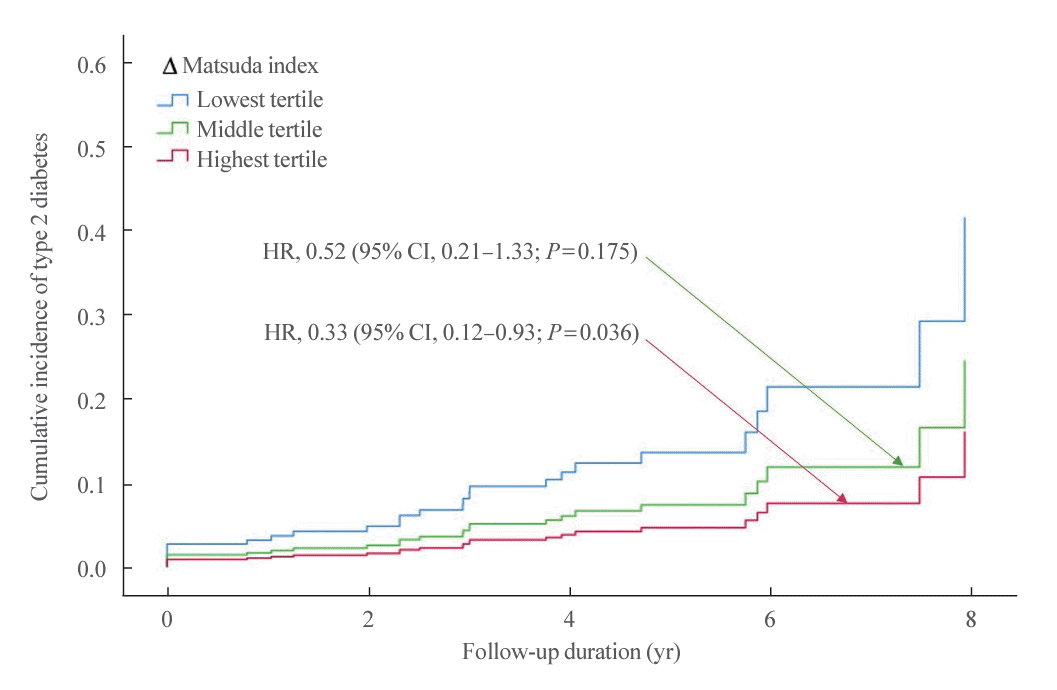
Fig. 1.

Table 1.
| Characteristic | Did not develop T2DM (n=288) | Progression to T2DM (n=59) | P value |
|---|---|---|---|
| Age at delivery, yr | 31.6±4.1 | 32.1±4.4 | 0.396 |
| Body mass index, pregestational, kg/m2 | 21.9±3.1 | 24.5±3.5 | <0.001 |
| BMI change, kg/m2 | –0.1±1.3 | 0.0±1.2 | 0.978 |
| Parity, n | 2.1±1.6 | 1.9±1.7 | 0.369 |
| Exercise | 99 (34.4) | 25 (41.7) | 0.283 |
| Breastfeeding | 102 (35.4) | 9 (15.0) | 0.002 |
| 100-g OGTT at mid-gestation | |||
| Glucose (fasting), mg/dL | 87.9±11.2 | 100.5±14.1 | <0.001 |
| Glucose (1-hour), mg/dL | 185.9±28.4 | 203.7±36.6 | <0.001 |
| Glucose (2-hour), mg/dL | 172.7±27.1 | 195.8±33.9 | <0.001 |
| Glucose (3-hour), mg/dL | 145.6±25.8 | 165.3±31.8 | <0.001 |
| Insulin (fasting), μIU/mL | 8.7±6.8 | 9.3±3.8 | 0.023 |
| Insulin (1-hour), μIU/mL | 65.2±49.0 | 45.9±37.8 | 0.004 |
| Insulin (2-hour), μIU/mL | 88.1±61.7 | 64.3±50.8 | 0.005 |
| Insulin (3-hour), μIU/mL | 75.7±52.2 | 60.9±38.6 | 0.033 |
| 75-g OGTT at initial postpartum visit (postpartum 2 months) | |||
| Glucose (fasting), mg/dL | 90.2±8.9 | 121.1±46.2 | <0.001 |
| Glucose (30-minute), mg/dL | 154.9±25.7 | 200.4±57.9 | <0.001 |
| Glucose (60-minute), mg/dL | 160.2±36.4 | 241.5±82.8 | <0.001 |
| Glucose (90-minute), mg/dL | 138.4±33.3 | 231.7±78.2 | <0.001 |
| Glucose (120-minute), mg/dL | 122.5±28.4 | 208.4±86.1 | <0.001 |
| Insulin (fasting), μIU/mL | 10.2±5.3 | 12.0±6.2 | 0.026 |
| Insulin (30-minute), μIU/mL | 42.3±25.6 | 32.0±19.1 | 0.003 |
| Insulin (60-minute), μIU/mL | 52.0±34.5 | 42.1±24.9 | 0.035 |
| Insulin (90-minute), μIU/mL | 48.5±33.3 | 53.8±40.2 | 0.288 |
| Insulin (120-minute), μIU/mL | 43.4±31.3 | 53.3±46.5 | 0.042 |
| Longitudinal changes in glycemic measures | |||
| Matsuda index | |||
| Antepartum | 5.2±2.7 | 5.0±2.8 | 0.524 |
| Postpartum | 5.3±2.3 | 3.9±2.2 | <0.001 |
| P valuea | 0.717 | 0.010 | |
| Mean difference | 0.1±3.0 | –1.0±3.3 | 0.011 |
| HOMA-IR | |||
| Antepartum | 1.9±1.1 | 2.3±1.0 | 0.002 |
| Postpartum | 2.3±1.3 | 3.8±3.5 | <0.001 |
| P valuea | <0.001 | 0.003 | |
| Mean difference | 0.4±1.4 | 1.4±3.5 | <0.001 |
| Insulinogenic index | |||
| Antepartum | 0.7±1.9 | 0.4±0.3 | 0.195 |
| Postpartum | 0.6±0.4 | 0.3±0.2 | <0.001 |
| P valuea | 0.201 | 0.028 | |
| Mean difference | –0.1±1.8 | –0.1±0.3 | 0.872 |
| HOMA-β | |||
| Antepartum | 141.7±98.3 | 109.6±98.4 | 0.023 |
| Postpartum | 150.8±112.4 | 100.7±63.8 | 0.001 |
| P valuea | 0.288 | 0.531 | |
| Mean difference | 9.1±145.4 | –8.9±107.9 | 0.369 |
| Disposition index | |||
| Antepartum | 2.6±3.3 | 1.6±1.1 | 0.023 |
| Postpartum | 2.7±2.3 | 1.0±1.0 | <0.001 |
| P valuea | 0.646 | 0.002 | |
| Mean difference | 0.1±3.9 | –0.6±1.3 | 0.195 |
Values are expressed as mean±standard deviation or number (%). ΔMatsuda index was defined as the difference between the initial postpartum Matsuda index and the gestational Matsuda index. P values are for the t test or chi-square test to compare subjects with and without the occurrence of type 2 diabetes.
T2DM, type 2 diabetes; OGTT, oral glucose tolerance test; HOMA-IR, homeostasis model assessment of insulin resistance; HOMA-β, homeostasis model assessment of β-cell function.
Table 2.
Values are expressed as number (%). ΔMatsuda index was defined as the difference between the initial postpartum Matsuda index and the gestational Matsuda index. Lowest tertiles ranged from –10.9 to –1.1, middle tertile from –1.0 to 1.0, highest tertile ranged from 1.0 to 8.5. P values are for the chisquare test to compare the occurrence of postpartum T2DM and combined with postpartum prediabetes across the tertiles.
T2DM, type 2 diabetes.
Table 3.
| Variable |
Univariatea |
Multivariateb |
||
|---|---|---|---|---|
| HR (95% CI) | P value | HR (95% CI) | P value | |
| ∆Matsuda index tertile | ||||
| Lowest tertile | 1 (reference) | 1 (reference) | ||
| Middle tertile | 0.72 (0.29–1.79) | 0.484 | 0.52 (0.21–1.33) | 0.175 |
| Highest tertile | 0.59 (0.22–1.59) | 0.293 | 0.33 (0.12–0.93) | 0.036 |
| Fasting plasma glucose | 1.05 (1.03–1.08) | <0.001 | 1.06 (1.03–1.09) | <0.001 |
| Postpartum body mass index | 1.18 (1.06–1.32) | <0.001 | 1.16 (1.03–1.30) | 0.015 |
| Age at birth | 0.99 (0.90–1.09) | 0.869 | 0.93 (0.84–1.04) | 0.203 |
| Family history of diabetes | 1.00 (0.47–2.17) | 0.992 | 0.98 (0.43–2.19) | 0.950 |
| Parity | 0.90 (0.69–1.16) | 0.414 | 0.87 (0.67–1.13) | 0.305 |
HR of postpartum type 2 diabetes are calculated using Cox proportional model including ΔMatsuda index and variables associated with postpartum type 2 diabetes. ΔMatsuda index was defined as the difference between the initial postpartum Matsuda index and the gestational Matsuda index. Lowest tertiles ranged from –10.9 to –0.9, middle tertile from –0.8 to 1.2, highest tertile ranged from 1.2 to 8.8.
HR, hazard ratio; CI, confidence interval.


 PDF
PDF Citation
 Print
Print


 XML Download